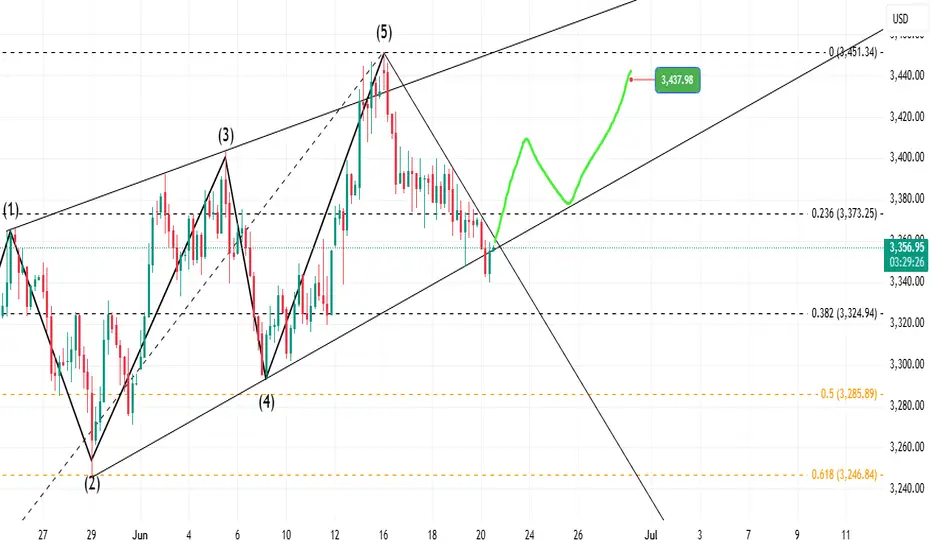
What Happens Next? Down move still continues!?The price is at the bottom line of the previous diagonal move's lower trend line. Momentum in price and volume indicates an up move is on the way. My prediction is to see a price around 3440.
Wave Analysis
GBPCAD: Expecting Bearish Movement! Here is Why:
Balance of buyers and sellers on the GBPCAD pair, that is best felt when all the timeframes are analyzed properly is shifting in favor of the sellers, therefore is it only natural that we go short on the pair.
Disclosure: I am part of Trade Nation's Influencer program and receive a monthly fee for using their TradingView charts in my analysis.
❤️ Please, support our work with like & comment! ❤️

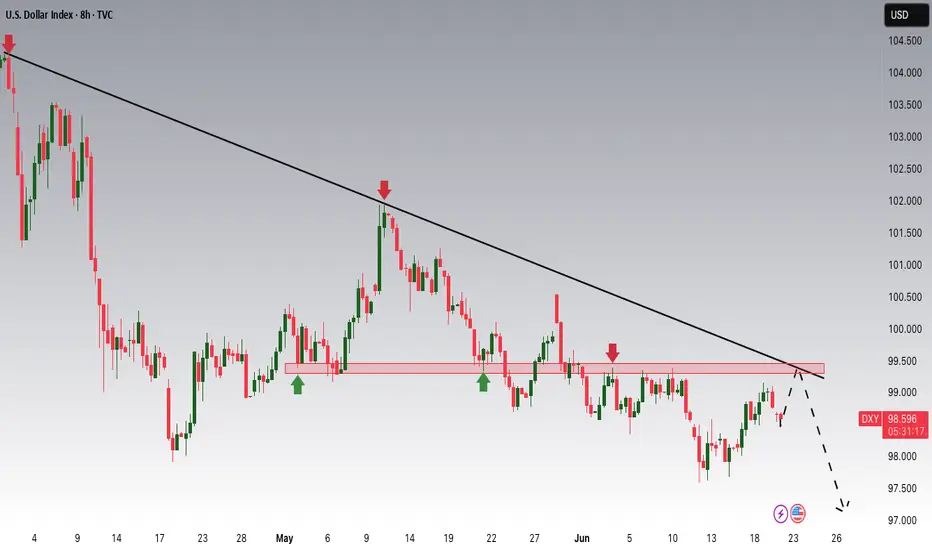
DXY Potential DownsidesHey Traders, in today's trading session we are monitoring DXY for a selling opportunity around 99.300 zone, DXY is trading in a downtrend and currently is in a correction phase in which it is approaching the trend at 99.300 support and resistance area.
Trade safe, Joe.
GBPUSD London Session | Live Forex Analysis & Trade ideasIn today’s London session, we conducted a detailed intraday analysis on the GBPUSD currency pair using wave structure analysis on the 5-minute (M5) timeframe.
Price action confirmed a break below bullish market structure that had previously formed the Asian session high, signalling a potential shift in market sentiment to the downside. This breakdown confirmed short-term bearish momentum shift.
Following the completion of the bearish wave, the price retraced to form a structural pullback (trend reset), providing a discounted price zone for new short positions and offering profit-taking opportunities for earlier sellers.
Our trading plan for this session is to sell GBPUSD at 1.3488, anticipating a move below the midline (ML) support at 1.3462. The technical target for this trade, based on our London-New York session projection, is set at 1.3417.
The stop-loss for this setup is placed above MH of the bearish structure at 1.3505, maintaining proper risk management.
This trade idea aligns with our trend-following strategy and is supported by real-time price action analysis.
📉 Short Bias Confirmed
🎯 Entry: 1.3488
🛑 Stop Loss: 1.3505
✅ Take Profit: 1.3417
Trade safe, manage your risk, and stay blessed.

DXY Eyes Key Long-Term Support from 2008The U.S. Dollar Index (DXY) is currently trading near three-year lows, reflecting concerns over economic fragility and heightened geopolitical tensions.
If price action holds below 97, the DXY could face additional pressure, potentially descending toward the lower boundary of a long-term channel that has held since the 2008 lows. Key support levels at 96 and 94 may offer potential rebound zones.
Monthly RSI reflects more downside potential towards oversold conditions last seen in 2021. To reverse the current bearish momentum, the index would need to regain and hold above the 100-mark, which could shift sentiment back toward a bullish rebound outlook against the markets.
- Razan Hilal, CMT

RUPL LONG TRADE 18-06-2025 (Synthetic & Ryon Sector)RUPL LONG TRADE
After hitting a low of 16.70, RUPL consolidated within a trading range (16.00 - 24.55) marked by a yellow channel. A breakdown followed, forming a bearish channel (light blue), which is essentially a bull flag. Recently, the stock broke out of this channel with a spike, signaling an upward move. After a pullback, RUPL formed bullish measuring gaps and a bullish IFDZ, indicating a safe entry point.
🚨 TECHNICAL BUY CALL – RUPL🚨
1. BUY1: 20.34 (Current Price)
2. BUY2: 18.9
3. BUY3: 17.8
TP1: 22.3
TP2: 24.5
TP3: 27.7
Stop Loss: Below 16.3 on closing basis
Risk-Reward Ratio: 2.83
Caution: Please buy in 3 parts in buying range. Close at least 50% position size at TP1 and then trail SL to avoid losing incurred profits in case of unforeseen market conditions.
PLEASE BOOST AND SHARE THE IDEA IF YOU FIND IT HELPFUL.
GOLD (XAUUSD) – Wave b Complete? Preparing for Wave c RallyGold tapped into the key demand zone and swept sell-side liquidity (SSL) beneath wave (iii) lows.
A five-wave decline appears complete, with wave (v) of b terminating just below the o.618 fib extension at 3344.86.
🟢 Wave c projection now in focus — looking for a 5-wave impulsive rally to develop.
Targeting the Sell Zone between the 0.5–0.764 retracement (3395.87–3425.07).
🧠 Structure Notes:
✅ Imbalance Zone (IMB) formed during the breakdown has now been tapped
🔻 SSL swept + bullish reaction = potential change of state
🟢 Wave (i) and (ii) projection underway – price needs to maintain structure above 3357.43 for bullish continuation
Targets: 3408.81 (0.618 Fib)
Invalidation below: 3340.31
Momentum and RSI divergence support reversal

AMAZON Local Short! Sell!
Hello,Traders!
AMAZON made a retest
Of the horizontal resistance
Around 219$ and the stock
Is already making a local
Bearish pullback so a further
Bearish correction
Is to be expected
Sell!
Comment and subscribe to help us grow!
Check out other forecasts below too!
Disclosure: I am part of Trade Nation's Influencer program and receive a monthly fee for using their TradingView charts in my analysis.

Gold in the Spotlight – Safe Haven or Short-Term Speculation?Hello everyone, great to see you again in our latest discussion about XAUUSD.
This week, gold has seen wild swings—soaring to new highs amid geopolitical tensions, then sharply pulling back. This highlights gold’s dual nature: both a safe-haven asset in times of crisis and a highly reactive instrument during speculative surges.
The Fed’s decision to hold interest rates at 4.50% and maintain a cautious stance on monetary policy continues to weigh on the precious metal. Still, growing expectations of rate cuts later this year remain a key bullish factor for gold, which doesn’t generate yield.
Meanwhile, persistent conflicts in the Middle East and the ongoing Russia–Ukraine war are fueling defensive investment demand. Central banks around the world are also steadily accumulating gold, reinforcing its role as a hedge against global economic and political uncertainty.
As for me, I remain optimistic about long-term upside potential. What are your expectations for gold?

BITCOIN BEARS WILL DOMINATE THE MARKET|SHORT
BITCOIN SIGNAL
Trade Direction: short
Entry Level: 105,952.89
Target Level: 102,605.64
Stop Loss: 108,184.39
RISK PROFILE
Risk level: medium
Suggested risk: 1%
Timeframe: 4h
Disclosure: I am part of Trade Nation's Influencer program and receive a monthly fee for using their TradingView charts in my analysis.
✅LIKE AND COMMENT MY IDEAS✅

Gold Longlooking to the upside on Gold from Asia lows. This is a prelim entry (forecast) need to seek bullish PA around the FVG if we get a pull back. If a pull back does not form we will wait for a break and RT above 3,352 and plan entries accordingly.

ALAB - EASY SHOT UPGood Morning,
Hope all is well. As you can see ALAB has built some momentum on the news of strategic partnerships for AI technologies with NVIDIA. The next resistance is easily broken, with this momentum there is no reason for ALAB to not hit above 140$.
ENJOY!

GBPUSD SHORT/SELL 1:3.5Reason for selling:
* Break of structure
* B wave of corrective structure forming
* Expanding flat forming
* MACD divergence
* Liquidity under 1.33860
Strategy to use: FIB retracement on 50/61.8
Engulfing candle to the downside
Entry: 1.35616
Stop Loss: 1.36155
Take Profit: 1.33875

PACE LONG TRADE 16-06-2025PACE LONG TRADE
Rationale
PACE recently completed an ABC correction within a bearish channel, which acted as a bull flag. The stock broke out of this channel with significantly high volumes (5x) and strong follow-through, indicating potential upside.
🚨 TECHNICAL BUY CALL – PACE🚨
- Buy 1: Current level (Rs. 6.32)
- Buy 2: Rs. 5.9
- Buy 3: Rs. 5.7
- TP 1: Rs. 6.7
- TP 2: Rs. 7.0
- TP 3: Rs. 7.4
- TP 4: Rs. 7.8
Stop Loss - Below Rs. 5.5 closing basis
Risk-Reward Ratio- 1:3.2
Caution: Close at least 50% position size at TP1 and then trail SL to avoid losing incurred profits in case of unforeseen market conditions.
PLEASE BOOST AND SHARE THE IDEA IF YOU FIND IT HELPFUL.

GOLD/USD Price fails to break above, showing strong selling 1. Supply Zone (Top-Right):
Multiple bearish reactions.
Price fails to break above, showing strong selling pressure.
2. Demand Zone (Lower-Mid):
Previous bullish reaction zone.
Price is currently testing this demand area again for a potential long setup.
3. Liquidity Zones:
Equal lows and equal highs suggest liquidity resting below and above, potential for stop hunts before real move.
---
📌 Trade Setup
Entry: Long trade initiated from demand zone.
Stop Loss: Tightly placed below the refined demand zone.
Take Profit: Extended to prior structure highs near the supply zone.
Risk-Reward: Approx. 1:4+ — strong RRR (Risk-to-Reward Ratio), indicating disciplined execution.
---
🔧 Technical Tools Used
Imbalance Zones: Highlighted areas where price moved too quickly (FVG - Fair Value Gaps).
Mitigation Blocks: Zones where previous supply/demand has been mitigated, aligning with institutional concepts.
Refined OBs (Order Blocks): Marked for sniper entries.
---
🎯 Professional Insights
This chart demonstrates smart money concepts: price respecting refined institutional levels and reacting to liquidity zones.
The bullish setup from demand aligns with a potential market reversal or deeper pullback in a larger bearish leg.
The trader is executing with precision, aiming for maximum efficiency in entry and risk control.

Gold will open higher next week!!!
The current short-term focus is still on the Middle East issue. The conflict between Iran and Israel continues to ferment. Trump announced that the US military launched strikes on Iran's three major nuclear facilities, Fordow, Natanz and Isfahan, and dropped 6 bunker-buster bombs. The US's participation in the war means that the Iran-Israel escalation is in the middle of the war. This news instantly ignited the Middle East powder keg. Iran responded quickly, saying that it had completed the evacuation of personnel from relevant nuclear facilities before the attack, and made a strong statement that every American citizen and military personnel in the region were listed as legitimate targets. The Atomic Energy Organization of Iran directly pointed out that the US behavior violated international law and emphasized that the attack could not stop the development of its nuclear industry.
The development of the situation is full of uncertainty and gunpowder. Iran is very likely to launch a retaliatory attack on the US military bases and related interests in the Gulf region, and the Iraqi armed groups allied with Iran are also at risk of being involved in the battle. It is reported that the United States is accelerating the evacuation of diplomats from Iraq, which indirectly reflects the tension of the situation. In Yemen, the Houthi armed forces have made it clear that if Iran is attacked, they will break the brief ceasefire with the United States and start attacking American ships. Although Hezbollah in Lebanon has not taken action yet, it has released a dangerous signal last week, suggesting that it will support Iran in an "appropriate way". Once it intervenes, the conflict with Israel that has caused devastating damage is likely to revive. What is more worthy of attention is that if Iran blocks the Strait of Hormuz, as the throat of about 20% of the world's oil transportation, this move will hit the global economy hard and will also bring a fatal blow to energy exporters in the Gulf region.
Now that the situation in the Middle East has deteriorated sharply, gold, as a traditional safe-haven asset, has quickly activated its safe-haven value in this environment full of uncertainty and risk. Whether it is a direct conflict between the United States and Iran or a possible chain reaction, the market is filled with panic and drives funds to gold. Therefore, driven by the strong demand for safe-haven, gold is expected to have a counterattack opportunity next week.
Gold fell first and then rose on Friday. It fluctuated and fell in the Asian session, and the US session fell to around 3340 for the second time and then rose. The US participation in the war means that the conflict between Iran and Israel will escalate. Gold is expected to open higher next Monday. For the operation strategy next week, there is no doubt that it is mainly buying in line with the trend, buying on pullbacks, buying on breakthroughs, and avoiding short orders. Pay attention to the pull-up of the Asian session on Monday. If there is a strong pull-up, you can choose to buy more when there is a pullback in the European and American sessions. The strong pressure above is in the 3400-3410 area, and the upward space will be opened after a breakthrough.

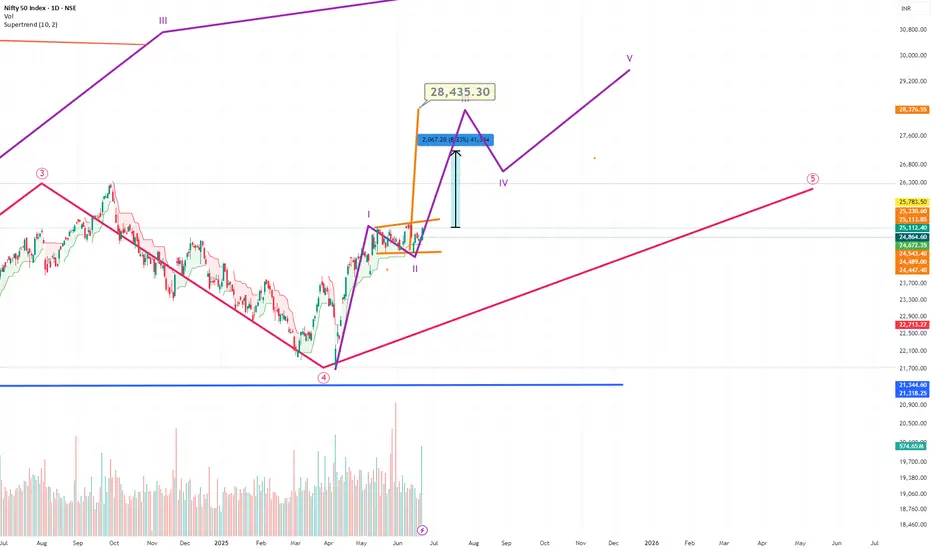
NIFTY Future path..Up to 28000Please note that Nifty is in a medium 5th wave..in which it is completed or completing its 2nd wave...that means we will have a 3rd wave up to 28000 Minimum...as per Neo waves..calculated by adding 1.l618 of the 1st wave...tgt is 28400 minimum....Remember mkts have climbed walls of worry....which is a sign of bullish markets...
Key support level for gold price to rise: 3340Key support level for gold price to rise: 3340
Analysis of current gold price trend:
As shown in Figure 4h: The white channel clearly reflects the current upward trend of gold price.
Latest fluctuations:
On June 20, the gold price once fell to 3340.31 US dollars per ounce. Market sentiment is affected by the Fed's policy and geopolitical situation.
Strong support level: around 3340
Core factors currently affecting the gold market:
(1) Fed policy and US dollar trend
The Fed's June interest rate meeting kept interest rates unchanged, sending a "hawkish" signal. The US dollar index rebounded to 98.8, suppressing gold prices.
The market's expectations for interest rate cuts have cooled. If subsequent economic data (such as non-agricultural employment and CPI) perform strongly, interest rate cuts may be further delayed, and gold prices may be under pressure at 3375.
Strong resistance level: 3375
(2) Geopolitical risks
Middle East situation: The conflict between Israel and Iran once pushed up the gold price to $3444 (June 13), but the recent easing of the situation has led to a weakening of safe-haven demand.
Russia-Ukraine conflict: If the situation escalates or NATO intervenes, it may boost the safe-haven demand for gold again.
(3) Supply, demand and market sentiment
Supply side: Mineral gold growth is weak (the growth rate in the first half of 2025 is only 0.5%), recycled gold is "reluctant to sell" due to the high gold price, and global supply remains in a tight balance.
Demand side:
Investment demand: Gold ETF holdings increased (European and American institutions increased their holdings), but some funds turned to alternative assets such as silver.
3. Short-term and long-term outlook
(1) Short-term (next week)
International gold price: expected to fluctuate in the range of US$3,250-3,500
Key resistance level: US$3,400, support level: US$3,300
(2) Medium-term
Upward logic: Global central banks continue to buy gold (the People's Bank of China has increased its holdings for seven consecutive months), the trend of de-dollarization and inflation expectations support gold prices.
Downside risks: If the Fed's stance turns to a tougher stance, geopolitical risks ease or gold recycling supply exceeds expectations, gold prices may fall back to US$3,250-3,300.
Short-term strategy:
Focus on a breakthrough of US$3,375-3,400. If it stabilizes, it may trigger further gains;
If it falls below US$3,350-3,340, it may fall to the support level of US$3,300.

EUR-GBP Growth Ahead! Buy!
Hello,Traders!
EUR-GBP keeps growing
And the pair is already
Making a bullish rebound
From the horizontal support
Level of 0.8540 so we are
Bullish biased and we will
Be expecting a further
Bullish continuation
Buy!
Comment and subscribe to help us grow!
Check out other forecasts below too!
Disclosure: I am part of Trade Nation's Influencer program and receive a monthly fee for using their TradingView charts in my analysis.

CSE ASI BEARISH SETUPThe monthly chart of the CSE All Share Price Index (ASI) reveals a technically significant scenario: the index is currently testing the upper boundary of a long-term ascending channel while also aligning with the 1.618 Fibonacci extension, both of which signal potential reversal pressure ahead.
Key Observations:
Long-Term Resistance: The price is testing the channel’s upper resistance line near the 17,000 – 17,700 zone, where rejection often occurs historically.
Fibonacci Confluence: The current high coincides with the 1.618 Fibonacci extension, a critical level where long rallies often stall or reverse.
Bearish Candlestick Pattern: The formation of a potential bearish reversal candle near the resistance zone is an early signal of seller interest.
Expected Retracement Levels:
Initial support lies at the 0.382 and 0.5 Fibonacci retracement zones, around 15,000 – 14,000.
Deeper correction could target the 0.618 level (~13,000), which aligns with previous breakout structure and the channel midline.
Conclusion:
The ASI appears overextended after a strong bullish leg and is currently showing signs of exhaustion at the top of a multi-year channel. Unless price breaks above and sustains above 17,700, a correction toward the 13,000–14,000 zone is likely, supported by Fibonacci retracement levels and the channel structure.
This presents a potential medium-term bearish outlook for investors and swing traders, with caution advised around current highs.


Chart Pattern Analysis Of Bitcoin
K5 close below K2,
It verified the resistance or the bear gap at K2.
It seems that the following candles will fall to test 0.382-0.5fib area.
I will try to buy it there.
I don’t think the three years bull market will be terminated here,
I am expecting another bull run to test or break up the resistance again.
On the other hand,
If K6 or the following candles finally close below 0.5fib line or the uptrend line,
A potential double top bear market will finally come up.
Long-96888/Stop-95888/Target-115K

TRBUSDT - at CUT n REVERSE Area? What's next??#TRBUSDT - market just reached at his ultimate supporting region and below that we can expect a further straight drop.
So we will cut n reverse below our mentioned region that is around 35 (region neck line)
Good luck
trade wisely
