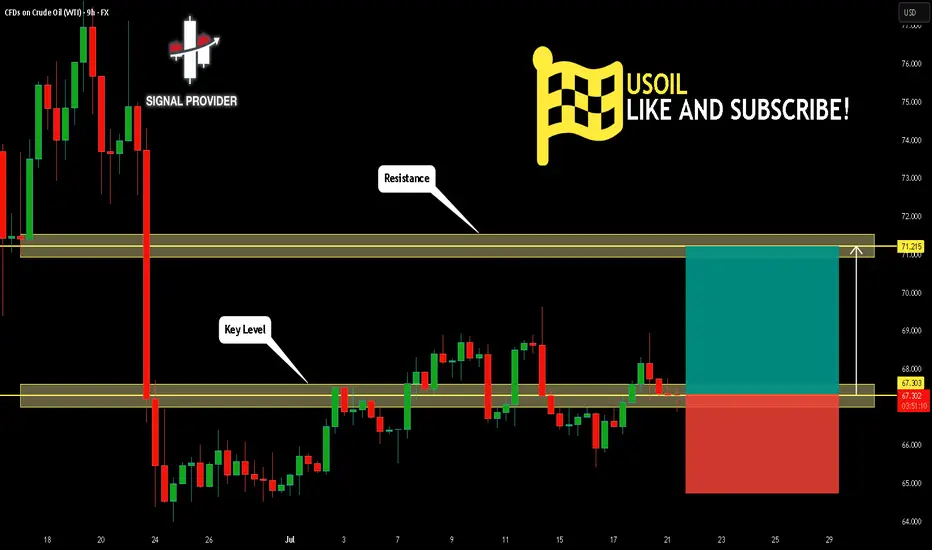
USOIL Will Go Higher! Buy!
Take a look at our analysis for USOIL.
Time Frame: 9h
Current Trend: Bullish
Sentiment: Oversold (based on 7-period RSI)
Forecast: Bullish
The market is approaching a key horizontal level 67.303.
Considering the today's price action, probabilities will be high to see a movement to 71.215.
P.S
We determine oversold/overbought condition with RSI indicator.
When it drops below 30 - the market is considered to be oversold.
When it bounces above 70 - the market is considered to be overbought.
Disclosure: I am part of Trade Nation's Influencer program and receive a monthly fee for using their TradingView charts in my analysis.
Like and subscribe and comment my ideas if you enjoy them!
Wave Analysis
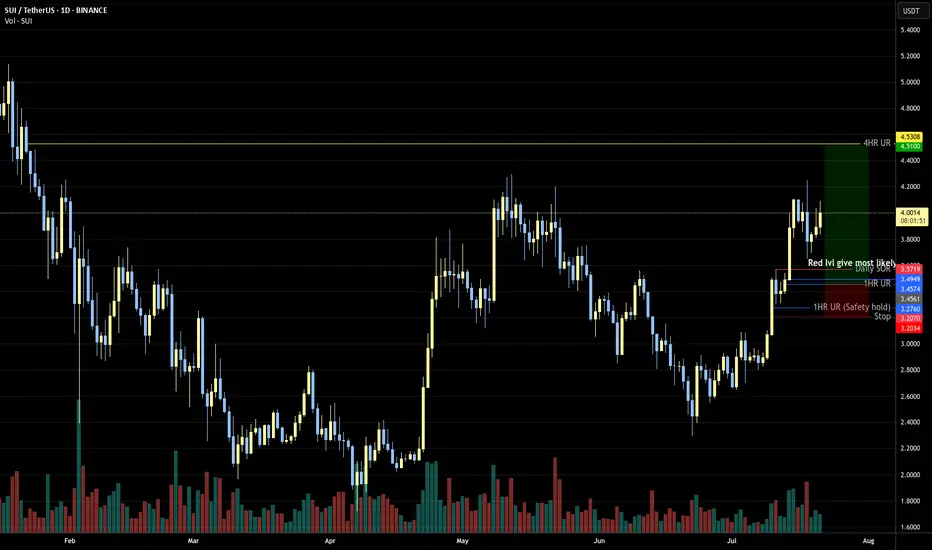
2.5-4RRI believe this can fill in the next day or 2, RR depends on the lvl taken, Sui is currently in a very bullish move so it makes sense to take the higher red lvl for lower RR IMHO.
Metals SupercycleAnother bullish looking chart in the metals space. This time it's the Blackrock World Mining Trust chart, which has shown strength in recent weeks and is breaking resistance levels.
- Cup and Handle formation, breaking out of the handle
- Golden cross, the 50 day has just crossed the 200 day moving average
- Golden remains close to all time highs, copper looks strong and iron ore demand likely to rise in the near future if the Chinese stimulus package is announced.
- End of the ABC correction, buyers are now stepping in and the path of least resistance is to the upside.
Not financial advice, do what's best for you.

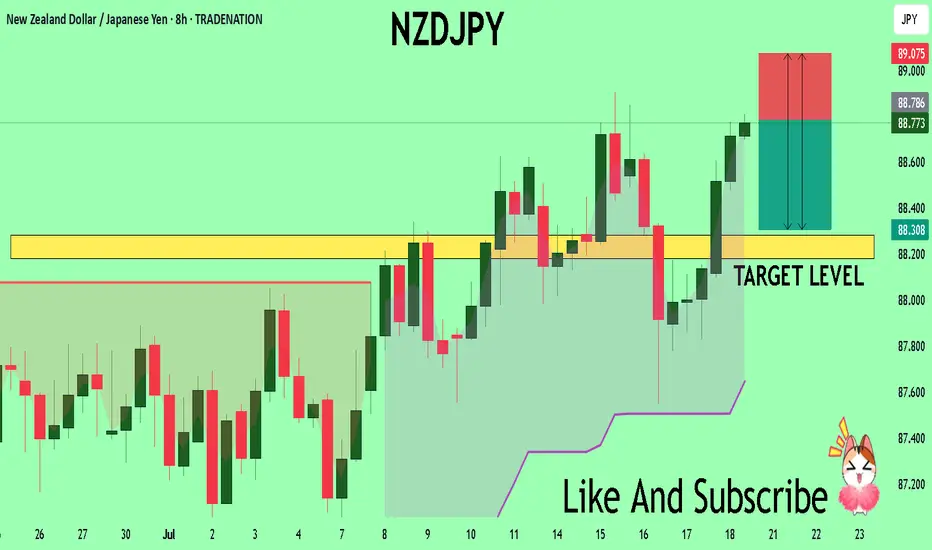
NZDJPY Set To Fall! SELL!
My dear subscribers,
My technical analysis for NZDJPY is below:
The price is coiling around a solid key level - 88.786
Bias - Bearish
Technical Indicators: Pivot Points Low anticipates a potential price reversal.
Super trend shows a clear sell, giving a perfect indicators' convergence.
Goal - 88.284
My Stop Loss - 89.075
About Used Indicators:
By the very nature of the supertrend indicator, it offers firm support and resistance levels for traders to enter and exit trades. Additionally, it also provides signals for setting stop losses
Disclosure: I am part of Trade Nation's Influencer program and receive a monthly fee for using their TradingView charts in my analysis.
———————————
WISH YOU ALL LUCK
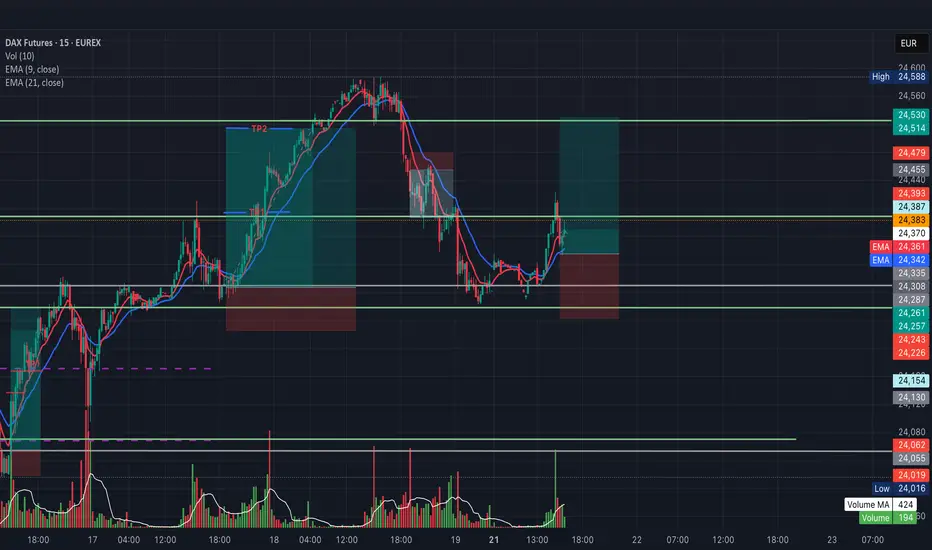
DAX Futures (FDAX1!) – Intraday Long Setup from SupportInstrument: FDAX1! (DAX Futures – EUREX)
Chart: 15 mins
Type: Intraday / Day Trade
DAX Futures is holding support near 24,259 after a recent pullback. Watching for a potential bounce if price remains above this level, with a move toward intraday highs as a possible target.
This setup is valid only for today session.
📌 Not financial advice – for educational purposes only.
S&P's "hugely overbought" towards 6375!1). Position Volume dropping! 2). Big institutions (Banks & Insurance) have backed off on higher Risk positions! 3). Huge resistance at .728 fib & trend! 4). Trump tariff talk is likely adding to a fall as well! 5). We're looking for a "SELL" trade @ 6375, since buying is too risky at the moment...Good Luck!

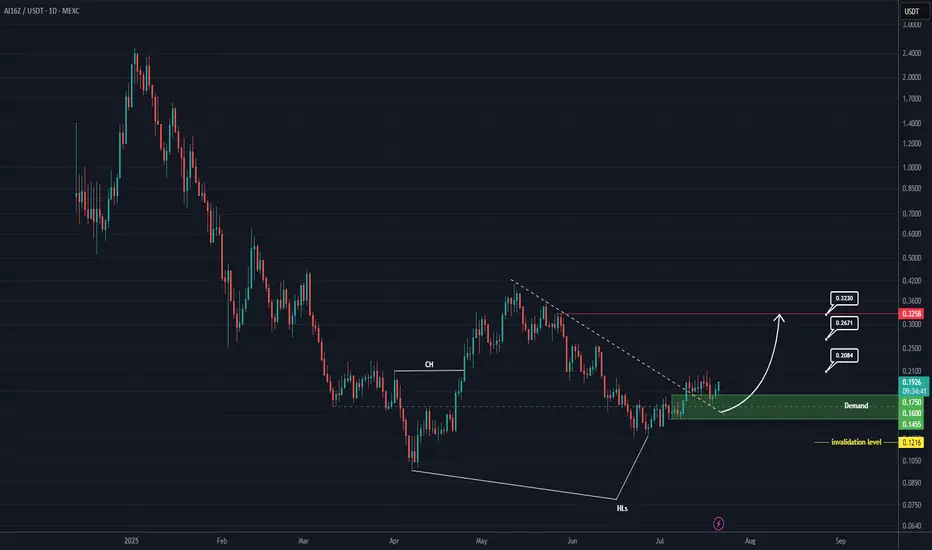
AI16Z Analysis (1D)Given the bullish CH, the breakout of the trendline, and the formation of a support zone, it appears that this token is aiming to move toward the targets marked on the chart.
Additionally, a double bottom pattern is visible at the lows, and higher lows have been recorded for this asset.
A daily candle closing below the invalidation level would invalidate this analysis.
For risk management, please don't forget stop loss and capital management
When we reach the first target, save some profit and then change the stop to entry
Comment if you have any questions
Thank You
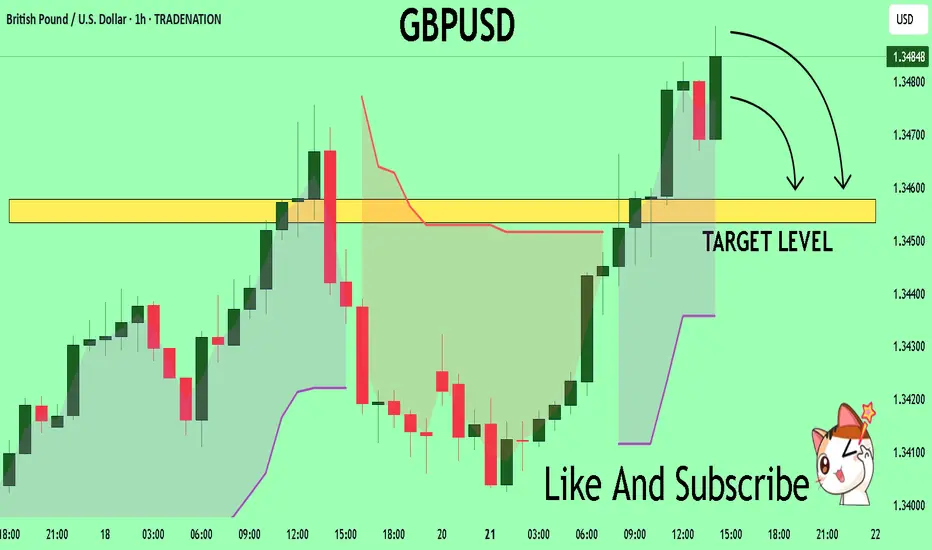
GBPUSD Under Pressure! SELL!
My dear subscribers,
GBPUSD looks like it will make a good move, and here are the details:
The market is trading on 1.3483 pivot level.
Bias - Bearish
Technical Indicators: Both Super Trend & Pivot HL indicate a highly probable Bearish continuation.
Target - 1.3457
About Used Indicators:
The average true range (ATR) plays an important role in 'Supertrend' as the indicator uses ATR to calculate its value. The ATR indicator signals the degree of price volatility.
Disclosure: I am part of Trade Nation's Influencer program and receive a monthly fee for using their TradingView charts in my analysis.
———————————
WISH YOU ALL LUCK
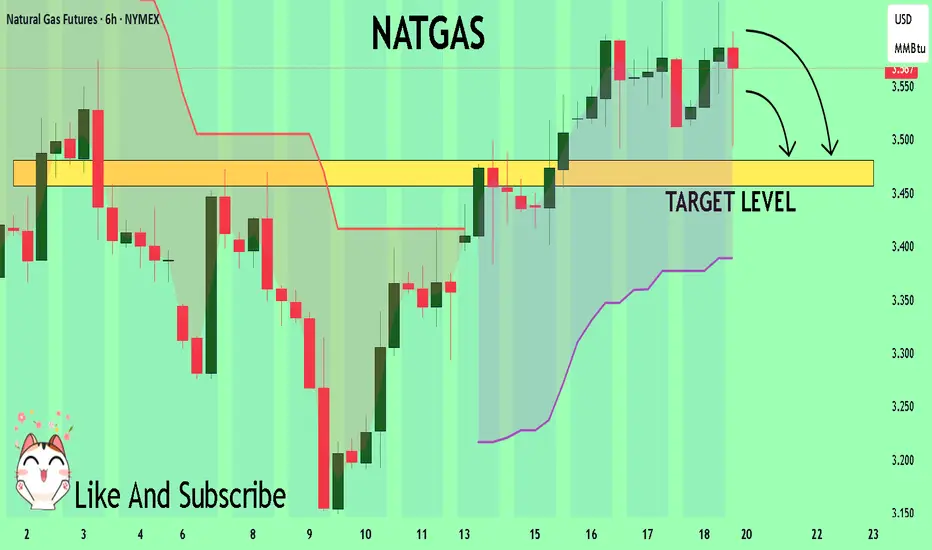
NATGAS Trading Opportunity! SELL!
My dear followers,
This is my opinion on the NATGAS next move:
The asset is approaching an important pivot point 3.567
Bias - Bearish
Technical Indicators: Supper Trend generates a clear short signal while Pivot Point HL is currently determining the overall Bearish trend of the market.
Goal - 3.480
About Used Indicators:
For more efficient signals, super-trend is used in combination with other indicators like Pivot Points.
Disclosure: I am part of Trade Nation's Influencer program and receive a monthly fee for using their TradingView charts in my analysis.
———————————
WISH YOU ALL LUCK

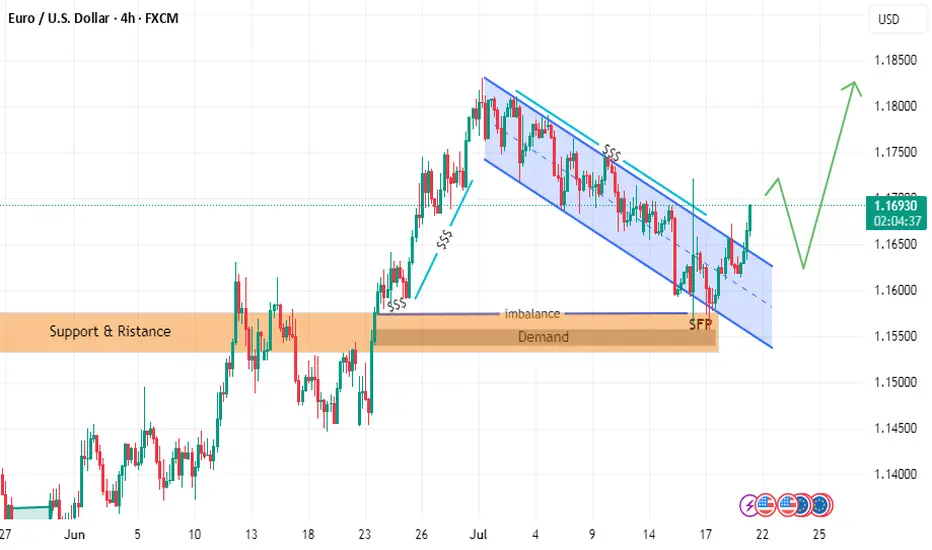
follow EURUSD LION & PLANE BUY SETUPTHE PRICE has moved as I explained in the last two posts
but we have some update to go along the way
the price could break failing channel
and withdrawal liquidity and filled imbalance
hence reflect from demand zone with zero reflection as i explained in last post with rock and plane
and it will go up to take liquidity in failing channel or downtrend
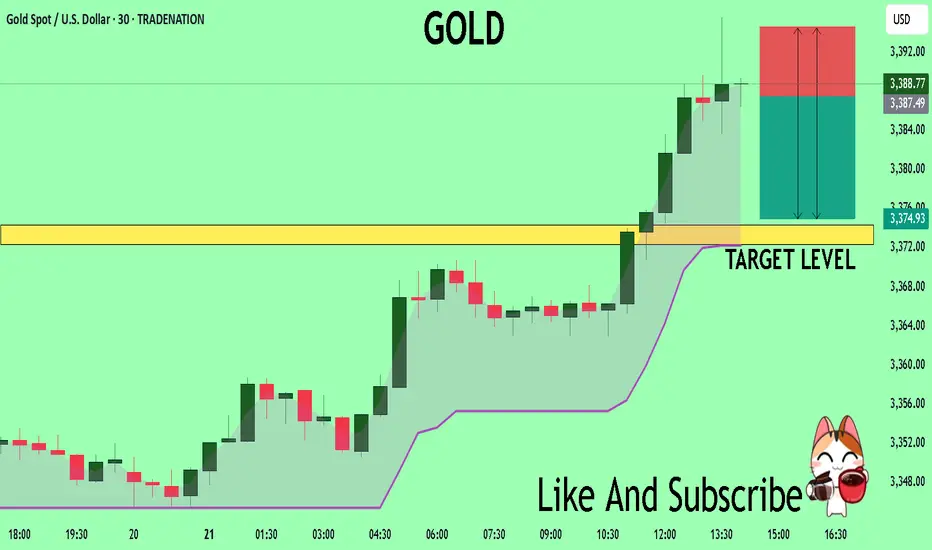
GOLD Technical Analysis! SELL!
My dear subscribers,
This is my opinion on the GOLD next move:
The instrument tests an important psychological level 3387.7
Bias - Bearish
Technical Indicators: Supper Trend gives a precise Bearish signal, while Pivot Point HL predicts price changes and potential reversals in the market.
Target - 3374.3
My Stop Loss - 3394.5
About Used Indicators:
On the subsequent day, trading above the pivot point is thought to indicate ongoing bullish sentiment, while trading below the pivot point indicates bearish sentiment.
Disclosure: I am part of Trade Nation's Influencer program and receive a monthly fee for using their TradingView charts in my analysis.
———————————
WISH YOU ALL LUCK
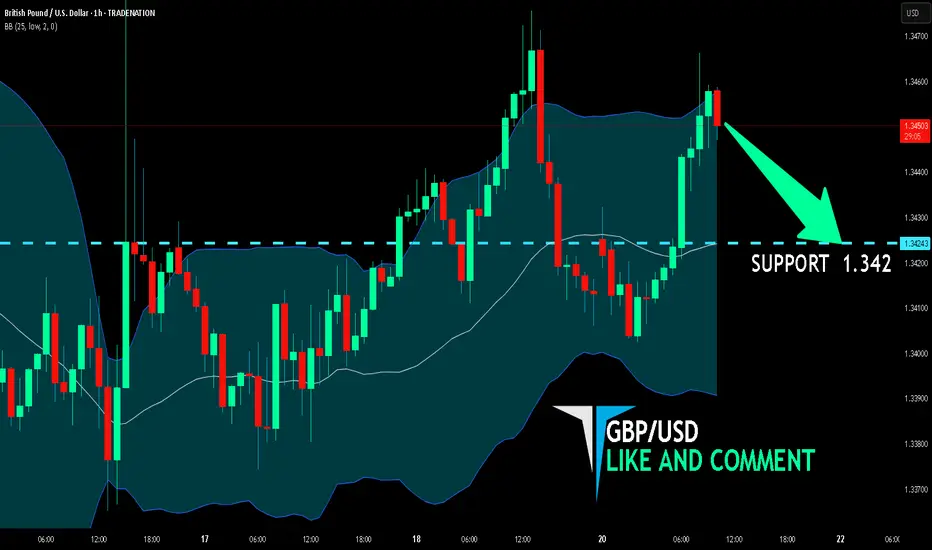
GBP/USD BEARISH BIAS RIGHT NOW| SHORT
Hello, Friends!
We are targeting the 1.342 level area with our short trade on GBP/USD which is based on the fact that the pair is overbought on the BB band scale and is also approaching a resistance line above thus going us a good entry option.
Disclosure: I am part of Trade Nation's Influencer program and receive a monthly fee for using their TradingView charts in my analysis.
✅LIKE AND COMMENT MY IDEAS✅
EURUSD Bullish ProjectionIt’s been a while since my last update here.
Here’s my projection and actual entry/entries on EURUSD, based on a sweep of the previous 1H swing low and mitigation of a Daily imbalance (Fair Value Gap).
We're anticipating a full Change of Character to mark the end of the ongoing Daily pullback.

GBPJPY - Trading The Range!Hello TradingView Family / Fellow Traders. This is Richard, also known as theSignalyst.
📈GBPJPY has been hovering within a big range.
This week, GBPJPY is retesting the upper bound of the range and $200 round number.
As long as the resistance holds, we will be looking for shorts on lower timeframes, targeting the lower bound of the range.
📚 Always follow your trading plan regarding entry, risk management, and trade management.
Good luck!
All Strategies Are Good; If Managed Properly!
~Rich
Disclosure: I am part of Trade Nation's Influencer program and receive a monthly fee for using their TradingView charts in my analysis.

Elliott Wave Analysis – XAUUSD | July 22, 2025
🔍 Momentum Overview
• D1 timeframe: Momentum has entered the overbought zone, signaling a potential reversal within the next 1–2 sessions. That said, the current bullish leg may still extend — it’s important to wait for tomorrow’s D1 candle close for confirmation. Entering overbought territory is a warning that upside momentum is weakening.
• H4 timeframe: Momentum is currently declining. Unless a strong bullish candle closes above 3391 to trigger a reversal, the price is likely to continue moving sideways or downward today.
• H1 timeframe: There are signs of a bullish reversal. If the price holds above 3385 and posts a strong breakout candle above 3391, it could present a short-term buying opportunity.
🌀 Elliott Wave Structure Update
• Price is consolidating within the 3390 – 3402 range — a key zone to monitor closely.
• The 3380 level is a critical threshold, aligned with the 0.382 Fibonacci retracement of Wave (3). A daily close below this level would raise the possibility that the move is part of a correction rather than Wave 4.
• A flat ABC correction is currently unfolding, with the 1.618 extension of Wave A already reached at 3385.
• If price breaks below 3360, it would overlap with the previous Wave 1, invalidating the current impulsive wave count. In that case, we should consider the potential continuation of a larger abcde triangle correction.
🔗 Momentum & Wave Structure Combined
• H1 is showing early signs of a bullish reversal, but H4 momentum remains bearish. Without a strong breakout candle above 3391, price is likely to drift sideways or lower until H4 reaches the oversold zone.
• Conservative approach: Wait for H4 to enter oversold territory before considering any long positions.
• The ideal buy setup would be a bullish reaction from the 3382 – 3380 zone.
📈 Trade Setup
• Buy Zone: 3382 – 3380
• Stop Loss: 3372
• Take Profit 1: 3402
• Take Profit 2: 3412
• Take Profit 3: 3428

NZDUSD Will Go Higher From Support! Long!
Please, check our technical outlook for NZDUSD.
Time Frame: 12h
Current Trend: Bullish
Sentiment: Oversold (based on 7-period RSI)
Forecast: Bullish
The market is trading around a solid horizontal structure 0.596.
The above observations make me that the market will inevitably achieve 0.602 level.
P.S
Please, note that an oversold/overbought condition can last for a long time, and therefore being oversold/overbought doesn't mean a price rally will come soon, or at all.
Disclosure: I am part of Trade Nation's Influencer program and receive a monthly fee for using their TradingView charts in my analysis.
Like and subscribe and comment my ideas if you enjoy them!

Possibility of correction As long as the price does not stabilize above the green resistance area, there is a possibility of a trend change and the start of a downtrend.

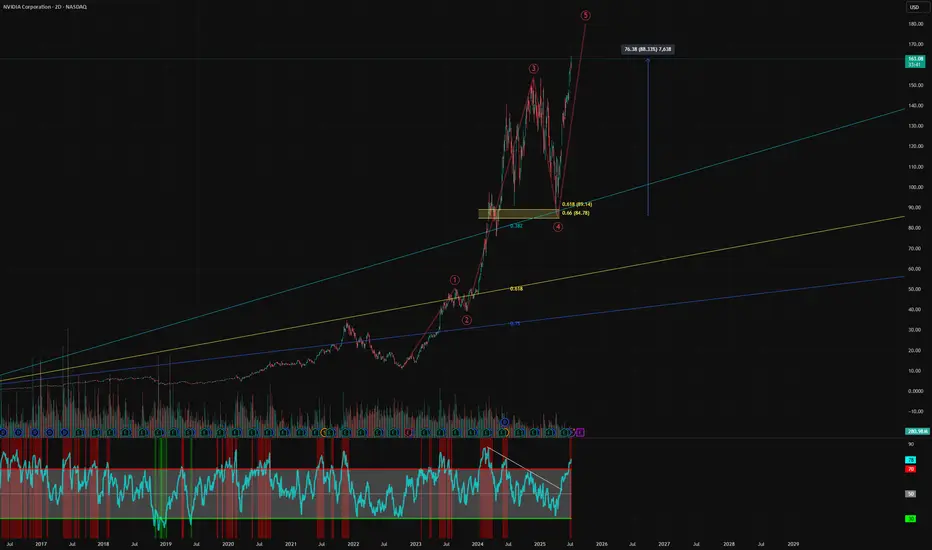
Nvidia - Blow off top?Time to book some AI stock profits, I have exited ARM and today I am taking profits on Nvidia. We entered at the golden pocket, up over 88% since the recent lows. I am now scaling out of my position, starting with 50% of my total. I will use a trailing stop loss for the rest.
We have hit a 4 trillion dollar market cap, more than the entire UK stock market combined. Am I bearish on Nvidia? Of course not, but the market is getting greedy and I like to book profits.
I love the company, but I expect huge volatility going forward.
Not financial advice, do what's best for you.
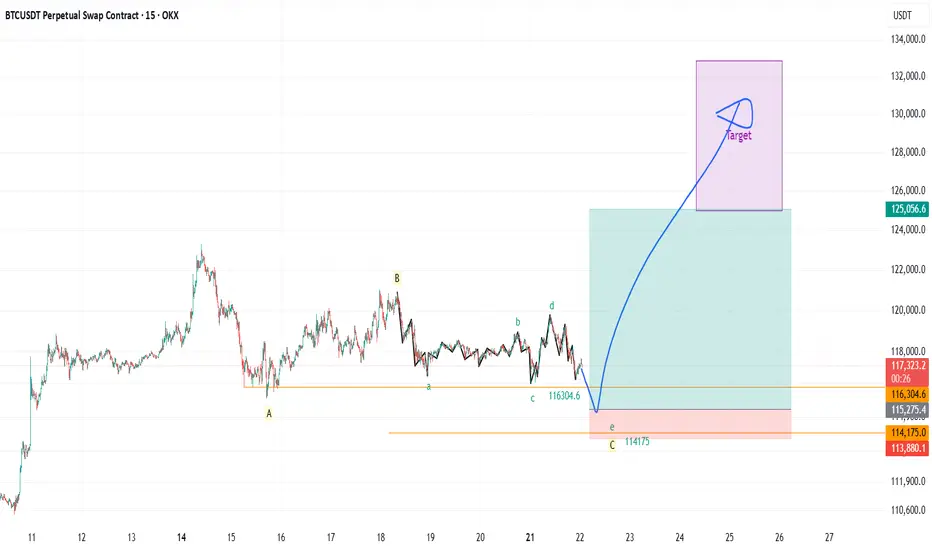
BTCUSDT It’s coming soon in 2 or 4 weeksRegardless of the positive comments coming from various media and news, the market flow is already moving as it has been set.
After 2 to 4 weeks, a strong and rapid crash comes.
Nasdaq and S&P also fall together.
GOOD LUCK!!
The stock market is highly volatile. Please be very careful with your investments.

CADJPY Will Go Down!
HI,Traders !
CAD-JPY made a bearish
Breakout of the rising support
And is now consolidating
Below the line so we are
Bearish biased and we will
Be expecting a further
Bearish continuation !
Comment and subscribe to help us grow !

LTCUSDT Short Risking 1% to make 2.22% BINANCE:LTCUSDT Short Swing Trade, with my back testing of this strategy, it hits multiple possible take profits, manage your position accordingly.
This is good trade, don't overload your risk like greedy, be disciplined trader.
I manage trade on daily basis.
Risking 1% to make 2.22% on COINBASE:LTCUSD is good trade, lets see.
Use proper risk management
Looks like good trade.
Lets monitor.
Use proper risk management.
Disclaimer: only idea, not advice

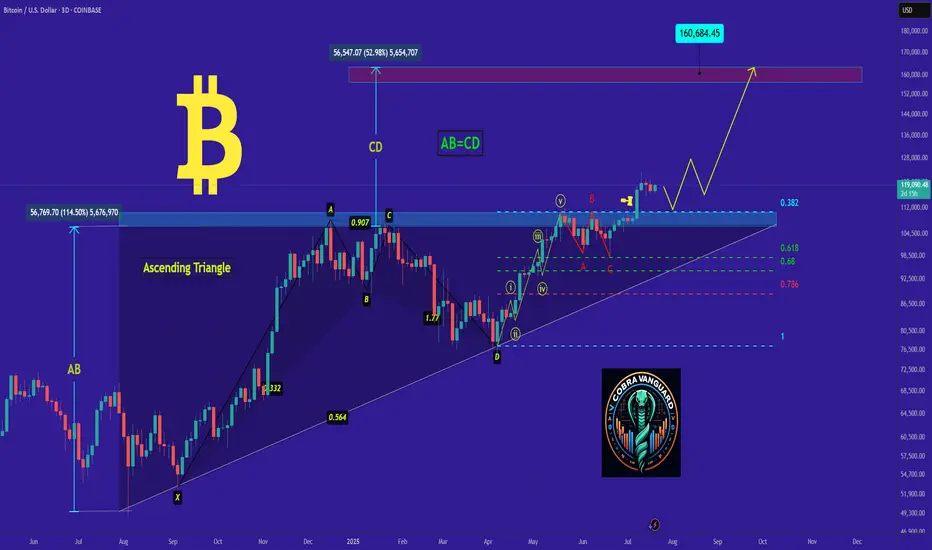
EP 01: BTC correction near completionAfter the impulse to last ATH we got a 3 wave correction, last wave being formed by 5 waves, so all together coming to completion. We should visit the liquidation area under last low and swipe that liquidity and aim closer to last ATH if not exceeding it. When the market gives us more information we will go for episode 02.