Gold (4H) — Supply is holding… for nowContext
On the left of the chart, Gold reached the higher-timeframe C target .
That was a valid place for sellers to take control — and they didn’t.
Price absorbed selling pressure and kept moving.
Now we’re at a different level.
The red zone is the all-time-high supply.
Sellers are active here. Price is being held.
That part matters and shouldn’t be ignored.
What formed under supply
Instead of a dump, price built structure:
A clear base
Liquidity sweep
MSS
A fresh ABC sequence
B held.
B broke A.
That tells me buyers are still participating, even with supply overhead.
Expectation
I’m not expecting an immediate breakout.
What makes sense here is a pullback first.
A revisit into the continuation breaker , clearing inducement and resetting positioning.
If that zone holds and price flips back up, then a break of supply opens the path toward C .
If the structure fails, I step aside.
No forcing it.
Watching how price behaves — not guessing the outcome.
SmellyTaz — decoding chaos.
Not financial advice. Shared for educational purposes only.
Waves

AAPL Long 1D Investment Conservative TradeConservative Trade
+ long impulse
+ 1/2 correction
+ SOS level
+ support level
+ volumed 2Sp+
? technical volume
Calculated affordable stop market
1 to 2 R/R take profit within 1D range
Monthly Trend
"+ long impulse
+ neutral zone 2
+ long volume distribution"
Yearly Trend
+ long impulse
+ neutral zone 2
- beyond rotation point
+ long volume distribution

NZDUSD — Correction Invalidated, Execution From the A–B BreakerPrice is trading inside a higher-timeframe BC , where the first failure already occurred.
The base breaker formed when continuation buyers expected the uptrend to resume, but MSS invalidated that assumption , trapping early continuation attempts.
At that stage, there was no sequence yet — only uncertainty.
Only after that failure did a valid ABC structure develop.
Wave A proposed direction
Wave B formed as a correction, where buyers entered expecting B to hold
Wave C began at the end of B and structurally invalidated B , proving the correction was finished
The continuation breaker is defined as the entire zone between the end of A and the end of B , where correction buyers built exposure.
For execution, I drop to lower timeframes and isolate the last breaker inside the A–B zone before Wave C flipped the scenario .
That breaker represents the final correction belief — and therefore the highest-probability entry location .
Price is expected to return to this area to:
remove correction buyers
sweep inducement
rebalance risk
That liquidity is the fuel for Wave C continuation toward its target .
If price does not return to the A–B zone, there is no trade .
If correction is not structurally invalidated, there is no participation .
I don’t trade direction —
I trade when correction proves it’s finished .
“ I participate only after correction fails — not before, not without proof. ”
Not financial advice.

AUDUSD — Counter-Trend ABC Breathing Inside a Bearish HTF WCLPrice is currently trading inside a fresh bearish higher-timeframe WCL , so any upside here is treated as corrective, not a trend flip.
Within that context, a clean bullish ABC has formed.
B held structurally, displacement followed, and the move left behind a breaker block + FVG , which defines my area of interest.
The idea is simple:
If price revisits this zone and respects it, the path of least resistance is a continuation of the correction toward the ABC C-target , before deeper HTF supply comes into play.
Invalidation is clear.
A break below B kills the sequence entirely.
This is a location-first setup —not a prediction, not a signal.
Always wait for confirmation and trade in alignment with higher-timeframe context.
Not financial advice.

GBPAUD — BC Entry Inside Weekly WCL, Invalidation Below BPrice is trading inside a Weekly WCL after a weekly bearish ABC sequence completed . At that point, momentum fades and location takes control .
Within this context, a bullish ABC formed, and price retraced into the BC / order-block zone .
Entry is mechanical, with invalidation below B , the sequence failure point.
Expectation is simple:
B holds → rotation higher toward the bullish ABC target
B breaks → idea invalidated
Note : when time allows, always wait for confirmation inside the level (sweep, displacement, CISD, etc.).
Structure over prediction.
— SmellyTaz
Disclaimer : This is not financial advice.

EURUSD — One Turnpoint, Two OutcomesThis Daily chart reduces the entire narrative to one decisive level .
We had a completed bearish ABC sequence , with price reaching its C target and establishing a fresh bearish WCL . As price entered that terminal zone, a new bullish ABC sequence began forming — a classic SK transition from momentum to location.
What matters now is not the past sequences, but the bullish WCL .
That bullish WCL is the turnpoint .
From an SK perspective, this level is binary:
If the bullish WCL is respected , price should rotate higher and retest the bullish ABC objective
If the bullish WCL fails , the bullish sequence is invalidated, and price should rotate lower to retest the bearish ABC objective
There is no prediction here and no bias without confirmation.
The market has compressed into a decision point where one level defines two paths .
Breaker structure still frames the area, but the WCL is doing the heavy lifting.
Everything else is context.
This is not about direction — it’s about who controls the turnpoint .
— SmellyTaz
Decoding chaos .
Disclaimer : This is not financial advice.

EURUSD: Wave Structure Education - Understanding Wave CountsEducational breakdown of wave structure counting using current EURUSD as a live example.
📚 WAVE STRUCTURE FUNDAMENTALS
Understanding wave counts is essential for identifying high-probability setups. Let's break down the key concepts using EURUSD's current structure.
🌊 WAVE 1 - The Foundation
Most Important Aspect: Wave 1 has two variations
Variation 1 - ABC Pattern:
Wave 1 forms as a corrective ABC structure before the main trend establishes.
Variation 2 - Straight Away:
Bearish: Higher High (HH) directly to Lower Low (LL)
Bullish: Lower Low (LL) directly to Higher High (HH)
Why This Matters:
Identifying which Wave 1 variation you're seeing helps you understand the strength and nature of the trend forming.
📈 EXTENSION WAVES - The Power Moves
Bearish Extension Pattern:
The sequence for bearish extensions:
Lower High (LH)
Higher Low (HL)
Lower High (LH)
Lower Low (LL)
Bullish Extension Pattern:
The sequence for bullish extensions:
Higher Low (HL)
Lower High (LH)
Higher Low (HL)
Higher High (HH)
Key Principle:
Extensions follow a specific pattern. Recognizing these sequences allows you to anticipate the completion point and trade accordingly.
💼 CURRENT EURUSD WAVE COUNT
Position: Bearish Wave 2 Extension (3 of 5)
What This Means:
We're in Wave 2 of the larger structure
Wave 2 is extending (showing the extension pattern)
Currently at position 3 within the 5-wave extension sequence
More downside expected to complete the extension
Trading Application:
Understanding we're in position 3 of 5 tells us:
Two more wave points to complete (4 and 5)
Wave 4 will be a pullback (selling opportunity)
Wave 5 will be the final leg down in this extension
🎓 Educational Takeaways:
1. Wave 1 Sets The Stage:
Always identify which Wave 1 variation you're seeing. ABC or Straight Away? This determines your initial bias.
2. Extensions Follow Patterns:
Both bullish and bearish extensions have specific sequences. Learn to recognize them.
3. Count = Roadmap:
When you know where you are in the wave count (like "3 of 5"), you know what's coming next.
4. Practice Required:
Wave counting takes time to master. Watch price action create these patterns repeatedly until recognition becomes second nature.
Summary:
Wave 1 has two variations: ABC or Straight Away (HH→LL / LL→HH)
Extensions follow patterns: Specific sequences for bullish/bearish
Current EURUSD: Bearish Wave 2 Extension, position 3 of 5
Next: Expect Wave 4 pullback, then Wave 5 completion
👍 Boost if you found this educational
👤 Follow for more wave structure lessons
💬 Questions? Drop them in comments

Hellena | GBP/USD (4H): LONG to resistance area of 1.34683.Colleagues, the upward movement is actively developing, and I see a medium-term upward impulse (12345) developing in the higher wave “1” (red).
At this stage, I see:
1) the possibility of a correction in wave “4” in the area of 1.32440, then reaching the resistance area of 1.34683.
2) the extension of wave “3” directly to the area of 1.34683. Such scenarios often occur in impulses.
Manage your capital correctly and competently! Only enter trades based on reliable patterns!

XAU/USD Elliott Wave Analysis: Potential Bearish Reversal OANDA:XAUUSD PEPPERSTONE:XAUUSD ICMARKETS:XAUUSD
The chart suggests that Gold Spot/U.S. Dollar (XAU/USD) has completed a major correction pattern and is now on the verge of a significant downward move.
Major Correction (A) ➡️ (B):
The price action from the major peak appears to be forming a complex correction, with the current phase completing the major (B) wave.
The sharp drop to the low around November 1st is labeled as a major (A) wave.
The subsequent rally is labeled as the major (B) wave, which is currently subdividing.
Subdivision of Wave (B): The corrective rally (B) is showing signs of completion as a smaller ABC pattern:
o Wave A (of B): A strong 5-wave impulse (labeled 1-2-3-4-5) completed in mid-November.
o Wave B (of B): A correction followed this high.
o Wave C (of B): The current rally is the final leg, Wave C (of B), aiming for the final target.
• Critical Reversal Target for (B) Wave: The chart anticipates the completion of the final Wave C (of B) at a specific price point, coinciding with a key Fibonacci level and trendline resistance:
61.80% Fibonacci Retracement at $4,313.88
This $4,313 zone is the high-probability reversal point before the major downside move begins.
📈 Technical Levels and Trendlines
Major Resistance (The Reversal Zone):
Upper Red Trendline: This descending trendline connects the initial peak with the top of the internal Wave (B), serving as strong dynamic resistance.
Key Price Target: The $4,313.88 level is the projected apex of the rally.
Understood. Here is the full analysis and titles for your post, presented in English, as requested.
📉 XAU/USD Elliott Wave Analysis: Potential Bearish Reversal from $4,313
🌊 Wave Count Interpretation (Elliott Wave)
The chart suggests that Gold Spot/U.S. Dollar (XAU/USD) has completed a major correction pattern and is now on the verge of a significant downward move.
Major Correction (A) ➡️ (B): The price action from the major peak appears to be forming a complex correction, with the current phase completing the major (B) wave.
The sharp drop to the low around November 1st is labeled as a major (A) wave.
The subsequent rally is labeled as the major (B) wave, which is currently subdividing.
Subdivision of Wave (B): The corrective rally (B) is showing signs of completion as a smaller ABC pattern:
Wave A (of B): A strong 5-wave impulse (labeled 1-2-3-4-5) completed in mid-November.
Wave B (of B): A correction followed this high.
Wave C (of B): The current rally is the final leg, Wave C (of B), aiming for the final target.
Critical Reversal Target for (B) Wave: The chart anticipates the completion of the final Wave C (of B) at a specific price point, coinciding with a key Fibonacci level and trendline resistance:
61.80% Fibonacci Retracement at $4,313.88
This $4,313 zone is the high-probability reversal point before the major downside move begins.
📈 Technical Levels and Trendlines
Major Resistance (The Reversal Zone):
Upper Red Trendline: This descending trendline connects the initial peak with the top of the internal Wave (B), serving as strong dynamic resistance.
Key Price Target: The $4,313.88 level is the projected apex of the rally.
Major Support (The Target Zone):
Lower Green Trendline: This ascending trendline connects the key lows and represents the potential final target for the upcoming decline.
Target Price Zone: The final target for the major (C) wave is indicated near the $3,826.25 level.
🎯 Trading Strategy Implication
Imminent Move: The price is completing the final internal wave towards the $4,313.88 reversal zone.
Short Entry: The ideal short-entry zone is near the $4,313.88 level, with a tight stop-loss placed just above the upper red trendline to manage risk.
Profit Target: The anticipated sharp decline, labeled as the massive (C) wave, targets the lower green trendline around $3,826.25, offering a substantial risk/reward opportunity.
Disclaimer:
This analysis is for educational purposes only and is based on Elliott Wave Theory and technical indicators. It is not financial advice. Trading foreign exchange, cryptocurrencies, and commodity futures involves significant risk of loss and is not suitable for all investors. Past performance is not indicative of future results.
Always do your own research

EURUSD Shot Position1) Short-Term Price Action (1H Chart)
EUR/USD FX:EURUSD has strongly broken out of its channel on the 1-hour timeframe and is now trading within the extended channel toward the gap zone.
2) Gap Zone & Key Levels
The gap zone aligns with the 50% level of the larger 4-hour channel.
This zone presents a high potential for price to reverse downward.
3) Reversal & Resistance Zones
The main reversal area could be the resistance zone, especially where it coincides with a strong supply zone.
Both the resistance and supply zones are key levels for potential selling opportunities.
4) Demand Zone & Short-Term Reaction
If price declines, it is likely to reach at least the demand zone, which may trigger a short-term bullish reaction.
5) Risk Disclaimer
This analysis reflects my personal view.
Always trade based on your own strategy and trading system, and strictly follow risk and money management rules.
I’d be happy if you follow me to catch all my market analyses and live stock trades in real time.

Gold - Counting the WavesThe gold chart is highly technical, and its structure can be broken down into both smaller and larger wave formations.
Since late October 2022, gold has completed a classic five-wave advance.
Looking ahead, this is not the full extent of the long-term move — gold still has room to grow.
However, before that, the market needs to correct the upward structure that has already been formed.
First, we need to correct the fifth wave. This process has already begun, and price should dip once more below the 3,900 level.
After that, the entire five-wave structure will also require a broader correction
---
Please subscribe and leave a comment.
You’ll get new information faster than anyone else.
---

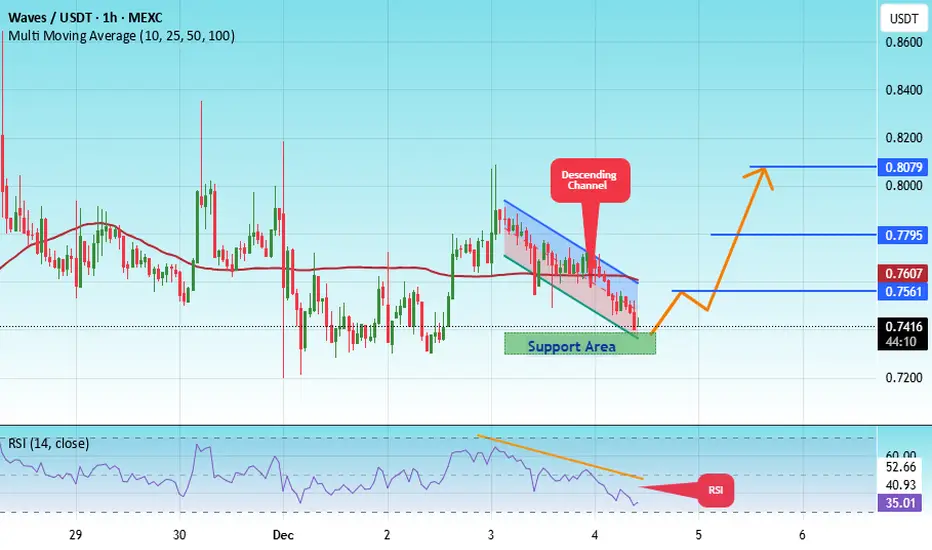
#WAVES/USDT is currently strongly bullish#WAVES
The price is moving in a descending channel on the 1-hour timeframe. It has reached the lower boundary and is heading towards breaking above it, with a retest of the upper boundary expected.
We have a downtrend on the RSI indicator, which has reached near the lower boundary, and an upward rebound is expected.
There is a key support zone in green at 0.7335. The price has bounced from this level multiple times and is expected to bounce again.
We have a trend towards consolidation above the 100-period moving average, as we are moving close to it, which supports the upward movement.
Entry price: 0.7416
First target: 0.7560
Second target: 0.7795
Third target: 0.8080
Don't forget a simple principle: money management.
Place your stop-loss order below the support zone in green.
For any questions, please leave a comment.
Thank you.
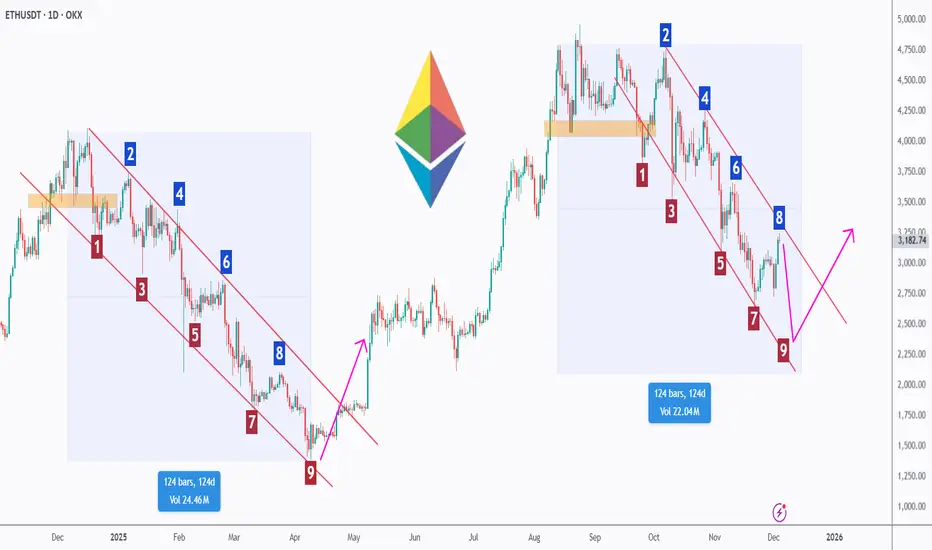
ETH - Same Pattern. Same Timeline. Same Outcome?Ethereum is showing something extremely interesting… and extremely familiar.
When we compare the previous corrective cycle to the current one, both have unfolded almost identically, not just in structure, but also in duration, each measuring around 124 days.
🌊Both cycles followed a clean 1-to-9 wave sequence inside a falling channel before ETH broke out aggressively. And right now, ETH is completing the same exact structure, approaching wave 9 once again.
🔄If history rhymes, and it often does in crypto, ETH may be preparing for a major impulsive phase, similar to what happened after the previous 124-day correction.
From the lower bound of the channel, we will be looking for trend-following longs, anticipating a potential bullish reversal that mirrors the last breakout.
Cycles don’t repeat perfectly…
But they rhyme more often than people think. 📈✨
⚠️ For now, the trend remains bearish, however, ETH would invalidate the entire bearish structure if the upper trendline breaks upward aggressively, signaling that bulls have fully taken over.
Do you believe ETH is about to repeat its previous breakout? Share your view below! 👇🔥
⚠️ Disclaimer: This is not financial advice. Always do your own research and manage risk properly.
📚 Stick to your trading plan regarding entries, risk, and management.
Good luck! 🍀
All Strategies Are Good; If Managed Properly!
~Richard Nasr
$BTCUSD - #Bitcoin cycle analysisHi guys! 👋🏻
🔔I'd like to share with you my current Bitcoin BTCUSD analysis here.
🔔 The last correction is taking an impulse 5-wave structure, it seeems like we are about to complete the 5th wave of the Intermediate A, bounce back to $102K to complete the B and drop back to the levels near $70K - 64K to complete the correction.
🔔 I know it sounds disappointing but we need a correction to regain power. Now, before throwing tomatoes, please see cycle charts below. And never underestimate the power and rules of cycles in the market.
🔔 Why channels always matter
🔔Wave paths
🔔Fibo
🔔 Path to $150K shall look like this
🔔Concetration of Supports and Resistances
Sharing for educational purposes!
✊🏻 Good luck with your trades! ✊🏻
If you like the idea hit the 👍🏻 button, follow me for more ideas.

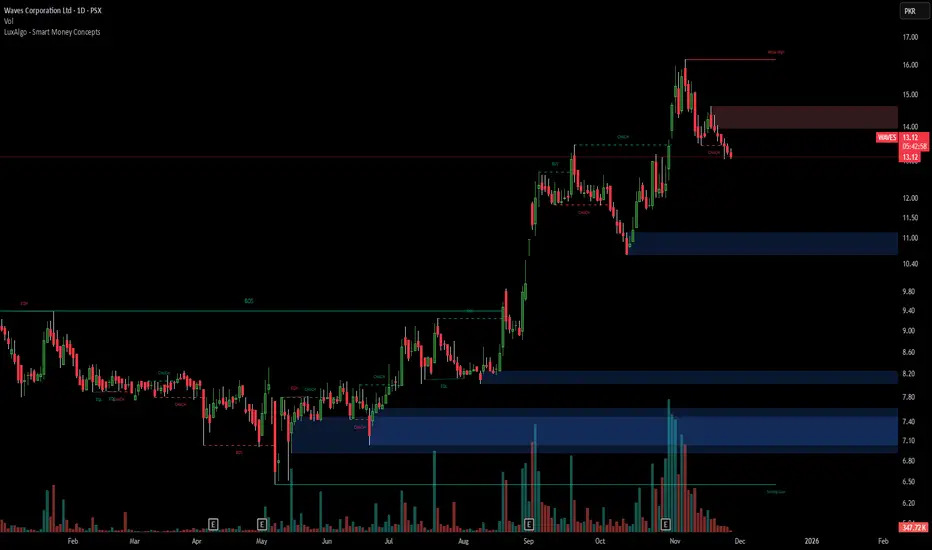
Technical Analysis - Waves Corporation (PSX)Current Price Action
Current Price: PKR 13.13 (down 0.91%)
The stock is trading near concerning technical levels after a significant decline from recent highs.
Key Technical Observations
Trend Structure
The stock experienced a strong uptrend from August through early November, rallying from around PKR 10.50 to a peak near PKR 16.00 (approximately 50% gain). However, the recent price action shows a sharp rejection from the resistance zone and a breakdown in trend.
Critical Support & Resistance Zones
Resistance Zone (Red): PKR 14.00-14.40
This area previously acted as consolidation support but has now flipped to resistance. The stock is struggling below this level, which is a bearish signal.
Current Support Zone (Blue): PKR 11.00-11.40
This represents the former breakout level from October. If this zone fails, the stock could see accelerated selling pressure.
Major Support Zone (Blue): PKR 8.00-8.20
A critical demand zone that provided strong support during the summer consolidation period.
Volume Analysis
Notice the volume spikes marked with "E" (likely earnings releases):
High volume accompanies both rallies and declines
Recent selling volume appears elevated, suggesting distribution
The latest decline shows sustained selling pressure
Technical Pattern
The chart displays a classic "parabolic rise and rejection" pattern. The sharp spike to PKR 16.00 followed by immediate reversal is concerning and often indicates exhaustion of buying momentum.
Trading Outlook
Bearish Scenario (Higher Probability):
Break below PKR 13.00 could trigger a move toward the PKR 11.00-11.40 support zone
Failure of that level opens the door to PKR 8.00-8.20
Bullish Scenario (Requires Confirmation):
A reclaim above PKR 14.00 with strong volume would invalidate the bearish structure
Would need to see consolidation and base-building rather than immediate recovery attempts
Risk/Reward Assessment
Current positioning suggests unfavorable risk/reward for long entries. The stock needs to establish a new base before attempting sustainable upside moves.
Strategy Considerations:
For traders: Wait for clear support hold at PKR 11.00-11.40 or reclaim of PKR 14.00
Momentum has shifted bearish in the short term
Any bounce attempts into the PKR 14.00 resistance zone could provide shorting opportunities
The technical picture suggests caution here, with downside risks outweighing immediate upside potential until the stock can stabilize and form a new accumulation pattern.
MGNT Short 5M Conservative CounterTrend DaytradeConservative CounterTrend trade
+ short impulse
+ resisting bar test level
+ 1/2 correction
+ weak approach
+ biggest volume 2Ut-
- manipulation signal configuration needs a test
Calculated affordable virtual stop
1 to 2 R/R take profit
1H Countertrend
"- long impulse
+ volumed TE / T1
+ weak approach
+ biggest volume 2Ut-"
1D Trend
"+ short impulse
+ BUI level
+ 1/2 correction
+ resistance level
- volumed retest"
1M
Trend
"+ short impulse
= neutral zone type 2
+ continuation of the trend"
1Y CounterTrend
"- long impulse
- T2 level
- support zone
- 1/2 correction
- biggest volume Sp?
+ model doesn't work"

KHC Short 5M Aggressive Trend DayTradeAggressive Trend Trade
- long impulse
- unvolumed T1
+ resistance zone
+ biggest volume 2Ut+
+ weak test
+ first bearish bar closed entry
Calculated affordable virtual stop loss
Bought puts
1 to 2 R/R take profit
1H Trend
"+ short impulse
+ BUI level
+ resistance zone
+ 1/2 correction
- strong approach"
1D Trend
"+ short impulse
+ BUI test / T2 level
+ resistance zone
+ volumed 2Ut+"
1M Trend
"+ short impulse
= neutral zone 2"
1Y
Trend
no context

The market seems to have completed the A wave of the ABC correctI mainly focus on Elliott Wave analysis. The chart has already completed a 5-wave impulse to the upside, and we are now in the ABC corrective phase. It looks like wave A has finished, and the market seems to be entering wave B at the moment.
I'm not sure how high wave B will extend, but I expect it to retrace to 0.382, 0.5, 0.618, or possibly 0.786 before dropping in a 1:1 measured move.

Hellena | EUR/USD (4H): LONG to the resistanse area 1.16296.Colleagues, the rather complicated correction suggests that the upward movement is gradually slowing down and I think that we will see a rather confident move towards the 1.16296 area.
The difficulty is that on higher timeframes we are dealing with a ending diagonal, and these are quite complicated figures to analyze.
Nevertheless, I think that there is a probability of reaching the support area of 1.14647 before the upward movement.
Fundamental context
The U.S. dollar is under pressure: weak economic data and expectations of monetary easing are reducing its appeal as a safe-haven asset. The euro is receiving moderate support amid relative stability in the eurozone economy and investor interest in non-dollar assets. These conditions set the stage for a resumption of the EUR/USD pair’s upward move.
Manage your capital correctly and competently! Only enter trades based on reliable patterns!

Swing-trading ReturnsYou got to look long-term or use an outside view.
-using qullamaggie's 10/20/50 (upsloping) concept
and that
-you cant run away from 200dma.
Your best returns will be on periods with perfect setups.
Where you most likely want to know the best stocks to own?
//ie during upswingy or in-pattern VIX, small caps underperform etc.
simple but not easy.
ie the edge.
market forces.

Hellena | SPX500 (4H): LONG to max of wave "3" area of 6929.4.Good afternoon colleagues, it looks like the correction is ending and soon I expect wave “5” in the upward movement. Perhaps wave “4” will update the low of 6637.8 before the upward movement.
I expect to reach the maximum of wave “3” at 6929.4. Further we will observe the price behavior in this area.
Fundamental Background
The US stock market remains positive: business activity data showed a steady expansion, which strengthens confidence in corporate earnings.
Manage your capital correctly and competently! Only enter trades based on reliable patterns!

DTM Investment 1D Conservative CounterTrend TradeConservative CounterTrend Trade
+ short impulse
- unvolumed T2 level
+ resistance level
+ 1/2 correction
+ weak approach?
+ biggest volume 2Ut-
- interaction bar bigger volume
Calculated affordable virtual stop loss
1 to 2 R/R take profit
Bough put
Monthly CounterTrend
"- long impulse
- unvolumed T1
+ resistance level
+ biggest volume 2Ut-
+ more volume on reaction bar"
Yearly CounterTrend
"- long impulse
- neutral zone 2
- continuation if the trend
+ exhaustion volume?"

IREN 5M Short Conservative Trend DayTradeConservative Trend Trade
+ short impulse
+ unvolumed T2
+ resistance zone
- before 1/2 correction
+ strong approach
+ volumed 2Ut+
+ weak test
+ first bullish bar close entry
Calculated affordable virtual stop loss
1 to 2 R/R take profit within 5M range
Bought put
1D Trend
"- short balance
+ volumed T2
+ resistance zone
+ 1/2 correction
- strong approach
+ biggest volume 2Ut-"
1M CounterTrend
"- long impulse
+ volumed T1
+ resistance zone
+ weak approach
+ biggest volume Ut
+ test"
1Y CounterTrend
"- long impulse
= neutral zone
+ exhaustion volume?"
