$LTC: The Best Positioned AltcoinTo all those who doubted XRP's breakout in November 2024, history is repeating and LTC will be the beneficiary.
Wedge

Selena | XAUUSD 30m –Fresh Demand Inside Channel Monday OutlookPEPPERSTONE:XAUUSD
The left-hand range zone provided accumulation before price broke out and built this bullish structure. Each major dip into the rising trendline has produced strong upside continuations. The latest move created a new swing high and then a controlled, corrective decline inside a descending channel. That correction is now testing the fresh demand area, suggesting a potential reaction higher while the broader channel structure remains intact.
Key Scenarios
✅ Bullish Case 🚀
Bulls defend the 4188–4198 demand zone and hold above 4175.
Price reclaims short-term structure and pushes back towards:
🎯 Target 1: 4237–4240 (previous high / mid-range resistance)
🎯 Target 2: 4264–4265 (recent spike high / buy-side liquidity)
🎯 Target 3: 4285–4295 (channel high and final target zone)
❌ Bearish Case 📉
A clean 30m close below 4175 would show demand failing.
In that case, downside continuation could open the way towards:
🎯 Downside Target 1: 4145–4155
🎯 Downside Target 2: 4105–4110 (deeper liquidity and major support zone)
Current Levels to Watch
Fresh Demand / Support: 4188–4198
Intermediate Resistance: 4237–4240
Invalidation for bullish idea: sustained break and hold below 4175
⚠️ Disclaimer: This analysis is for educational and informational purposes only. It is not financial advice. Please do your own research and manage risk before trading.

DOGEUSDT → Lack of bullish potential BINANCE:DOGEUSDT.P failed to break the trend. Under pressure from resistance and a global downtrend, the coin is reversing and may decline...
Bitcoin is pausing after a news rally based on rumors. The trend remains bearish. Pressure on the crypto market is present...
DOGE faced pressure in the 0.1477 - 0.155 zone. A rebound from 0.1533 is forming and the price is closing below 0.1477, forming a pre-breakout base of 0.1464. The reaction to support is weakening, confirming the weakness of the buyer. A close below 0.1464 could trigger a further decline within the range.
Resistance levels: 0.1477, 0.15337
Support levels: 0.1464, 0.1366
A breakdown of support, closing below the level, and consolidation in the short zone will once again confirm buyer weakness, which in turn may trigger a further decline.
Best regards, R. Linda!

Hammer Candle Sparks Bullish HopesCoiling within a falling wedge and having printed a hammer candle on the daily timeframe last Friday, a resumption of the broader bullish trend in CHF/JPY may soon be on the cards. However, with RSI (14) and MACD turning neutral on directional bias, confirmation of the bullish signal would be preferred before considering long setups.
192.70 is a level worth keeping an eye on during Monday’s session, coinciding with the high set on 30 October where the price bounced strongly following a failed downside break on Friday. Should we see a retest of the level followed by another bounce, it would strengthen conviction about establishing long positions, creating a setup where entry could be made above the level with a stop beneath it or Friday’s low to protect against an extension of the latest pullback.
The first topside level of note for bulls would be the November downtrend, currently around 194.00. If the pair were to break and hold above this level, it would signal a potential return to the November high of 195.73, putting both it and horizontal resistance at 194.57 on the radar as other bullish targets.
Of course, should CHF/JPY resume its push lower, it would open the door for bearish setups, especially if we see a close beneath 192.70. If that were to eventuate, shorts could be established on the break with a stop above for protection, targeting the influential 50DMA where the price has bounced on six separate occasions since August when breached. A sustained move beyond that level would put 190.54 resistance and uptrend support dating back to February on the radar for bears.
Good luck!
DS

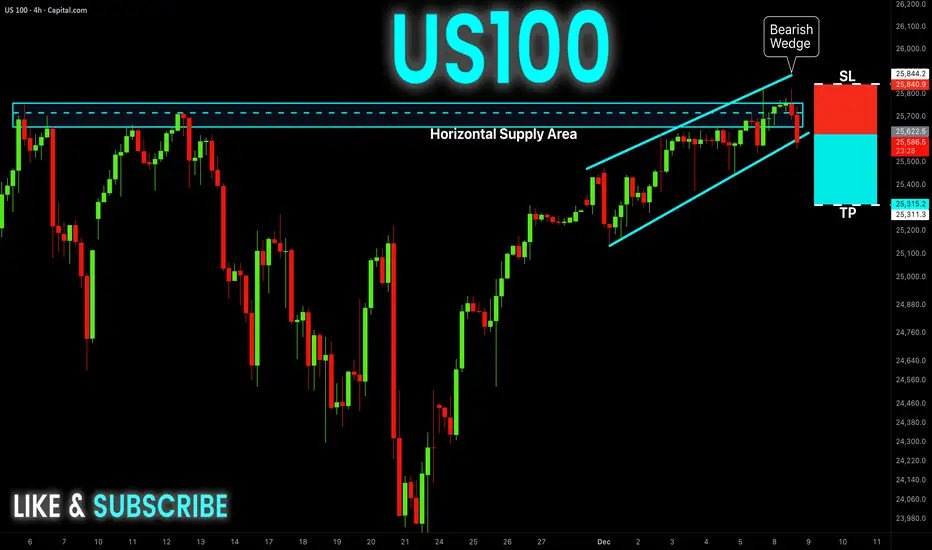
US100 Free Signal! Sell!
Hello,Traders!
US100 has rejected a major supply zone while breaking down from a bearish wedge, sweeping buy-side liquidity before shifting order-flow bearish. This SMC structure signals distribution at premium and a move toward discount levels below.
--------------------
Stop Loss: 25840
Take Profit: 25315
Entry: 25622
Time Frame: 4H
--------------------
Sell!
Comment and subscribe to help us grow!
Check out other forecasts below too!
Disclosure: I am part of Trade Nation's Influencer program and receive a monthly fee for using their TradingView charts in my analysis.
Selena | XAU/USD – Bullish Structure With Fresh Demand SupportPEPPERSTONE:XAUUSD
Price continues to hold within a rising channel, respecting previous demand points.
Current market sits near 4,207–4,200 fresh demand, which previously produced aggressive upside.
If price retests demand and holds, bullish continuation remains the dominant scenario.
🔹 Bullish Scenario – Primary Setup
• Price pulls back into 4,207–4,200 demand zone
• Confirms support → higher-low formation
• Break of 4,235–4,240 opens clean upside channel
🎯 Upside Target 1 → 4,264–4,265 (liquidity grab point)
🎯 Upside Target 2 → 4,285–4,300 (full continuation objective)
🔸 Bearish Invalidation
• Breakdown & close below 4,200 demand = sentiment weakens
• Next support sits lower inside channel
⚠️ This chart is a technical outlook only – not financial advice.

EURUSD Uptrend Structure Intact — Path Toward 1.1700 ResistanceHello traders! I want to share my view on the current EURUSD setup. After a corrective decline, the pair formed a solid local bottom around the Support Level near 1.16200–1.16400, where buyers stepped in and stopped the downward momentum. As shown on the chart, price is now trading inside a clear ascending structure, supported by the rising Support Line and guided by a parallel Resistance Line, forming a well-defined upward channel. Inside this structure, the Buyer Zone has played a key role, serving as the base for multiple impulsive breakouts in the past. Several breakdown attempts turned into fake breakouts, confirming that buyers continue to defend this area and maintain short-term trend control. After these rebounds, EURUSD pushed into the upper part of the channel, reaching the Resistance Line and forming a local rejection that caused a pullback back toward the Buyer Zone. Currently, price is hovering near the ascending support line, and as long as EURUSD stays above the 1.16400 support area, the bullish scenario remains intact. If buyers successfully defend this zone and maintain structure inside the rising channel, I expect the market to move toward TP1 → 1.17000, which aligns with the major Resistance Level highlighted on the chart. A clean breakout above this level would open the way for further continuation, potentially driving the pair deeper into the higher resistance zone. However, if the price breaks below the Buyer Zone and violates the ascending Support Line, the bullish scenario becomes invalid, and the pair may revisit lower support levels around the 1.16000 area. For now, the structure remains moderately bullish as long as demand holds and EURUSD continues respecting the rising channel. Please share this idea with your friends and click Boost 🚀

Elite | XAU/USD – 30m | Bullish Compression Targetting ATH 4300$OANDA:XAUUSD
Price continues to defend major support (4,150–4,175) with repeated upside structure shifts (BOS). Descending trendlines are compressing price, signaling breakout readiness. As long as price remains above the demand zone, bullish continuation remains favored.
If price re-tests demand & holds → breakout scenario becomes high probability.
A confirmed break above 4,228 unlocks liquidity toward 4,256 and the extended upper target.
Key Scenarios
🔼 Bullish Breakout Plan
Hold above 4,194 support → bullish bias active
Break & retest 4,228 = entry trigger
🎯 Targets → 4,256 → 4,265+
🔽 Failure Case
Bearish only if price closes below 4,150 zone
Below this → structure collapses + deeper correction likely
⚠ Disclaimer: Market analysis only — not financial advice.

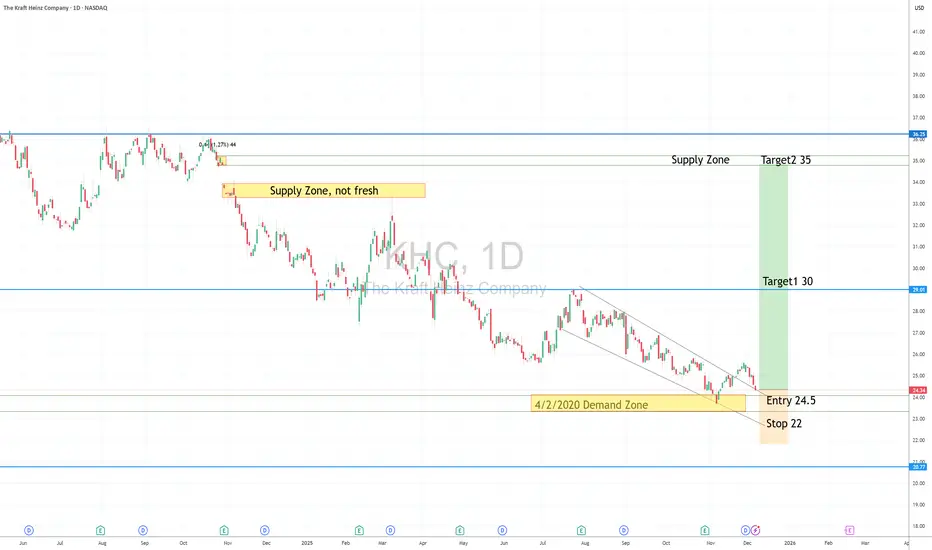
KHC Long 4/2/2020 Demand Zone is conformed
downtrend wedge trendline break + retest
Long entry 24.5
Stop 22
Target 30 , 35
Risk management is much more important than a good entry point.
I am not a PRO trader.
In my trading plan, the Max Risk of each short term trade should be less than 1% of an account.
MP shortDowntrend + Wedge (continuation pattern ), near resistance
Looks like Wave 12345 + Wave ABC
Stop 67,
Short entry 63
Target 45
Risk management is much more important than a good entry point.
I am not a PRO trader.
In my trading plan, the Max Risk of each short term trade should be less than 1% of an account.

CRUDE OIL OPENING WEDGE|LONG|
✅WTI OIL has broken out of the expanding wedge, signaling bullish displacement as we move away from prior sell-side liquidity. A corrective retest of the breakout zone could fuel continuation toward premium draw-on liquidity. Time Frame 12H
LONG🚀
✅Like and subscribe to never miss a new idea!✅

Elite | EUR/USD – Structural Breakout + Demand RetestFX:EURUSD
Price has successfully transitioned from a multi-week range into bullish structure, confirmed by liquidity sweeps at the lows and a decisive break in the descending channel. The current retracement is retesting fresh demand — this zone will decide continuation power.
Structure Notes
• Strong downside liquidity sweep formed a base at 1.1500 zone
• Break of structure confirms bullish control
• Price now retesting 1.1580–1.1610 demand
• Holding this zone keeps upside continuation valid
Expectations
If bulls defend demand and structure holds, continuation targets become active:
🎯 Target 1: 1.1712
🎯 Target 2 (Main Liquidity Objective): 1.1878
Invalidation:
Break below 1.1580 weakens trend continuation and delays bullish projection.
⚠️ This analysis is for educational purposes and market observation only — not financial advice.

Selena | XAUUSD 30M – Trend Support + Liquidity Hunt ScenarioFOREXCOM:XAUUSD OANDA:XAUUSD PEPPERSTONE:XAUUSD
4H candle chart thought
Structure remains bullish as long as the trendline + holding zones hold. Smart-money liquidity sits above previous highs — a break may initiate continuation to extended targets.
📈 Bullish Scenario (Primary Bias)
If price holds above 4,200 and reclaims the entry block:
🎯 TP1 – 4,240–4,245
🎯 TP2 – 4,258–4,260 (Buy-Side Liquidity)
🎯 Final Target – 4,270+
📉 Bearish Invalidations
Break & close below: 4,176
Stronger confirmed reversal below: 4,125
Current Levels To Watch
Resistance 🔴: 4,245 / 4,260 / 4,275
Support 🟢: 4,200 / 4,176 / 4,120
⚠️ Disclaimer: For educational purposes only — not financial advice.

BTCUSD: Bullish Pressure Targets the $94,000 Resistance AreaHello everyone, here is my breakdown of the current BTCUSD setup.
Market Analysis
Bitcoin remains in a broader recovery phase after breaking out of the descending wedge structure that previously guided price lower. The initial breakout from the wedge led to a strong bearish continuation, but once BTC reached the major $90,200 Support Zone, selling pressure weakened and buyers stepped in aggressively. This support area has now been defended multiple times, confirming it as a key demand zone. From this base, price formed a clear Upward Channel, signaling a short-term bullish structure with higher lows respected along the channel support.
Currently, BTC attempted to break above the $93,700 Resistance Zone, but this move resulted in a fake breakout, showing that sellers are still active at this level. After the rejection, price pulled back toward the channel support and the $92,000–$90,200 support cluster, where buyers once again defended the market. Currently, BTC is trading back inside the ascending channel and attempting to resume the upward swing toward the upper boundary. The overall structure suggests a recovery trend as long as the price holds above the main support zone.
My Scenario & Strategy
My scenario is bullish, as long as BTC holds above the $90,200 Support Zone and continues to respect the ascending channel structure. I expect price to continue climbing toward the $93,700 Resistance Zone, which remains the key short-term target for buyers. A clean and confirmed breakout above this resistance would open the way for a continuation toward higher levels near the top of the channel.
Therefore, if price reaches the resistance again and produces another strong rejection, we may see a temporary pullback back toward the mid-channel area or even a retest of support. The bullish structure remains valid as long as BTC stays above $90,200. For now, the market supports a long bias with focus on a renewed attempt toward the $93,700 resistance zone.
That's the setup I'm tracking. Thank you for your attention, and always manage your risk.

#NZDCAD: Classic Trend Following PatternThe NZDCAD pair recently violated a significant intraday horizontal resistance level, and closed above it.
Upon retesting this previously broken structure, the price then broke above the resistance line of a falling wedge pattern on an hourly timeframe.
This suggests a strong potential for bullish movement and a likely upward trend.
I anticipate a growth reaching at least the 0.8067 level.

Selena | USDJPY 2H – Demand Retest + Structural Long SetupFX:USDJPY
If price reacts bullishly from the marked OB zone, upside liquidity lies toward 156.30 → 157.20 → 158.00, which aligns with prior rejection highs. A deeper sweep toward 153.40–152.70 remains secondary buy interest if first zone fails.
📈 Bullish Case 🚀 (Primary Idea)
Hold above demand zone 154.40–154.80 → breakout expected.
🎯 Target 1 → 156.30
🎯 Target 2 → 157.20
🎯 Final Target → 158.00 (liquidity + premium zone)
📉 Bearish Case (Invalidation)
Close below 153.40 shifts structure downward
Strong reversal below 152.70 only.
Current Levels to Watch
Resistance 🔴: 155.50 / 156.30 / 158.00
Support 🟢: 154.40 / 153.40 / 152.70
⚠️ Disclaimer: Educational analysis only — not financial advice.

Gold is about to break to the upside.Gold was sideways for a while. So we could not find any trade. But it is about to break now.
Get ready...

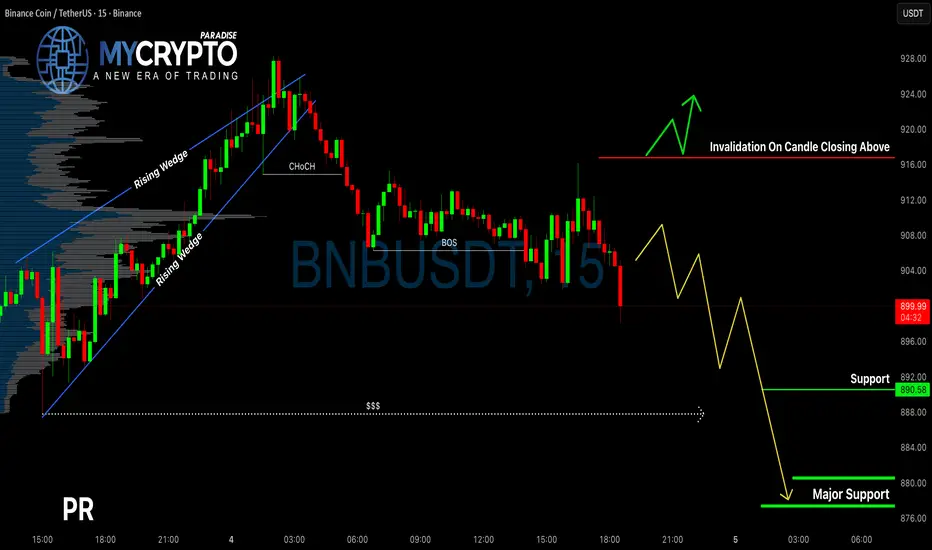
BNB Just Triggered a Breakdown, Are You Ready for the Next Move?Yello, Paradisers! Have you noticed how BNB quietly broke down from its rising wedge while most traders are still waiting for direction? This could be the early signal of a much deeper move—if you're not prepared, you might miss the whole thing.
💎BNBUSDT has officially broken down from a rising wedge formation—a pattern that typically signals a bearish reversal. What makes this even more significant is the clear bearish Change of Character (CHoCH) on the chart, which adds further confirmation that the trend may be shifting downward.
💎We’ve already seen a bearish Break of Structure (BoS), suggesting that downside momentum is building. However, instead of jumping in now, the higher-probability setup would be to wait for a pullback. Ideally, we want to see the price return to a more premium level, where we can then look for confirmation through a bearish candlestick pattern. That would give us a much better risk-to-reward entry point. Once confirmed, we’ll be targeting the next zones of liquidity and support lower on the chart.
💎That said, we always need to plan for the invalidation scenario. If price breaks above our invalidation level and closes a full candle above it, the current bearish thesis would no longer be valid. In that case, it’s best to step aside and wait for more reliable price action before taking any positions. Patience will protect your capital more than any indicator.
🎖Strive for consistency, not quick profits. Treat the market as a businessman, not as a gambler. The next few moves will separate those who follow their plan from those who trade emotionally. Stay sharp, Paradisers.
MyCryptoParadise
iFeel the success🌴
EPCL has formed a falling wedge with Bullish Divergence EPCL has formed a falling wedge with Bullish Divergence
Daily Candle closed above the trend line, signalling instant buy
with a good reward to risk ration 2:1


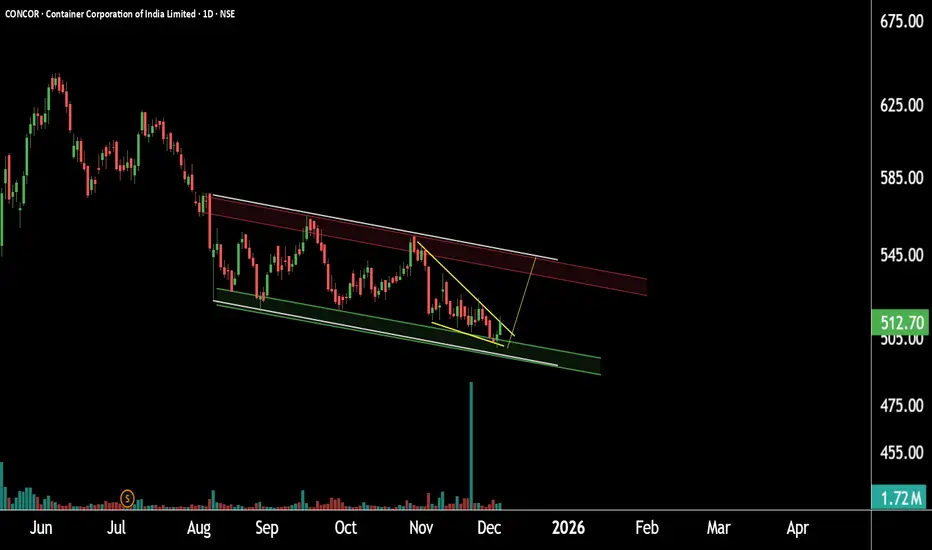
Concor Ready for Support Reversal ?This is the daily timeframe chart of Concor.
The stock is trading within a falling channel pattern, with a strong support zone around 490–510.
On the shorter timeframe, the structure is forming a falling wedge near the 500–510 area. If this support zone holds,
the stock may witness a potential upside toward 540.
Thank you.
Selena | XAUUSD – 4H | Bullish Continuation Setup 4400$ WaitingFOREXCOM:XAUUSD
Gold continues to build bullish structure after forming accumulation in the previous range zone. The market broke out, retested demand, and maintained higher-lows inside the ascending channel. Current pullback into the Entry Zone (4122–4140) aligns with channel support + demand, suggesting potential continuation toward the upper boundary and major resistance around 4380–4410.
Key Scenarios
✅ Bullish Case 🚀
Hold above demand zone + channel support:
🎯 Target 1: 4320
🎯 Target 2: 4380
🎯 Target 3: 4410 (final top channel line)
Trigger: bullish rejection or bullish engulfing from 4122–4140.
❌ Bearish Case 📉 (Invalidation)
Break and 4H close below 4052 (Invalid zone):
🎯 Downside Target: 3990 → 3920 strong support
Current Levels to Watch
Resistance 🔴: 4320 / 4380 / 4410
Support 🟢: 4140 / 4122 (Entry Zone)
Invalidation: 4052
⚠️ Disclaimer: This analysis is for educational purposes only. Not financial advice.

BTC 15m Analysis — Falling Wedge Pattern📊 BTC 15m Analysis — Falling Wedge Pattern
Bitcoin is trading around $92,870 – $92,920 and forming a falling wedge, which is typically a bullish reversal pattern.
1️⃣ Support Zone
Support sits near $92,750 – $92,800.
Price has bounced from this area multiple times, showing buyers are active here.
2️⃣ Falling Wedge Structure
Lower highs and higher lows are squeezing price inside the wedge.
This usually indicates weakening selling pressure and potential breakout to the upside.
3️⃣ Breakout Conditions
A strong bullish move can form if BTC breaks above the wedge resistance, around:
👉 $93,000 – $93,100
A breakout and hold above this zone may trigger a push toward higher levels.
4️⃣ Bearish Risk
If price breaks below support at $92,750, the pattern invalidates and BTC may drop further.
Summary
Pattern: Falling wedge (bullish setup)
Support: $92,750
Resistance: $93,000 – $93,100
Watching for breakout above resistance or breakdown below support.
