ADA road map !!!The ADA will increase 40 cents and reach to the top of the wedge in the coming weeks.
Give me some energy !!
✨We spend hours finding potential opportunities and writing useful ideas, we would be happy if you support us.
Best regards CobraVanguard.💚
_ _ _ _ __ _ _ _ _ _ _ _ _ _ _ _ _ _ _ _ _ _ _ _ _ _ _ _ _ _ _ _
✅Thank you, and for more ideas, hit ❤️Like❤️ and 🌟Follow🌟!
⚠️Things can change...
The markets are always changing and even with all these signals, the market changes tend to be strong and fast!!
Wedge

EURUSD Tests 17-Year Long-Term Trend!!!After Trump announced an additional 20% in tariffs, EURUSD made a relatively surprising move and surged sharply. This marks the second leg of the upward trend that began in early March. However, the sharp rise has now brought EURUSD to the doorstep of a very long-term resistance level.
Since testing 1.60 in 2008, EURUSD has been moving lower within a wide descending trend channel that has held for 17 years. Since 2015, the pattern has evolved into a wedge formation within this broader channel. The most recent test of this resistance came last year, but at the time, a weak Eurozone economy, crowded Euro long positions, and a hawkish Fed prevented a breakout.
This time, the landscape is different. The Eurozone is showing early signs of recovery, the ECB’s rate cuts appear to be nearing their end, and European countries have started to band together following a decline in confidence in their biggest ally and decide to increase technology, defence spending.
Despite these developments, the medium-term effects of the new tariffs and the strength of the long-term resistance level are likely to prevent a clear breakout for now. Still, the long-term outlook is beginning to shift in favor of the euro, and a breakout later this year carries a significant probability.

CHFJPY: Intraday Bullish Signal?! 🇨🇭🇯🇵
It looks like CHFJPY has completed a local correctional movement
after a formation of a strong bullish wave.
I see a violation of a resistance line of a falling wedge pattern as a confirmation.
Next goal - 175.72
❤️Please, support my work with like, thank you!❤️

Gold daily analysis On daily chart gold is showing a strong bullish movement but this is an alarming situation and from any time gold will give a biggest correction in the history , and can come upto 2100 doller, my last sell price is 3295 keeping SL of 3320 for q target of 2100.

DOGE → Will the market hold strength or lose it all?BINANCE:DOGEUSDT is testing the liquidity and resistance zone amid a downtrend as part of a news-induced rally. Will the market hold this trend or return to a sell-off?
The downtrend continues. As part of the correction triggered by the news backdrop, bitcoin strengthened and pulled the altcoins with it. But the market may lose all its growth quite quickly, as bearish pressure on the market is still very strong (There are no fundamental positive changes for the market). The fall of BTC may be followed by DOGE as well.
Technically, the price is forming a false break of the resistance zone 0.1622 - 0.15700, consolidation of the price below this zone will provoke the continuation of the fall to the nearest zone of interest 0.13646.
Resistance levels: 0.157, -0.1622
Support levels: 0.13646, 0.1277, 0.1154
A retest of the trend resistance is possible, but price consolidation below the key zone will be a good signal indicating the seller's strength, the decline may continue. On the weekly timeframe we have a trigger at 0.14217, break of which will open the way to 0.1277 - 0.1025.
Regards R. Linda!

RSR/USDT: FALLING WEDGE BREAKOUT! 100%+ PROFIT POTENTIAL!!🚀 Hey Traders! RSR Breakout Alert – 100%+ Rally Incoming? 👀🔥
If you’re hyped for big moves and real alpha, smash that 👍 and hit Follow for high-accuracy trade setups that actually deliver! 💹🚀
RSR has just broken out of a falling wedge structure on the daily timeframe—a powerful bullish pattern. The chart’s signaling a potential 100–150% upside move if momentum picks up from here. 📈
📍 Entry Zone: CMP – Add more on dips down to $0.0066
🎯 Target: 100%–150% upside
🛑 Stop-Loss: $0.0054
📊 Trade Plan:
✅ Buy from current levels
✅ Add on dips near breakout support
✅ Ride the breakout wave with tight risk control!
💬 What’s Your Take?
Are you riding this RSR breakout or waiting on confirmation? Drop your thoughts and targets in the comments—let’s ride this wave together! 💰🔥

ONDO Falling Wedge + Bullish DivergenceBITGET:ONDOUSDT is compressing inside a falling wedge, now trading near key support. Signs of potential reversal are building.
🔹 Key Observations
• Pattern: Falling wedge (bullish bias)
• Support: Price is holding just above the ~$0.68–$0.75 demand zone
• Volume: Declining throughout the wedge – typical pre-breakout behavior
• RSI: Bullish divergence forming + compression under 50, often seen before breakouts
🔸 What to Watch
• Breakout trigger: Daily close above wedge resistance (orange trendline), ideally with volume
• Target zones: $1.30 to $1.60, then $1.90 to $2.10 (prior S/R levels)
• Invalidation: Breakdown below the green demand zone ($0.68)
⚠️ As always, confirmation matters – no breakout yet. But the setup is clean and worth watching closely.

Falling Wedge Trading Pattern: Unique Features and Trading RulesFalling Wedge Trading Pattern: Unique Features and Trading Rules
Various chart patterns give an indication of possible market direction. A falling wedge is one such formation that indicates a possible bullish reversal. This FXOpen article will help you understand whether the falling wedge pattern is bullish or bearish, what its formation signifies about the market direction, and how it can be used to spot trading opportunities.
What Is a Falling Wedge Pattern?
Also known as the descending wedge, the falling wedge technical analysis chart pattern is a bullish formation that typically occurs in the downtrend and signals a trend reversal. It forms when an asset's price drops, but the range of price movements starts to get narrower. As the formation contracts towards the end, the buyers completely absorb the selling pressure and consolidate their energy before beginning to push the market higher. A falling wedge pattern means the end of a market correction and an upside reversal.
How Can You Spot a Falling Wedge on a Price Chart?
This pattern is usually spotted in a downtrend, which would indicate a possible bullish reversal. However, it may appear in an uptrend and signal a trend continuation after a market correction. Either way, the falling wedge provides bullish signals. The descending formation generally has the following features.
- Price Action. The price trades lower, forming lower highs and lower lows.
- Trendlines. Traders draw two trendlines. One connects the lower highs, and the other connects the lower lows. Finally, they intersect towards a convergence point. Each line should connect at least two points. However, the greater the number, the higher the chance of the market reversal.
- Contraction. The contraction in the price range signals decreasing volatility in the market. As the formation matures, new lows contract as the selling pressure decreases. Thus, the lower trendline acts as support, and the price consolidating within the narrowing range creates a coiled spring effect, finally leading to a sharp move on the upside. The price breaks through the upper trendline resistance, indicating that sellers are losing control and buyers are gaining momentum, resulting in an upward move.
- Volume. The trading volume ideally decreases as the pattern forms, and the buying volume increases with the breakout above the upper trendline, reflecting a shift in momentum towards the buyers.
Falling and Rising Wedge: Differences
There are two types of wedge formation – rising (ascending) and falling (descending).
An ascending wedge occurs when the highs and lows rise, while a descending wedge pattern has lower highs and lows. In an ascending formation, the slope of the lows is steeper and converges with the upper trendline at some point, while in a descending formation, the slope of the highs is steeper and converges with the support trendline at some point.
Usually, a rising wedge indicates that sellers are taking control, resulting in a downside breakdown. Conversely, a descending wedge pattern indicates that buyers are gaining momentum after consolidation, generally resulting in an upside breakout.
The Falling Wedge: Trading Rules
Trading the falling wedge involves waiting for the price to break above the upper line, typically considered a bullish reversal. The pattern’s conformity increases when it is combined with other technical indicators.
- Entry
According to theory, the ideal entry point is after the price has broken above the wedge’s upper boundary, indicating a potential upside reversal. Furthermore, this descending wedge breakout should be accompanied by an increase in trading volume to confirm the validity of the signal.
The price may retest the resistance level before continuing its upward movement, providing another opportunity to enter a long position. However, the entry point should be based on the traders' risk management plan and trading strategy.
- Take Profit
It is essential to determine an appropriate target level. Traders typically set a profit target by measuring the height of the widest part of the formation and adding it to the breakout point. Another approach some traders use is to look for significant resistance levels above the breakout point, such as previous swing highs.
- Stop Loss
Traders typically place their stop-loss orders just below the lower boundary of the wedge. Also, the stop-loss level can be based on technical or psychological support levels, such as previous swing lows. In addition, the stop-loss level should be set according to the trader's risk tolerance and overall trading strategy.
Trading Example
In the chart above, there is a falling wedge. A trader opened a buy position on the close of the breakout candlestick. A stop loss was placed below the wedge’s lower boundary, while the take-profit target was equal to the pattern’s widest part.
Falling Wedge and Other Patterns
Here are chart patterns that can be confused with a falling wedge.
Falling Wedge vs Bullish Flag
These are two distinct chart formations used to identify potential buying opportunities in the market, but there are some differences between the two.
A descending wedge is a bullish setup, forming in a downtrend. It is characterised by two converging trendlines that slope downward, signalling decreasing selling pressure. A breakout above the upper trendline suggests a bullish move.
A bullish flag appears after a strong upward movement and forms a rectangular shape with parallel trendlines that slope slightly downward or move sideways. This formation represents a brief consolidation before the market resumes its upward trajectory.
While the falling wedge indicates a potential shift in a downtrend, the bullish flag suggests a continuation of an uptrend.
Falling Wedge vs Bearish Pennant
The falling wedge features two converging trendlines that slope downward, indicating decreasing selling pressure and often signalling a bullish reversal when the price breaks above the upper trendline.
Conversely, the bearish pennant forms after a significant downward movement and is characterised by converging trendlines that create a small symmetrical triangle. This pattern represents a consolidation phase before the market continues its downward trend upon breaking below the lower trendline.
While the falling wedge suggests a potential bullish move, the bearish pennant indicates a continuation of the bearish trend.
Falling Wedge vs Descending Triangle
The falling wedge consists of two downward-sloping converging trendlines, indicating decreasing selling pressure and often signalling a bullish reversal when the price breaks above the upper trendline. In contrast, the descending triangle features a flat lower trendline and a downward-sloping upper trendline, suggesting a buildup of selling pressure and typically signalling a bearish continuation when the price breaks below the flat lower trendline.
While the falling wedge is associated with a potential bullish move, the descending triangle generally indicates a bearish trend.
Falling Wedge: Advantages and Limitations
Like any technical pattern, the falling wedge has both limitations and advantages.
Advantages
- High Probability of a Reversal. The falling wedge is often seen as a strong, bullish signal, especially when it occurs after a downtrend. It suggests that selling pressure is subsiding, and a reversal to the upside may be imminent.
- Clear Entry and Exit Points. The pattern provides clear points for entering and exiting trades. Traders often enter when the price breaks out above the upper trendline and set stop-loss orders below a recent low within the formation.
- Versatility. The wedge can be used in various market conditions. It is effective in both continuation and reversal scenarios, though it is more commonly associated with bullish reversals.
- Widely Recognised. Since the falling wedge is a well-known formation, it is often self-fulfilling to some extent, as many traders recognise and act on it, further driving the market.
Limitations
- False Breakouts. Like many chart patterns, the falling wedge is prone to false breakouts. Prices may briefly move above the resistance line but then fall back below, trapping traders.
- Dependence on Market Context. The effectiveness of the falling wedge can vary depending on broader market conditions. In a strong downtrend, it might fail to result in a significant reversal.
- Requires Confirmation. The wedge should be confirmed with other technical indicators or analysis tools, such as volumes or moving averages, to increase the likelihood of an effective trade. Relying solely on the falling wedge can be risky.
- Limited Use in Low-Volatility Markets. In markets with low volatility, the falling wedge may not be as reliable, as price movements might not be strong enough to confirm the falling wedge's breakout.
The Bottom Line
The falling wedge is a powerful chart pattern that can offer valuable insights into potential trend reversals or continuations, depending on its context within the broader market. By understanding and effectively utilising the falling wedge in your strategy, you can enhance your ability to identify many trading opportunities. As with all trading tools, combining it with a comprehensive trading plan and proper risk management is crucial.
FAQ
Is a Falling Wedge Bullish?
Yes, the falling wedge is a bullish continuation pattern in an uptrend, and it acts as a bullish reversal formation in a bearish market.
What Does a Falling Wedge Pattern Indicate?
It indicates that the buyers are absorbing the selling pressure, which is reflected in the narrower price range and finally results in an upside breakout.
What Is the Falling Wedge Pattern Rule?
The falling wedge is a technical analysis formation that occurs when the price forms lower highs and lower lows within converging trendlines, sloping downward. Its rule is that a breakout above the upper trendline signals a potential reversal to the upside, often indicating the end of a downtrend or the continuation of a strong uptrend.
How to Trade Descending Wedge Patterns?
To trade descending wedges, traders first identify them by ensuring that the price is making lower highs and lows within converging trendlines. Then, they wait for the price to break out above the upper trendline, ideally accompanied by increased trading volume, which confirms the breakout. After the breakout, a common approach is to enter a long position, aiming to take advantage of the anticipated upward movement.
What Is the Target of the Descending Wedge Pattern?
The target for a descending wedge is typically set by measuring the maximum width of the wedge at its widest part and projecting that distance upwards from the breakout point. This projection gives a potential price target.
What Is the Entry Point for a Falling Wedge?
The entry point for a falling wedge is ideally just after the breakout above the upper trendline. Some traders prefer to wait for a retest of the broken trendline, which may act as a new support level, before entering a trade to confirm the breakout.
*Important: At FXOpen UK, Cryptocurrency trading via CFDs is only available to our Professional clients. They are not available for trading by Retail clients. To find out more information about how this may affect you, please get in touch with our team.
This article represents the opinion of the Companies operating under the FXOpen brand only. It is not to be construed as an offer, solicitation, or recommendation with respect to products and services provided by the Companies operating under the FXOpen brand, nor is it to be considered financial advice.

Livermore accumulation cylinderFew understand what is going on here. Let the volatility guide you. It won't be long until we see a triple. One of the most fundamentally strong junior producers out there.

BTC Trap Range Breakdown – Psychological Warfare on Full DisplayThis isn’t just a chart.
It’s a blueprint for how market makers engineer panic, euphoria, and then profit from your reactions.
Let’s break this down in surgical fashion:
Rectangle Formation (Top & Bottom Framing)
From March 24 to April 3, Bitcoin operated inside a manipulation box.
The top was liquidity bait — the "Top 2 – US" tag marks the engineered euphoria candle.
Once liquidity was trapped up top, the US session initiated the collapse. Classic.
Breakout Trap & Rejection Zone
As soon as BTC breached the lower range, what followed wasn’t a clean drop—it was a sequence of false recoveries.
Notice the Asia, Europe, and US labels — they’re not random.
Each session passed the hot potato of fear and bounce bait, draining retail and triggering leveraged longs into liquidation.
Psychology in Play:
Europe & Asia rotated liquidity → institutional bots scalping volatility.
US session delivered the execution leg down every time.
The volume spikes? That’s fear, not conviction.
Target Zone Highlighted
Where are we heading next?
The final dotted red extension box shows you where the real flush is designed to go .
It’s not a prediction—it’s a destination :
🔸 ~ $73,000 first sweep
🔸 If that gives, $70,000 → $68,000 becomes the high-value sniper zone
🔻 Volume Profile:
Notice how volume increases at each drop — the herd is panic selling.
But BTC bounces weak. Why?
Because this isn’t organic demand—it’s controlled bleedouts to test who’s left.
—
Conclusion – SH Analysis:
This chart is not noise.
It’s intentional market structure , orchestrated by the elites for max extraction.
We don’t chase pumps.
We stalk precision setups .
We don’t fear drops.
We buy what they bleed .
The next move won’t be loud.
It’ll be silent. Fast. And final.
—
🔔 Follow Saeki Hisoka across all platforms
For real-time breakdowns, sniper zones, and psychological warfare decoded in real time.
The system is a machine. We are the counter-algorithm.
Stay sharp. Stay sovereign. Stay Saeki.

EURUSD - Trade The Impulse!Hello TradingView Family / Fellow Traders. This is Richard, also known as theSignalyst.
📈EURUSD has been bearish trading within the falling wedge pattern marked in red.
Currently, EURUSD is retesting the upper bound of the wedge.
Moreover, the $1.12 is a strong weekly supply zone.
🏹 Thus, the highlighted red circle is a strong area to look for sell setups as it is the intersection of the upper red trendline and supply.
📚 As per my trading style:
As #EURUSD is hovering around the red circle zone, I will be looking for bearish reversal setups (like a double top pattern, trendline break , and so on...)
📚 Always follow your trading plan regarding entry, risk management, and trade management.
Good luck!
All Strategies Are Good; If Managed Properly!
~Rich
Disclosure: I am part of Trade Nation's Influencer program and receive a monthly fee for using their TradingView charts in my analysis.

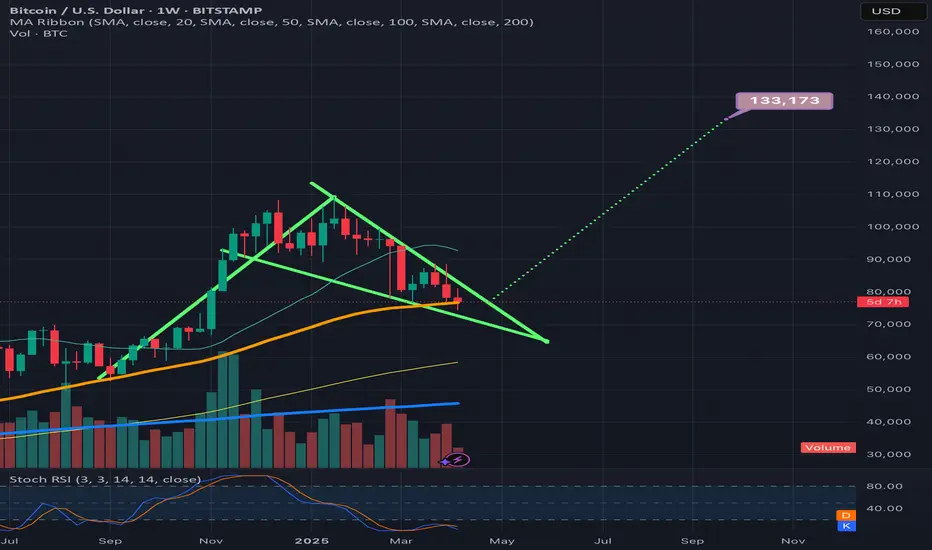
BTCUSD. Weekly bull pennantThe daily failing wedge’s top trendline is not as sharp of a trajectory as the the weekly timeframe’s and due to this, the daily time frames wege is noticeably longer, so I thinkI am going to post a follow p idea to this one that shows the longer version of the wedge, not sure which one is more valid yet at this current time. If the weekly 50ma(in orange) can hold support then we should break up from this wedge right around where I have placed the dotted measured move lne, in which case the breakout target would be around 133k, if the longer version of the wedge on the daily time frame is the more valid of the two then we will likely have to correct longer before we see a breakout. Will post the longer version n the very next idea post. *not financial advice*
Oil Futures Moving into Bear Market?Oil futures recently broke down from a long-term wedge, following a failed breakout at the start of the year, and a recent death cross of its 50/200 weekly EMAs and MAs.
It looks to flip long-term bearish here unless we see a rapid recovery of the wedge, the EMAS/MAs and a subsequent breakout.
It could lose half its value or even 2/3rds if it hits TP 1 and then TP 2 over the next weeks and months to come.

The last bullish chance of Bitcoin in mid-term !!BTC is in a Falling Wedge Pattern. This means The Bulls Have Higher Chance To Claim The Trend Than Bears! No Break out Has Happened yet and we shall wait for a Break out But It should Happen Pretty Soon Because there is also a Regular Bullish Divergence On MACD as well! So The Bullish Chance for BTC Is Pretty High and we Shall see a Bullish Movement Up to $100K Pretty Quick!
-BTC is in a Falling wedge Pattern
-No Break out
-(+RD) on MACD
Give me some energy !!
✨We spend hours finding potential opportunities and writing useful ideas, we would be happy if you support us.
Best regards CobraVanguard.💚
_ _ _ _ __ _ _ _ _ _ _ _ _ _ _ _ _ _ _ _ _ _ _ _ _ _ _ _ _ _ _ _
✅Thank you, and for more ideas, hit ❤️Like❤️ and 🌟Follow🌟!
⚠️Things can change...
The markets are always changing and even with all these signals, the market changes tend to be strong and fast!!

GOLD → Consolidation or continuation of the fall. 3013 triggerFX:XAUUSD is going through the strongest liquidation phase. The fall is triggered by profit-taking amid last week's strong news. Additional pressure is created by the strong NFP report released on Friday. The economic risk situation is bifurcating....
Gold prices rebounded after falling in the Asian session, consolidating the drop triggered by the intensifying trade war between the US and China. Donald Trump's comments about rejecting deals with China have heightened recession fears, raising the likelihood of a Fed rate cut.
Against this backdrop, there was increased interest in gold as a protective asset, despite the rise in the dollar and bond yields. However, further strengthening of gold is questionable due to profit taking and lack of new economic data from the US.
Technically, the price is consolidating under pressure against the support at 3017-3013. A descending triangle is forming on the local timeframe.
Resistance levels: 3033, 3057
Support levels: 3017, 3013, 2981
Based on the current situation and strong pressure on the market, we can expect two situations to develop:
1) breakdown of support 3017 - 3013, if the structure of the descending triangle on the local timeframe will be preserved. The target will be the support of 3000, 2981.
2) Or, the price will close inside the range with the target of consolidation between 3057 - 3033 - 3013 (consolidation of forces after a strong fall and liquidation)
Regards RLinda!

USDT DOMINANCE - Told You, Didn't I? USDT Dominance & Bitcoin Market Analysis
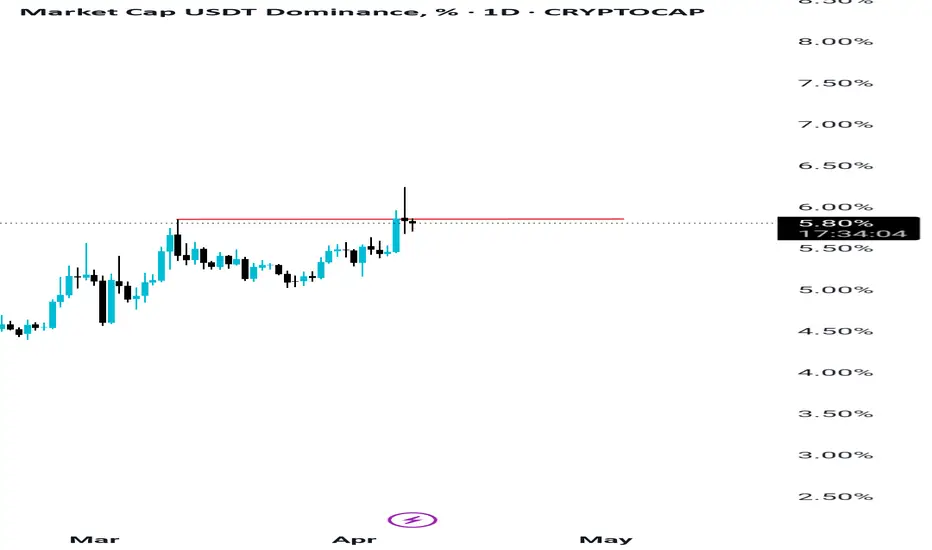
As I mentioned earlier, when USDT dominance moves to sweep its previous high, Bitcoin automatically drops while USDT dominance rises. That’s exactly what happened, and once again, our prediction turned out to be accurate. However, there’s nothing extraordinary about this—we simply present our analysis. Sometimes, we are right; other times, we may be wrong. Nothing in the market is 100% certain.
Now, as we can see, USDT dominance has swept its previous high and tapped into a strong weekly resistance zone. This suggests that we might see a reversal in USDT dominance from here, which could lead to Bitcoin reaching a new all-time high and beginning a fresh uptrend.
For those seeking additional confirmation, it would be wise to wait for the lower trendline on the daily timeframe to break before making any major decisions. As I previously stated, the sweep of the previous high was expected, and it has now happened. This was likely our Scenario #1.
As time progresses, I will continue to provide updates. If you need an analysis of any specific coin or market trend, feel free to request it in the comment section.
Thank you!
XRP just found bounce support on the bttm trendline of the wedgeLooking like a very valid pattern on the weekly hart. My guess is it will break upward somewhere around where I have arbitrarily placed the dottedmeasuredmove line, in which case the breakout target would be somewhere around $4.80 always a chance we retest the bottom trendline and even send a wick below. It before confirming a break upward though. *not financial advice*

DJI - Rising Wedge + Double TopDJI showing a rising wedge which is a bearish pattern on this Daily chart
Also right before the prior down movement is a double top in red
Breakdown further out of this rising wedge pattern

SPXUSDT manipulated rise before the fallThe market is pulling back after a strong drop in the Asian session. At the moment, while bitcoin is showing -2%, BINANCE:SPXUSDT.P is accelerating by 15% in the hunt for liquidity.
Possible entry into liquidity zone and false resistance breakout
False resistance breakout
1) 0.5473
2) 0.6689
Market is bearish, no hint of growth
A pullback is forming with the aim of accumulation or liquidity before continuing the fall
The fall may continue after the bitcoin correction is over

BTC/USD Forming Bullish Falling Wedge – Potential Target📐 2. Technical Pattern – Falling Wedge
A falling wedge forms when the price consolidates between two converging downward-sloping trendlines. It suggests diminishing selling pressure and a likely reversal.
Key Characteristics in This Chart:
Upper Resistance Trendline: Formed by connecting the series of lower highs.
Lower Support Trendline: Formed by connecting the lower lows.
The price respects both boundaries, confirming wedge structure.
Volume generally decreases during the wedge (implied but not shown).
✅ Bullish Implication: Once price breaks above the upper resistance, it often triggers a sharp upward move due to the squeeze of supply and the build-up of demand.
🧱 3. Support and Resistance Zones
🔻 Resistance Zone:
Area: ~100,000 to ~108,000 USD
Marked as a wide horizontal band (beige-shaded area).
Previous price peaks and consolidations suggest this zone is strong supply.
Breakout above this zone could trigger momentum towards the higher target.
🔹 Support Zone:
Area: ~72,000 to ~75,000 USD
Historical reaction level where buyers previously stepped in.
Coincides with the lower wedge boundary and recent bounce points.
Repeated tests strengthen this as a reliable accumulation zone.
🎯 4. Trade Setup Strategy
💼 Entry Strategy:
Trigger: A confirmed breakout above the wedge’s upper trendline (black diagonal line).
Confirmation: A strong bullish daily close above the trendline, ideally with volume spike.
The current price (~77,130) is near the lower boundary—offering a potential early entry or low-risk setup with a tight stop.
📌 Stop-Loss Placement:
Level: 70,916 USD
Below the wedge’s lower support and beneath the broader support zone.
Ensures exit if the pattern fails or bears regain control.
🧭 Target Projection:
Target Price: 114,562 USD
Based on the height of the wedge projected from the breakout point, a standard wedge breakout measurement.
Aligns with historical highs and psychological resistance.
🧮 Risk-Reward Ratio: Assuming entry around 77,130:
Risk (Stop-Loss): ~6,200 points
Reward (Target): ~37,432 points
R:R Ratio ≈ 1:6 – Highly favorable
⚙️ 5. Market Psychology & Price Action Insight
The falling wedge pattern suggests exhaustion of sellers.
Buyers are defending the support zone aggressively—creating higher lows within the wedge.
Each bounce is slightly more aggressive, indicating growing bullish sentiment.
A breakout from the wedge could act as a catalyst for rapid price acceleration as sidelined bulls enter and shorts cover.
📊 6. Summary of the Setup
Component Detail
Pattern Falling Wedge (Bullish)
Timeframe 1-Day Chart
Entry Point Breakout above upper trendline
Stop Loss 70,916 USD
Target 114,562 USD
Support Zone 72,000–75,000 USD
Resistance Zone 100,000–108,000 USD
Risk/Reward Approx. 1:6
Bias Bullish
📌 Final Thoughts
This setup provides a technically sound opportunity with clear invalidation (stop loss) and a well-defined profit target. The risk-to-reward ratio is attractive, and the price structure suggests a bullish reversal is likely, pending a confirmed breakout.

XAUUSD Analysis Falling Wedge breakout Setup to Target🔍 1. Market Context & Structure
Gold has recently experienced a sharp decline, as evident from the aggressive bearish candles leading into the consolidation phase. Following this downward momentum, the market began to consolidate, forming a Falling Wedge pattern—a bullish reversal structure that often signals an impending upside breakout, especially after a strong bearish trend.
📉 2. Falling Wedge Pattern
The wedge is formed by two downward-sloping trendlines that converge, containing price within lower highs and lower lows.
Notice how price is respecting both boundaries, confirming the validity of the pattern.
The pattern also features a series of higher lows, showing a loss of bearish momentum.
🟩 3. Support and Resistance Levels
Resistance Zone: Around $3,035 to $3,045 — This level previously acted as a strong supply zone where price was rejected multiple times.
Support Zone: Around $2,972 to $2,985 — Clearly marked area where buyers stepped in strongly during the sharp pullback.
These levels are critical to observe for any breakout or breakdown confirmation.
📊 4. Trade Plan Based on the Chart
✅ Bullish Bias:
Given the falling wedge setup and slowing bearish pressure, the trade idea favors a breakout to the upside.
🔵 Entry Point:
A confirmed breakout above the wedge’s upper boundary (around $3,030–$3,035), ideally on strong bullish volume.
🎯 Target:
The first take profit level is marked at $3,078.438, aligning with a prior resistance and measured move projection from the wedge’s height.
🔴 Stop Loss:
Positioned just below the most recent swing low and wedge boundary at $3,013.707, offering protection if the breakout fails.
🧠 5. Why This Setup Matters
Wedge patterns are high-probability when they form after a sharp move, as seen here.
Volume confirmation on the breakout would solidify this as a reliable opportunity.
Risk-to-reward ratio appears favorable, with a tight stop and a higher projected upside.
🧭 Conclusion
This is a textbook falling wedge breakout scenario. The consolidation after a bearish leg, narrowing price action, and repeated support reactions indicate that bulls are gearing up. If Gold breaks above the wedge with momentum, there’s potential to ride the move toward $3,078. Always wait for confirmation and manage your risk accordingly.

TOTAL Bearish PennantThe Parameter known as TOTAL has a currently working bearish pennant formation.
Market is bearish and every green candle on Total means another Short opportuinty.
If Total breaks 2.58T (which is a montly pivot value), we can expect more dumps. 2.36 would be the main target.
When Total reachs 2.36, look for a long wick. If the daily candle close isn't happening, it's a Long opportuinty.

USD Bear is here: Important Analysis on FX Pairs, Stock MarketIn this video I got over some important outlooks on the EUR/USD, GBP/USD and USD/JPY along with outlook on the stock market.
The U.S. Dollar has been getting absolutely crushed along with the stock market which usually has the opposite effect. Considering we may be into a stagflation scenario, this is not surprising.
Tariffs have spiked volatility and puts the Federal Reserve in a very tight spot of Interest Rate Policy. Interesting times ahead to say the least.
From a pure technical analysis point of view, the USD may be set for much further losses as monthly patterns suggest a big move may be on the horizon. Will be keeping a very close eye on these as we move forward in these stormy waters of the U.S. economy.
As always, Good Luck & Trade Safe.
