GOLD → Retest 3620 - 3600 (imbalance zones) on the uptrendFX:XAUUSD is consolidating ahead of important news. The market is currently testing support, but the bullish pattern remains intact despite the intraday correction.
Gold is trading near $3650 in anticipation of US inflation data (CPI), which will determine the further trend. So far, the metal is consolidating below a record high of $3675.
High CPI data: will strengthen the dollar and weaken gold (bets on Fed easing will decline).
Low data: will push gold to new highs (the likelihood of aggressive rate cuts will be confirmed).
At the moment, the probability of a rate cut on September 17 is 92% (25 bps), with an 8% chance of 50 bps.
Technically, the chart is forming a consolidation against the backdrop of a bullish trend, the market is testing support, and if the bulls hold their ground in the key zone, traders may return to buying.
Resistance levels: 3638, 3649, 3657
Support levels: 3620, 3607, 3600
There is a battle for the 3620 zone. Consolidation above this zone will confirm bullish strength; otherwise, we can expect a deeper correction to the 3607-3600 zone to retest the imbalance area before further growth.
Best regards, R. Linda!
Wedge

Tesla Short: Stop above $368, TP at $298In this video, I re-initiated the short idea for Tesla. Reason being that I observed that around $367-ish is an important price point (although I have no idea why). Also, the move up has been more corrective in nature (since I drew ABCDE). The move also resembles a rising wedge.
In any case, the most important point in this idea is the stop loss which should be set above $368. The ultimate Take Profit Target for me is $298 with a short-term target of $344.
Good Luck!

$RIVN bottoming? Long term 10x+?The RIVN chart is starting to look good here. As you can see from the chart, we've broken out of a falling wedge. The next challenge is for price to flip the $15.27 resistance level as support and retest it.
If it can do that, then I think we can start to see a sustained uptrend. If it tests $15.27 or briefly breaks above it and rejects, then I think there's a possibility of one more retest of the lows prior to the move starting.
That said, the chart is starting to look really good over the long term. I think this has 10X+ potential over the coming years.

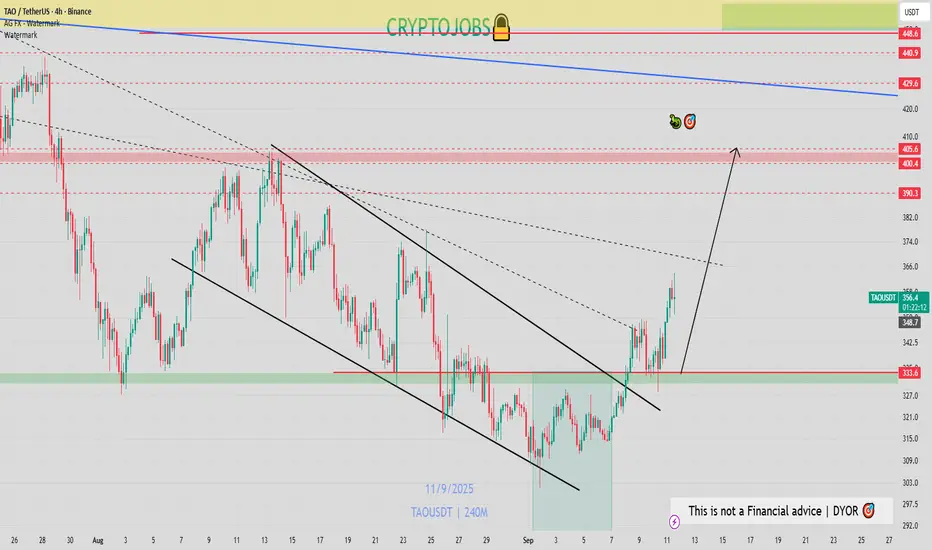
TAO - Bullish setup GETTEX:TAO might pump toward 400$ again next 📈
Neutral on the weekly basis, but a consolidation above 340$ would be good.
Lower key support: 315 - 305 - 300$ & 580$
CRUDE OIL (WTI): Strong Bearish Pressure
WTI Crude Oil is under a strong bearish pressure after
US CPI release today.
A bearish breakout of a support line of a flag pattern
in a clear intraday downtrend on a 4H time frame leaves
a strong confirmation.
I think that the price will reach 62.0 level soon.
❤️Please, support my work with like, thank you!❤️
I am part of Trade Nation's Influencer program and receive a monthly fee for using their TradingView charts in my analysis.


ARKM - READY TO FLY!!! $ARKM - big moonshot incoming?? 🚀🚀🚀
✅Clean retest of the daily wedge
✅Double bottom daily
✅Previous breakout with huge volume
Im in, price looks ready to explode way more! 📈📈📈

Oil at the crossroads - buy zone or bear trap?Technically , WTI is testing the lower boundary of a converging wedge, hovering around the identified buy zone. Holding above 62–63 is critical for bulls, as a breakdown would expose targets at 61.30 and 58.80. Conversely, a rebound from current levels could trigger a move toward 70.50 and even 77.60 if momentum builds. The daily stochastic hints at a potential reversal to the upside, suggesting that a short-term bounce may be in play.
Fundamentally , the outlook remains tense: weak demand from China and global economic uncertainty are weighing on prices, while OPEC+ continues to maintain control over supply. U.S. inventory swings, with alternating builds and exports, add to volatility. Overall, the setup looks neutral with elevated risk - macro data could easily tip the balance either way.
Tactically , the market is facing a binary scenario: sustained strength above 63 opens the way to 70.50 and 77.60, while failure here brings 58.80–55.60 into focus.
In short, oil is at a crossroads and the next decisive move depends on whether bulls can hold the line.

TIA Consolidation Ends? Bulls Eye 2.2 First, Then 4.0In my previous analysis, I mentioned that I am bullish on BINANCE:TIAUSDT , expecting the coin to recover at least part of the ground lost since the start of 2024.
So far, we haven’t seen real acceleration to the upside, but the price action is encouraging:
• Dips have been well defended around the 1.5 zone.
• The recent low stands above the July low, suggesting buyers are stepping in earlier.
• Two days ago, price finally managed to break above the falling trendline, a technical step in the right direction.
Putting these elements together, I maintain my bullish outlook. The first soft target for this move is 2.2.
But the real inflection point comes there: if TIA manages to stabilize above 2.2, a level that acted as support in early 2025 and resistance in late July, then the door opens for a much stronger rally. In that case, a reasonable target would be 4.0, with momentum likely to pick up sharply.

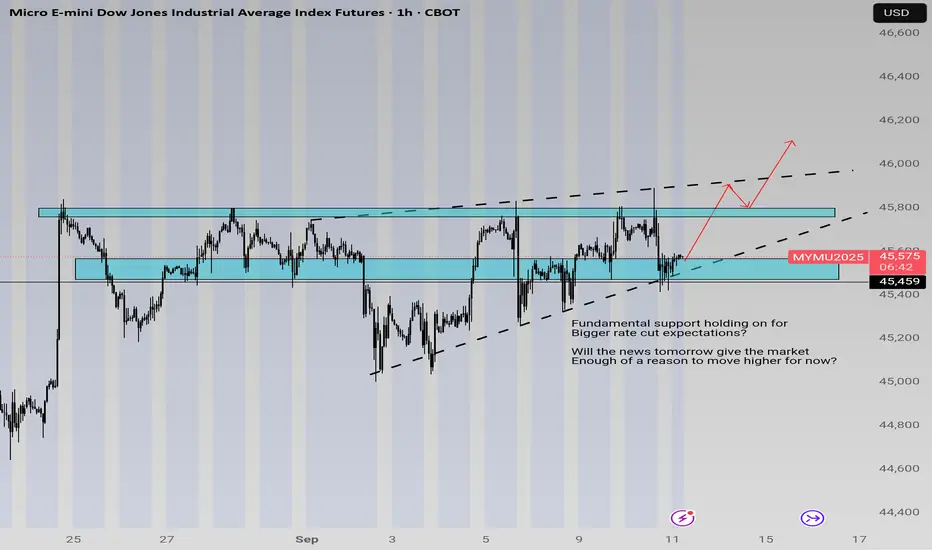
Technicals Illustrating Current Positioning of BullsEquities have bulls building into positions as seen with rising support, and the pressure against the supply zone around ATHs are becoming more squeezed as we get closer to next week.
The zone is main Key Level holding direction. Tomorrow's news will give more volatility and will be the next clue as to what may happen.
JUPUSDT Is Screaming Reversal – Will You Be the Last Bull HoldinYello, Paradisers – are you about to walk straight into a trap? JUPUSDT is currently showing strong bearish signs right at a key resistance zone, and if you're still holding long positions, it might be time to reconsider before it’s too late.
💎We’re spotting multiple bearish divergences across major indicators: MACD, RSI, and Stochastic RSI are all signaling weakness. On top of that, JUP is moving within an ascending channel, which is typically a bearish continuation pattern. These signals combined are increasing the probability of a sharp downward move from current levels.
💎If we get a proper rejection here, the short setup could easily deliver a 1:1.5 risk-to-reward or better. For more conservative traders, waiting for a pullback with confirmation—such as a bearish candlestick formation backed by high volume—is the smarter play. This approach not only gives a clearer signal but also allows for a tighter stop-loss, improving the overall trade setup.
💎More aggressive traders could consider shorting from the current market price, but keep in mind that confirmation is always key when looking to maximize probability and manage risk effectively.
💎However, if price breaks above the invalidation level and closes a candle above that zone, the bearish outlook will be invalidated. In that case, it’s best to stay out and reassess based on new structure.
🎖Strive for consistency, not quick profits. Treat the market as a businessman, not as a gambler. The only traders who make it in the long run are those who stay patient, wait for high-probability setups, and avoid emotional decisions. Stay sharp and stay disciplined, Paradisers.
MyCryptoParadise
iFeel the success🌴

Swing Trade Idea ENS/USDT – Long Setup (8H timeframe)Entry Range: $23.30-23.50
Take Profit 1: $23.99
Take Profit 2: $24.59
Take Profit 3: $25.18
Stop Loss: $22.51
Leverage: 10-15x
Please trade with care and use proper position sizing and risk management always ✅

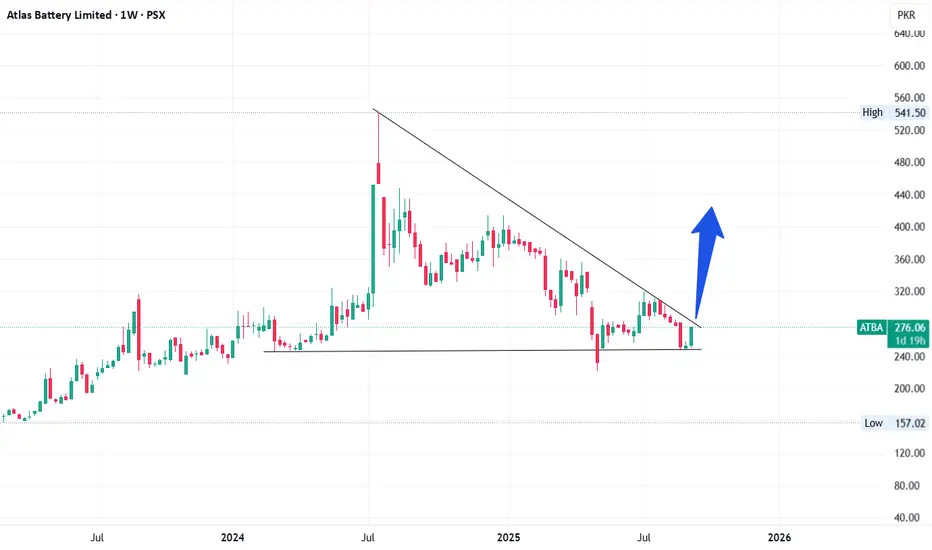
ATBA Taking Trendline ResistanceATBA is currently taking trendline resistance as shown in chart. Once broken (weekly closing above 287), it will bounce back to its recent high (~450).
On weekly timeframe, a falling wedge pattern can be observed which is a bullish pattern.
Bad result in recent quarter may cause this trendline resistance to be a tough task to break. However, on a bigger (monthly) timeframe, a beautiful inverse head and shoulder is forming that may take its effect in coming months.
This is not a buy / sell call, be cautious while investing in fundamentally weak stocks.
Keep your stoploss at 221 (Recent low on May 7th).
BTCUSD: Fake Breakout and Drop to Support LineHello everyone, here is my breakdown of the current Bitcoin setup.
Market Analysis
From a broader perspective, the price of Bitcoin has transitioned from a downward channel into a large rising wedge pattern. This structure has defined the price action for several weeks, creating a volatile environment with clear boundaries at the support zone near the 109000 level and the resistance zone up to the 113000 area.
Currently, we are at a very interesting and critical point. The price has once again rallied to the top of the Wedge and is testing the major horizontal resistance at the 112500 level. This is the third significant test of this ceiling in recent history.
My Scenario & Strategy
My scenario is built on a repeating pattern of behavior I've observed at this resistance. On the two previous tests of this 112500 area, the price created a 'fake breakout', briefly pushing above the level only to be aggressively sold off. This repeated failure is a strong clue that sellers are dominant here.
My expectation is that history will repeat itself. I'm looking for the price to make one more 'fake breakout' push into the 112500 - 113000 resistance zone. A swift reversal and a fall back below the 112500 level would be the key signal that sellers have once again taken control. The primary target for this move is 110700, which aligns with the ascending wedge support line.
That's the setup I'm tracking. Thank you for your attention, and always manage your risk.

TIA - Bullish wave awaited! LSE:TIA - bullish breakout awaited💣
Trend remain hihly oversell on the monthly basis
I expect to see a bull run toward 2.20 - 2.300$ key resistance next! 📈
Key support to be maintained: 1.675$

$NXXT long? Large move incoming?NASDAQ:NXXT has been in a falling wedge and it looks to be set to break out in the near future.
Should it break above $2.30 or so, I can see the start of a large move up to the $7 resistance, or potentially higher.
Let's see how it plays out over the coming weeks/ months.


COW - TP2 HITTSX:COW - TP2 ✅
Clean falling wedge H4 breakout & retest ✅📈
We could see a big bull impulse similar as 🚀

Babydoge - bullish Following my previous outlook at perfection! 📈
Excpeting a +10/15% move again on #babydoge

ENAUSDT → Attempting a trend change. Focus on 0.700BINANCE:ENAUSDT is forming an attempt to change the trend. The price breaks the descending resistance and forms a new trading range. The focus on the 0.7 support and the bulls' reaction...
Bitcoin looks quite positive after breaking the downside resistance, but there is a strong 112K zone ahead and news on Thursday / Friday. If the general backdrop maintains its bullishness, BTC's rise will support strong altcoins and the market could turn green, including the coin discussed in this publication...
ENAUSDT breaks through the downtrend resistance. Price is consolidating above the boundary and forming a trading range. The focus is on the 0.7 - 0.683 area. If the bulls keep the price above this area, it will confirm the fact of trend change, which could trigger a rally to 0.7745 - 0.853
Support levels: 0.7, 0.683, 0.668
Resistance levels: 0.736, 0.7745
Technically, there is a possible struggle between market participants for the area 0.7 - 0.668. In this case, I will not consider the return to the channel as a false breakout of the trend, as a strong upward impulse was formed earlier, which generally broke the local market structure. However, based on the technical situation, I will consider entering the position after clear signs of price holding above the key support zone.
Regards R. Linda!

XAUUSD 15M – Bullish Structure | BULLS STEPING INFOREXCOM:XAUUSD
Structure | Trend | Key Reaction Zones
Price is moving inside an ascending channel, showing higher lows (HL) and bullish structure. Demand zone around 3643 – 3645 has been retested successfully, keeping buyers active.
Market Overview
Gold is maintaining bullish momentum with strong buyer interest from the lower trendline. As long as 3628 holds as invalidation, we can expect continuation to the upside. A breakout above 3659 resistance will confirm further momentum.
Key Scenarios
✅ Bullish Case 🚀 →
🎯 Target 1: 3652
🎯 Target 2: 3659
🎯 Target 3: 3665
❌ Bearish Case 📉 (if 3628 breaks) →
🎯 Downside Target: 3613
🎯 Extended Target: 3606
Current Levels to Watch
Resistance 🔴: 3659
Support 🟢: 3643 – 3645
⚠️ Stoploss: 3628 (below invalidation zone)
⚠️ Disclaimer: This analysis is for educational purposes only. Not financial advice.

Long bond bulls’ eye bigger breakoutThe bullish move in U.S. ultra-long bond futures anticipated last week has played out nicely, with the contract surging higher over the subsequent days, taking out a key topside hurdle comprising the 200DMA and horizontal resistance at 119’19. The move has now stalled at a downtrend from the highs set in September last year, a period when the Fed went full-bore dove on concerns the U.S. was potentially slipping into recession. Sound familiar?
Zooming out, the contract is coiling within a falling wedge, a continuation pattern that points to the potential for a far larger extension of the bullish move should the price break and hold above the September 2024 downtrend. The signal from the breakout may not be as reliable as others given long bond futures have been anything but bullish in recent years, but convention suggests we could eventually revisit the September 2024 highs, implying a 30-year yield of less than 4%.
122’18 and 124’24 are minor levels to monitor on the topside before more significant tests await at 129’00, 132’00, 135’13 and the September 2024 swing high. RSI (14) and MACD point to building bullish momentum, favouring a similar directional bias that should improve the odds of the breakout sticking, should it occur.
Good luck!
DS
