Hey Look! Sellers are Getting Weaker You may notice that the recent price declines are becoming smaller (marked by the grey arrows). The red candlesticks are shrinking, indicating that selling pressure is weakening while buyers are gradually stepping into the market.
As sellers lose momentum, we can expect the support area between 2.779 – 2.713 to hold and potentially trigger a price bounce. For now, we wait for the price to reach this zone and look for a clear confirmation signal before entering.
From a chart pattern perspective, a falling wedge reversal is forming — a pattern often associated with bullish reversals. The 2.779 – 2.713 support area aligns with this pattern and can be considered a potential buy zone, provided we get proper confirmation.
Wedge

C3.a1 - Buy now !!!C3.A1 my fav share is ready for big breakout. It is forming falling wedge and ready for big move...
Targets are mentioned in the chart

Mara Holdings - get out now!Bearish set up (price to move lower)
Its made a wedge and the height of the wedge takes it back to the all time low, which could be exceeded as over 95% reduction from the apex of the pattern.
Hopefully people get out of this if you have a bearish point of view as quick as possible and any rallies are to be sold if you are bearish
Long term, over the next couple of years this pattern does not look bullish to me at the moment
If it breaks upwards and subsequently moves over the apex point then this bearish pattern is voided and the bull market returns. If it pops back under again then this ones really in trouble.
Wishing you luck with your trading, if you are a novice then this is not a good instrument to play in with potential for it to practically go close to zero which is unusual for a stock. If you work for them hedge your share options and keep your CV updated.
Some of the market makers are stopping taking short positions on it now, to hedge your holding that usually means an imbalance and excess of short interest possibly with a full order book at for the market makers and they do not want to take on any more downside risk.
Please be careful if you are retail.

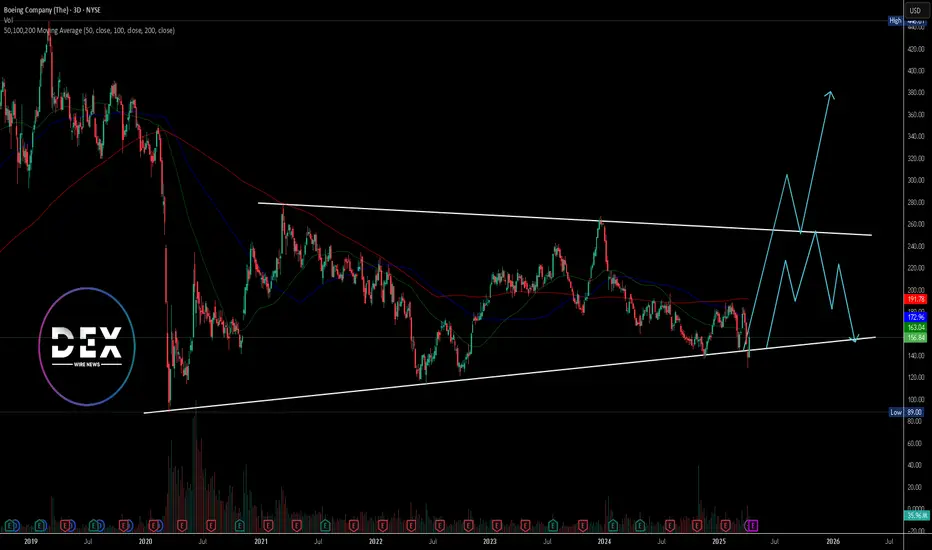
Boeing ($BA) Faces Renewed Scrutiny After Latest Safety ConcernsBoeing (NYSE: NYSE:BA ) stock closed at $156.84 on April 11, gaining 0.85% despite fresh concerns surrounding delayed aircraft deliveries. China's Juneyao Airlines recently postponed the delivery of a 787-9 Dreamliner, originally valued at $120 million. The decision comes amid renewed U.S.-China trade tensions driven by tariff escalations from President Trump’s administration.
This delay could disrupt Juneyao’s planned expansion into European routes this summer. The Dreamliner, known for its long-range capabilities, was central to these international plans. The incident signals how geopolitical strain continues to impact global aviation and commercial aircraft deals.
Boeing has already cautioned that additional tariffs may put more pressure on supply chains. These chains had only recently begun to stabilize following years of pandemic-related disruptions. The company remains exposed to evolving international policies, which can affect order fulfillment and investor sentiment.
Earnings for Boeing are expected on April 23, 2025. Investors are watching closely for guidance on production capacity, deliveries, and any fallout from global trade developments.
Technical Analysis
Boeing is trading within a broad wedge pattern marked by long-term support and resistance trendlines. Price recently bounced from the support, rising sharply to the current level of $156.84. The 50, 100, and 200-day moving averages sit at $163.04, $172.96, and $191.78 respectively.
These levels now act as dynamic resistance. Price remains below all three, signaling overall bearish pressure unless a breakout occurs. A breakout above the resistance trendline may lead to a rally. However, if price fails to gain momentum and breaks below the lower trendline, it could revisit the $89 low from 2020.
ONDO Falling Wedge + Bullish DivergenceBITGET:ONDOUSDT is compressing inside a falling wedge, now trading near key support. Signs of potential reversal are building.
🔹 Key Observations
• Pattern: Falling wedge (bullish bias)
• Support: Price is holding just above the ~$0.68–$0.75 demand zone
• Volume: Declining throughout the wedge – typical pre-breakout behavior
• RSI: Bullish divergence forming + compression under 50, often seen before breakouts
🔸 What to Watch
• Breakout trigger: Daily close above wedge resistance (orange trendline), ideally with volume
• Target zones: $1.30 to $1.60, then $1.90 to $2.10 (prior S/R levels)
• Invalidation: Breakdown below the green demand zone ($0.68)
⚠️ As always, confirmation matters – no breakout yet. But the setup is clean and worth watching closely.

Bitcoin Short Term Danger (4H)Bitcoin has formed a rising wedge pattern, typically considered a bearish reversal structure, suggesting a potential retracement ahead.
Watch for a possible breakdown around the $83,800 level. If this level is breached, price may head toward the $79,000–$80,000 zone, where stronger buying interest is expected.
This potential move also aligns well with key Fibonacci retracement levels, providing confluence for the setup.
Furthermore, the Bitcoin CME Futures chart supports this scenario — a large gap is expected to open tomorrow, and historically, Bitcoin tends to fill CME gaps in the short term.
— Thanks for reading.

Algorand Consolidation "Pointing" To An End??Here we can see COINBASE:ALGOUSD is about finished forming a Continuation Pattern, the Bullish Wedge!
Price has made an impressive .50 increase since Trump taking office but has slipped into quite a steep Consolidation Phase where Price has made run for the 88.6% Retracement and seems to be filling out the rest of the "Point" of the Wedge!
Accompanying the Chart Pattern is a Decrease in Volume as well, signaling the tight Consolidation could be looking to make a break soon!
*With a True Breakout, we will want to be vigilant of multiple factors coming into play with Increase of Volume to Validate the Break of Pattern!
Once the Pattern is Confirmed and a Breakout Validated, based on the "Flagpole" of the Pattern, we could expect a potential extension of price to go behind the current Swing High of .6133 and up into the .70 area!

BITCOIN → Testing trend resistance. Will there be a breakout?BINANCE:BTCUSDT is approaching trend resistance and most likely it may test the liquidity zone and risk zone for sellers (liquidity hunt ?), but does the market have the potential to support the upside?
Bitcoin is strengthening and channel resistance may not stop this growth. Based on the nature of price movement (smooth, gradual, consolidating), bitcoin may test liquidity 84.7K - 88.8K. But it is too early to talk about further growth
On W1, the price is in a trading range (consolidation) between the previously broken global consolidation support and the current support. Short bodies, long shadows speak about consolidation. Also worth noting are the relatively long tails to the downside and the weak market reaction...
Fundamentally, the cryptocurrency market (community as a whole) for the past week did not get anything positive as from the very beginning of this year, the growth can be attributed to the 90-day technical break by Trump, but there are a number of nuances:
- the fire has not yet been put out
- just because they gave a 90-day break doesn't mean everything is fine. It's just a head start for the U.S. to prepare for the situation more thoroughly
- The escalating conflict between the U.S. and China has investors looking for less risky assets like gold. Cryptocurrencies are definitely not on that list.
- Rumors of a US interest rate cut are likely to provide support as well.
Resistance levels: 84700, 88800
Support levels: 78200, 73-74К, 66500
I would not hurry with conclusions about further growth. Growth could be considered if bitcoin overcomes 88800 and consolidates above this zone. But a sharp approach or a false breakout of one of the mentioned liquidity zones may provoke a reversal and fall.
Regards R. Linda!

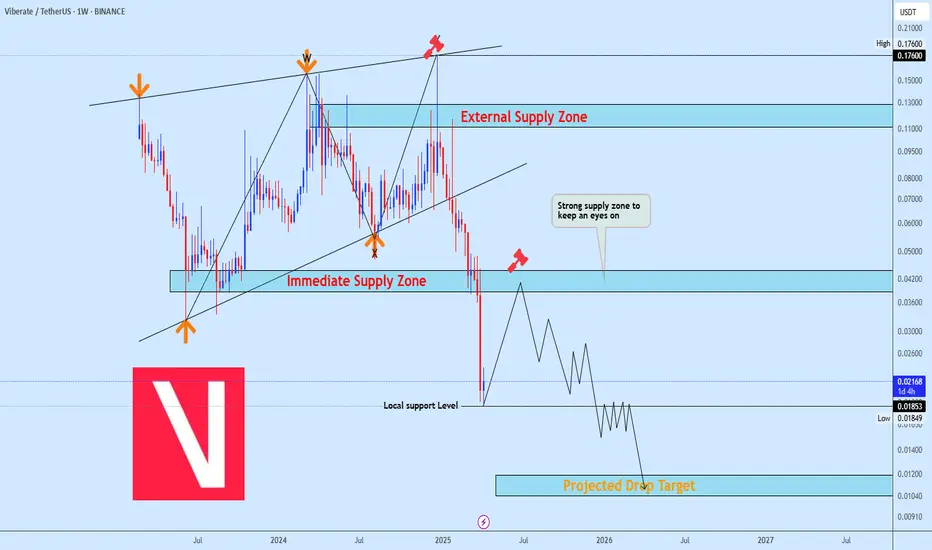
VIB Bearish Continuation Setup After Wedge BreakdownVIB broke down from a rising wedge and has since faced strong bearish pressure. With Binance monitoring the project, investor confidence is weakening, fueling the sell-off. We expect a retracement toward the supply zone before shorting to the outlined drop target.
Let us know your view on this setup.
#Pyth near of a decision momentAccording to the fibo retracement from the last higher level to the recent lowest, it seems that we are reaching a crucial moment to know if it breaks out or if it continue to follow the descending channel. Stay focused and do your own researches. Not A Financial Advice !

Bitcoin (BTCUSDT) – Technical and Fundamental Analysis 1DBTC has formed a falling wedge pattern on the daily chart, indicating a possible bullish breakout. A clean break above the 0.618 Fibonacci level at $86,485 may trigger an impulsive move to the upside. Price is bouncing from wave (4) and challenging the descending trendline. RSI is recovering, suggesting renewed buying momentum, and MACD shows signs of a bullish reversal.
Fundamental Factors
Bitcoin remains supported by strong institutional demand and optimism around crypto ETFs. Expectations of lower interest rates and macroeconomic uncertainty continue to drive interest in BTC as a hedge. Meanwhile, on-chain data reflects accumulation, with exchange outflows increasing in recent sessions.
Scenarios:
Main scenario – breakout above 0.618 targeting $96,595 and $109,474, with a potential extension toward $125,842.
Alternative scenario – pullback toward $79,384. If this level fails to hold, further correction to $72,283 and $63,497 is possible. The $79K level remains a key support for bulls.

HelenP. I After strong impulse up, BTC can start to declineHi folks today I'm prepared for you Bitcoin analytics. BTC has recently shown a strong recovery after reaching the support zone between 77000 and 76200 points. This area had already acted as a base twice in the past, and the price once again reacted from it with a sharp bullish impulse. The rise brought Bitcoin back into the resistance zone between 83500 and 84300 points - a level that has proven significant in the past. At the same time, BTC approached the descending trend line that forms the upper boundary of the wedge pattern visible on the chart. The reaction from this confluence zone was immediate. The price got rejected right at the intersection of the trend line and resistance zone, forming a clear rejection candle and showing weakness from buyers. This area is now holding Bitcoin down once again and proving itself as a strong supply zone. At the moment, BTC is trading below the trend line and under pressure from resistance. Given the recent price action, multiple rejections from the same zone, and position relative to the wedge, I expect Bitcoin to decline again toward 78000 points - my current goal. If you like my analytics you may support me with your like/comment ❤️

#BTCUSDT shows signs of reversal📉 SHORT BYBIT:BTCUSDT.P from $82,125.0
🛡 Stop loss: $82,976.0
🕒 Timeframe: 4H
✅ Overview:
➡️ The BYBIT:BTCUSDT.P chart shows a rising wedge — a typical bearish pattern.
➡️ Price hit the upper wedge boundary and started to decline, breaking support.
➡️ A second top (Top 2) has formed on weakening volume, signaling a possible reversal.
➡️ The POC at $82,490.8 has been broken — price is holding below it, strengthening the bearish case.
🎯 TP Targets:
💎 TP 1: $81,430.0
💎 TP 2: $80,887.0
💎 TP 3: $80,485.0
📢 Additional scenario notes:
📢 Entry activates upon breakdown and consolidation below $82,125.
📢 Watch for increased volume at key TP levels for confirmation.
📢 A move above $82,976.0 invalidates the setup — stop placed just above key resistance and wedge top.
🚀 BYBIT:BTCUSDT.P shows signs of reversal — a corrective move to the downside is expected.

EURCHF: To The New Lows 🇪🇺🇨🇭
THere is a high chance that EURCHF will drop lower before the market closes.
I see a confirmed violation of a support of the flag
on an hourly time frame.
Next support - 0.921
❤️Please, support my work with like, thank you!❤️

EURO - Price can make correction and then continue to move upHi guys, this is my overview for EURUSD, feel free to check it and write your feedback in comments👊
Some days ago price broke resistance and started a strong upward impulse, exiting from a flat accumulation zone.
After this breakout, the Euro made a sharp rise and formed a rising wedge pattern.
Then price reached the upper boundary of a wedge and bounced down, testing the support line of the pattern.
Recently, it touched the support zone near the $1.0800 level and then bounced with recovery toward resistance.
Now price trades inside wedge, holding above support line and forming bullish continuation structure.
In my opinion, Euro can continue to grow and reach $1.1185 resistance line of the wedge soon.
If this post is useful to you, you can support me with like/boost and advice in comments❤️

Nasdaq 100 to 17000On the above 3-day chart price action has corrected 33% since late December. A number of reasons now exist to be bullish, including:
1) The ‘incredible buy’ signal has printed. Look left.
2) The buy signal is coming in at 81% probability. The previous were 75%, 72@, & 72% percent, respectively. Look at the strength of if a 75% recovery, what do you think a 81% will be like? This can only be the result of a massive short squeeze, in my opinion.
3) Price action has just printed a ‘double bottom’ (orange line) on past support / resistance - look left!
4) Most recently price action has broken out of a bullish falling wedge formation with back test confirmation, see below.
Is it possible price action falls further? For sure.
Is it probable? No.
Good luck!
Ww
A little closer

Relief Rally or Further Drop? Key Levels to Watch on ARBUSDTARBUSDT continues its descent after invalidating the macro rising wedge, with price action firmly suppressed below key supply zones. Current wave structure hints at a potential relief rally toward 0.3886 before resuming the broader bearish trajectory toward the projected drop target at 0.1718. Until the macro descending trendline at 0.6259 is decisively broken, bearish sentiment remains dominant.

BTC Continuation to the down sidei shared BTC analysis on DEC 17,2024,
The chart showed a potential rising wedge and breakout from a rising wedge pattern, a subsequent -30.12% drop (over 3.2 million pips), and a key support level should retest around the GETTEX:64K zone
before the next huge up trend
don't forget to take your profit at GETTEX:64K

ADA road map !!!The ADA will increase 40 cents and reach to the top of the wedge in the coming weeks.
Give me some energy !!
✨We spend hours finding potential opportunities and writing useful ideas, we would be happy if you support us.
Best regards CobraVanguard.💚
_ _ _ _ __ _ _ _ _ _ _ _ _ _ _ _ _ _ _ _ _ _ _ _ _ _ _ _ _ _ _ _
✅Thank you, and for more ideas, hit ❤️Like❤️ and 🌟Follow🌟!
⚠️Things can change...
The markets are always changing and even with all these signals, the market changes tend to be strong and fast!!

EURUSD Tests 17-Year Long-Term Trend!!!After Trump announced an additional 20% in tariffs, EURUSD made a relatively surprising move and surged sharply. This marks the second leg of the upward trend that began in early March. However, the sharp rise has now brought EURUSD to the doorstep of a very long-term resistance level.
Since testing 1.60 in 2008, EURUSD has been moving lower within a wide descending trend channel that has held for 17 years. Since 2015, the pattern has evolved into a wedge formation within this broader channel. The most recent test of this resistance came last year, but at the time, a weak Eurozone economy, crowded Euro long positions, and a hawkish Fed prevented a breakout.
This time, the landscape is different. The Eurozone is showing early signs of recovery, the ECB’s rate cuts appear to be nearing their end, and European countries have started to band together following a decline in confidence in their biggest ally and decide to increase technology, defence spending.
Despite these developments, the medium-term effects of the new tariffs and the strength of the long-term resistance level are likely to prevent a clear breakout for now. Still, the long-term outlook is beginning to shift in favor of the euro, and a breakout later this year carries a significant probability.

CHFJPY: Intraday Bullish Signal?! 🇨🇭🇯🇵
It looks like CHFJPY has completed a local correctional movement
after a formation of a strong bullish wave.
I see a violation of a resistance line of a falling wedge pattern as a confirmation.
Next goal - 175.72
❤️Please, support my work with like, thank you!❤️

Gold daily analysis On daily chart gold is showing a strong bullish movement but this is an alarming situation and from any time gold will give a biggest correction in the history , and can come upto 2100 doller, my last sell price is 3295 keeping SL of 3320 for q target of 2100.

DOGE → Will the market hold strength or lose it all?BINANCE:DOGEUSDT is testing the liquidity and resistance zone amid a downtrend as part of a news-induced rally. Will the market hold this trend or return to a sell-off?
The downtrend continues. As part of the correction triggered by the news backdrop, bitcoin strengthened and pulled the altcoins with it. But the market may lose all its growth quite quickly, as bearish pressure on the market is still very strong (There are no fundamental positive changes for the market). The fall of BTC may be followed by DOGE as well.
Technically, the price is forming a false break of the resistance zone 0.1622 - 0.15700, consolidation of the price below this zone will provoke the continuation of the fall to the nearest zone of interest 0.13646.
Resistance levels: 0.157, -0.1622
Support levels: 0.13646, 0.1277, 0.1154
A retest of the trend resistance is possible, but price consolidation below the key zone will be a good signal indicating the seller's strength, the decline may continue. On the weekly timeframe we have a trigger at 0.14217, break of which will open the way to 0.1277 - 0.1025.
Regards R. Linda!

RSR/USDT: FALLING WEDGE BREAKOUT! 100%+ PROFIT POTENTIAL!!🚀 Hey Traders! RSR Breakout Alert – 100%+ Rally Incoming? 👀🔥
If you’re hyped for big moves and real alpha, smash that 👍 and hit Follow for high-accuracy trade setups that actually deliver! 💹🚀
RSR has just broken out of a falling wedge structure on the daily timeframe—a powerful bullish pattern. The chart’s signaling a potential 100–150% upside move if momentum picks up from here. 📈
📍 Entry Zone: CMP – Add more on dips down to $0.0066
🎯 Target: 100%–150% upside
🛑 Stop-Loss: $0.0054
📊 Trade Plan:
✅ Buy from current levels
✅ Add on dips near breakout support
✅ Ride the breakout wave with tight risk control!
💬 What’s Your Take?
Are you riding this RSR breakout or waiting on confirmation? Drop your thoughts and targets in the comments—let’s ride this wave together! 💰🔥
