Market Insights with Gary Thomson: 30 June - 4 JulyMarket Insights with Gary Thomson: Eurozone Inflation, US Jobs, ISM PMIs, ECB Forum Updates
In this video, we’ll explore the key economic events, market trends, and corporate news shaping the financial landscape. Get ready for expert insights into forex, commodities, and stocks to help you navigate the week ahead. Let’s dive in!
In this episode, we discuss:
— Euro Area Inflation Rate YoY Flash
— US Nonfarm Payrolls and Unemployment Rate
— US ISM Manufacturing and Services PMI
— ECB Forum on Central Banking
Note: U.S. markets may see thin trading ahead of the 4 July holiday, raising volatility risks.
Don’t miss out—gain insights to stay ahead in your trading journey.
This video represents the opinion of the Companies operating under the FXOpen brand only. It is not to be construed as an offer, solicitation, or recommendation with respect to products and services provided by the Companies operating under the FXOpen brand, nor is it to be considered financial advice.
Weeklymarketsanalysis

Crude Oil Weekly OutlookNYMEX:CL1! NYMEX:MCL1!
With Nasdaq futures hitting all-time highs, our attention now turns to Crude Oil, which has seen a sharp pullback over the past week.
All-time highs in equity indices present a unique challenge:
There are no historical reference points—no prior price or volume data to lean against. Traders typically turn to tools like Fibonacci extensions, measured moves, or rely on market-generated information and emerging intraday levels before making decisions.
What Has the Market Done?
Crude Oil Futures (CL) posted a record drop last week, falling sharply from a Sunday open high of $78.40 to a Monday close low of $64.38—a $14.02 decline.
This sharp sell-off followed developments suggesting a potential Iran–Israel ceasefire and the end of a two-week conflict, prompting markets to rapidly unwind the geopolitical risk premium.
What is it trying to do?
CL Futures have since consolidated around the 2025 mid-range. The market appears to be in a balancing phase, digesting the removal of war-related premiums and recalibrating based on fundamentals.
How Good of a Job Is It Doing?
Having effectively priced out war risk, the market is now refocusing on fundamentals.
The global demand outlook is improving, driven in part by progress in trade deals.
OPEC’s June Monthly Oil Market Report (MOMR) forecasts global oil demand growth of 1.3 mb/d for 2025.
This transition from headline risk to fundamental drivers indicates market maturity and resilience, albeit within a still-volatile regime.
What Is More Likely to Happen From Here?
Today marks the final trading day of the month, and seasonal demand will become increasingly relevant.
Summer weather and travel activity are expected to drive demand for jet fuel and gasoline.
These seasonal tailwinds, if sustained, could help stabilize price action around key technical zones.
Key Levels:
yOpen: 67.65
pHi: 66.09
pIB Hi: 66
2025 mid-range: 65.39
pLow: 64.80
Overnight Low: 64.55
Naked VPOC: 64.50
Scenario 1: Continued Consolidation (Balance Holds)
Crude oil maintains range-bound behavior.
Strategy: “Outside-in” trading—fade moves at range extremes until new directional information emerges.
Scenario 2: Break from Balance
If directional conviction builds, price could break the current consolidation.
Upside target: Yearly open near $67.65.
Downside risk: March 2025 low if $64.40 fails.
All intraday levels noted above should be monitored for structure and participation.

BTC may going low after ATH?Weekly Analysis:
- Market to go higher , as last week's weekly candle was very bullish
- May sweep Weekly Buyside Liquidity
- May move bearish towards the Weekly FVG

Market Insights with Gary Thomson: 23 - 27 JuneMarket Insights with Gary Thomson: Canada Inflation, US Core Consumer Metrics, and Earnings Reports
In this video, we’ll explore the key economic events, market trends, and corporate news shaping the financial landscape. Get ready for expert insights into forex, commodities, and stocks to help you navigate the week ahead. Let’s dive in!
In this episode, we discuss:
— Inflation Rate in Canada
— US Durable Goods Orders
— US PCE Price Index, Personal Income & Personal Spending
— Corporate Earnings Statements
Don’t miss out—gain insights to stay ahead in your trading journey.
This video represents the opinion of the Companies operating under the FXOpen brand only. It is not to be construed as an offer, solicitation, or recommendation with respect to products and services provided by the Companies operating under the FXOpen brand, nor is it to be considered financial advice.

WTI - ANALYSIS BUY AREA This week the ongoing conflict seems to bring more uptrend to this commodity
I believe that the last broken resistance now turning support at 67.300 will be tested prior to the OIL raising again
If the conflict doesn’t end and we don’t have a ceasefire we could see this commodity running to the 78.000 and 82.000 levels

Weekly Market Outlook: FOMC, Trade Deals and GeopoliticsIt is a holiday-shortened week, with the majority of markets halting early on Thursday, June 19, 2025, in observance of Juneteenth. See here for holiday trading schedule
Key Themes to Monitor This Week
Geopolitical Risks
Any outside intervention in the ongoing Israel-Iran conflict will likely be seen as a risk-off event by market participants. Despite Friday’s sell-off, markets shrugged off during the Sunday open and overnight sessions.
There are potential risks to trade routes and energy infrastructure, although disruptions seem unlikely at the moment. Amena Bakr at Kpler noted that, so far, there are no signs of disruptions in oil loadings from Iran. Without a supply outage, there is no pressing need for additional barrels to be brought onto the market.
Trade War and Trade Deals
There have been recent developments with the U.S. reaching key trade deal milestones with several countries. The baseline scenario remains optimistic, with expectations for an extension in negotiations and potential reciprocal tariffs for countries failing to reach agreements.
FED Week
This is a key week for U.S. monetary policy, with the FOMC decision, Summary of Economic Projections (SEP), and Chair Powell’s press conference scheduled.
Traders will be closely watching how the Fed’s inflation and growth expectations have evolved, as reflected in the SEP. All eyes will be on the dot plot to note how interest rate expectations have evolved since last quarter. Of note: Will President Trump’s continued calls for rate cuts influence Chair Powell’s tone or guidance?
Expectations for the Week Ahead
NQ futures have continued one-time framing higher, consistently creating higher lows since the week of April 21, 2025. A strong support zone exists below, anchored at the yearly Volume Point of Control (VPOC) and the Anchored VWAP from May 11, 2025, when markets gapped higher.
Key Levels to Watch
• yVAH: 22,690.50
• R2: 22,510
• R1 / Previous Week High: 22,322.50
• May 11 AVWAP: 21,672.25
• yVPOC: 21,660
Scenario 1: Market Grinds Higher but Stays Cautious
Despite several looming risk factors, the market could continue to grind higher. In this scenario, we anticipate a test above the prior week's high, followed by a potential pullback into last week’s range.
Example Trade Idea 1
• Entry: 22,000
• Stop: 21,930
• Target: 22,322
• Risk: 70 pts
• Reward: 322 pts
• Risk-Reward Ratio: 4.6R
Scenario 2: Pullback to Support, Range-Bound Consolidation
If the market pulls back, we expect the yearly VPOC and AVWAP from May 11 to act as key support levels. In this case, price action may remain range-bound within the previous week’s range, forming an inside week.
Example Trade Idea 2
• Entry: 21,672
• Stop: 21,600
• Target: 22,000
• Risk: 72 pts
• Reward: 328 pts
• Risk-Reward Ratio: 4.6R
________________________________________
Glossary
• VPOC: Volume Point of Control
• VA: Value Area
• VAL: Value Area Low
• VAH: Value Area High
• VP: Volume Profile
• AVP: Anchored Volume Profile
• Y: Yearly
• pWk: Previous Week

XAU/USD 16-20 June 2025 Weekly AnalysisWeekly Analysis:
Swing Structure -> Bullish.
Internal Structure -> Bullish.
Analysis and bias remains the same as analysis dated 16 March 2025.
In my analysis dated 27 October 2024 I mentioned (below) that price could potentially print higher-highs in order to reposition CHoCH. This is exactly how price printed. CHoCH positioning has been brought significantly closer to current price action. CHoCH positioning is denoted with a shortened blue dotted horizontal line.
The remainder of my analysis and bias remains the same as analysis dated 09 February 2025.
Price has printed a further bullish iBOS.
Price is currently trading within an internal low and fractal high. CHoCH positioning is denoted with a blue dashed line.
Price Action Analysis:
In my analysis dated 27 October 2024, it was noted that the first sign of a pullback would be a bearish Change of Character (CHoCH), indicated by a blue dotted line. Price's consistent upward momentum had repositioned previous CHoCH much closer to recent price levels as expected for weeks. Current CHoCH positioning is quite a distance away from price, therefore, it would be viable if price continued bullish to reposition ChOCH.
Note:
It is highly unlikely price will "crash" as many analysts are predicting. My view is this is merely a corrective wave of the primary trend.
Given the Federal Reserve's dovish policy stance alongside heightened geopolitical risks, market volatility is likely to remain elevated, influencing intraday price swings.
Price could also be driven by President Trump's policies, geopolitical moves and economic decisions which are sparking uncertainty and potential repricing of Gold.
Weekly Chart:
Daily Analysis:
Swing -> Bullish.
Internal -> Bullish.
Analysis and Bias remains the same as Analysis dated 11 May 2025.
Since my last weekly analysis price has finally printed a bearish CHoCH.
This is the first indication, but not confirmation of bearish pullback phase initiation.
Price is now trading within an established internal range.
Price should now technically trade down to either discount of 50% internal EQ, or Daily demand zone before targeting weak internal high, priced at 3,500.200.
Note:
The Federal Reserve’s continued dovish stance, coupled with escalating geopolitical uncertainties, is expected to sustain elevated market volatility, influencing both intraday and broader trend developments.
Additionally, price action may be further shaped by U.S. policy decisions, including measures enacted under President Trump. Shifts in geopolitical strategy and economic policymaking could introduce further uncertainty, contributing to the ongoing repricing dynamics within the gold market.
Daily Chart:
H4 Analysis:
-> Swing: Bullish.
-> Internal: Bullish.
Analysis and bias remains the same as analysis dated 23 April 2025
Price has now printed a bearish CHoCH according to my analysis yesterday.
Price is now trading within an established internal range.
Intraday Expectation:
Price to trade down to either discount of internal 50% EQ, or H4 demand zone before targeting weak internal high priced at 3,500.200.
Note:
The Federal Reserve’s sustained dovish stance, coupled with ongoing geopolitical uncertainties, is likely to prolong heightened volatility in the gold market. Given this elevated risk environment, traders should exercise caution and recalibrate risk management strategies to navigate potential price fluctuations effectively.
Additionally, gold pricing remains sensitive to broader macroeconomic developments, including policy decisions under President Trump. Shifts in geopolitical strategy and economic directives could further amplify uncertainty, contributing to market repricing dynamics.
H4 Chart:

Let’s break down what's currently happening in the GBP/USD.GBP/USD Analysis in a Simple and Beginner
Let’s break down what's currently happening in the GBP/USD market, in a way that even someone without any trading experience can grasp easily.
At the moment, the market attempted to break out on the buy (upside), but it faced rejection, meaning it tried to go higher but couldn’t sustain that move and started falling down.
As the price dropped, it reached a point where a bullish engulfing pattern had previously formed this is a special pattern in trading which often signals a potential strong buying opportunity.
Now, here’s the key point:
📍 If the market comes back down to this engulfing buy zone, there's a high probability that it will bounce back up strongly from there think of it like a spring that’s been compressed and is ready to launch upward.
On the other hand:
📍 If the market doesn’t come down and instead continues moving upward, then we already have a bearish engulfing pattern waiting at a higher level. This is a zone where the market could face resistance and fall sharply again.
So what should you do?
✅ Be patient — let the market come to these important engulfing levels.
✅ Don’t rush into trades. Let the price touch these zones and then observe the reaction.
These engulfing zones are like magic they often predict powerful movements. Wait for the price to reach the level, and then watch the magic unfold.
Even if you're new to trading, this kind of analysis helps you understand when and where the market might turn without needing complicated indicators.
DYOR! Not Financial Advice.

EURUSD WEEKLY HTF FORECAST Q2 W25 Y25EURUSD WEEKLY HTF FORECAST Q2 W25 Y25
Professional Risk Managers👋
Welcome back to another FRGNT chart update📈
Diving into some Forex setups using predominantly higher time frame order blocks alongside confirmation breaks of structure.
💭NOTE- If price closes above the key weekly/ daily order block with daily close- re evaluation will be required.
🔑 Remember, to participate in trading comes always with a degree of risk, therefore as professional risk managers it remains vital that we stick to our risk management plan as well as our trading strategies.
📈The rest, we leave to the balance of probabilities.
💡Fail to plan. Plan to fail.
🏆It has always been that simple.
❤️Good luck with your trading journey, I shall see you at the very top.
🎯Trade consistent, FRGNT X

GBPJPY WEEKLY HTF FORECAST Q2 W25 Y25GBPJPY WEEKLY HTF FORECAST Q2 W25 Y25
Professional Risk Managers👋
Welcome back to another FRGNT chart update📈
Diving into some Forex setups using predominantly higher time frame order blocks alongside confirmation breaks of structure.
🔑 Remember, to participate in trading comes always with a degree of risk, therefore as professional risk managers it remains vital that we stick to our risk management plan as well as our trading strategies.
📈The rest, we leave to the balance of probabilities.
💡Fail to plan. Plan to fail.
🏆It has always been that simple.
❤️Good luck with your trading journey, I shall see you at the very top.
🎯Trade consistent, FRGNT X

Market Insights with Gary Thomson: 9 - 13 JuneMarket Insights with Gary Thomson: UK Unemployment & GDP, US Inflation & PPI, Earnings Reports
In this video, we’ll explore the key economic events, market trends, and corporate news shaping the financial landscape. Get ready for expert insights into forex, commodities, and stocks to help you navigate the week ahead. Let’s dive in!
In this episode, we discuss:
— UK Unemployment Rate
— US Inflation Rate
— UK GDP Growth Rate
— US Producer Price Index
— Corporate Earnings Statements
Don’t miss out—gain insights to stay ahead in your trading journey.
This video represents the opinion of the Companies operating under the FXOpen brand only. It is not to be construed as an offer, solicitation, or recommendation with respect to products and services provided by the Companies operating under the FXOpen brand, nor is it to be considered financial advice.

Market Insights with Gary Thomson: 2 - 6 JuneMarket Insights with Gary Thomson: BoC & ECB Rates, Canada and US Job Data & Earnings Reports
In this video, we’ll explore the key economic events, market trends, and corporate news shaping the financial landscape. Get ready for expert insights into forex, commodities, and stocks to help you navigate the week ahead. Let’s dive in!
In this episode, we discuss:
— BoC’s Interest Rate Decision
— ECB’s Interest Rate Decision
— Unemployment Rate in Canada
— NFP and Unemployment Rate in the US
— Corporate Earnings Statements
Don’t miss out—gain insights to stay ahead in your trading journey.
This video represents the opinion of the Companies operating under the FXOpen brand only. It is not to be construed as an offer, solicitation, or recommendation with respect to products and services provided by the Companies operating under the FXOpen brand, nor is it to be considered financial advice.

XAU/USD 02-06 June 2025 Intraday AnalysisWeekly Analysis:
Swing Structure -> Bullish.
Internal Structure -> Bullish.
Analysis and bias remains the same as analysis dated 16 March 2025.
In my analysis dated 27 October 2024 I mentioned (below) that price could potentially print higher-highs in order to reposition CHoCH. This is exactly how price printed. CHoCH positioning has been brought significantly closer to current price action. CHoCH positioning is denoted with a shortened blue dotted horizontal line.
The remainder of my analysis and bias remains the same as analysis dated 09 February 2025.
Price has printed a further bullish iBOS.
Price is currently trading within an internal low and fractal high. CHoCH positioning is denoted with a blue dashed line.
Price Action Analysis:
In my analysis dated 27 October 2024, it was noted that the first sign of a pullback would be a bearish Change of Character (CHoCH), indicated by a blue dotted line. Price's consistent upward momentum had repositioned previous CHoCH much closer to recent price levels as expected for weeks. Current CHoCH positioning is quite a distance away from price, therefore, it would be viable if price continued bullish to reposition ChOCH.
Note:
It is highly unlikely price will "crash" as many analysts are predicting. My view is this is merely a corrective wave of the primary trend.
Given the Federal Reserve's dovish policy stance alongside heightened geopolitical risks, market volatility is likely to remain elevated, influencing intraday price swings.
Price could also be driven by President Trump's policies, geopolitical moves and economic decisions which are sparking uncertainty and potential repricing of Gold.
Weekly Chart:
Daily Analysis:
Swing -> Bullish.
Internal -> Bullish.
Analysis and Bias remains the same as Analysis dated 11 May 2025.
Since my last weekly analysis price has finally printed a bearish CHoCH.
This is the first indication, but not confirmation of bearish pullback phase initiation.
Price is now trading within an established internal range.
Price should now technically trade down to either discount of 50% internal EQ, or Daily demand zone before targeting weak internal high, priced at 3,500.200.
Note:
The Federal Reserve’s continued dovish stance, coupled with escalating geopolitical uncertainties, is expected to sustain elevated market volatility, influencing both intraday and broader trend developments.
Additionally, price action may be further shaped by U.S. policy decisions, including measures enacted under President Trump. Shifts in geopolitical strategy and economic policymaking could introduce further uncertainty, contributing to the ongoing repricing dynamics within the gold market.
Daily Chart:
H4 Analysis:
-> Swing: Bullish.
-> Internal: Bullish.
Analysis and bias remains the same as analysis dated 23 April 2025
Price has now printed a bearish CHoCH according to my analysis yesterday.
Price is now trading within an established internal range.
Intraday Expectation:
Price to trade down to either discount of internal 50% EQ, or H4 demand zone before targeting weak internal high priced at 3,500.200.
Note:
The Federal Reserve’s sustained dovish stance, coupled with ongoing geopolitical uncertainties, is likely to prolong heightened volatility in the gold market. Given this elevated risk environment, traders should exercise caution and recalibrate risk management strategies to navigate potential price fluctuations effectively.
Additionally, gold pricing remains sensitive to broader macroeconomic developments, including policy decisions under President Trump. Shifts in geopolitical strategy and economic directives could further amplify uncertainty, contributing to market repricing dynamics.
H4 Chart:

GBPUSD Weekly overview Jun 1, 2025 – Jun 7, 2025We are approaching a strong HTF reversal level from lower prices. It means we might have some unexpectable strong bearish players in the market. I'll take a little less than normal for the bullish trades.
While the mid-term overview indicates us a bullish trend some bearish move won't surprise me.
*******************************************************
The indicated levels are determined based on the most reaction points and the assumption of approximately equal distance between the zones.
Some of these points can also be confirmed by the mathematical intervals of Murray.
You can enter with/without confirmation. IF you want to take confirmation you can use LTF analysis, Spike move confirmation, Trend Strength confirmation and ETC.
SL could be placed below the zone or regarding the LTF swings.
TP is the next zone or the nearest moving S&R, which are median and borders of the drawn channels.
*******************************************************************
Role of different zones:
GREEN: Just long trades allowed on them.
RED: Just Short trades allowed on them.
BLUE: both long and short trades allowed on them.
WHITE: No trades allowed on them! just use them as TP points

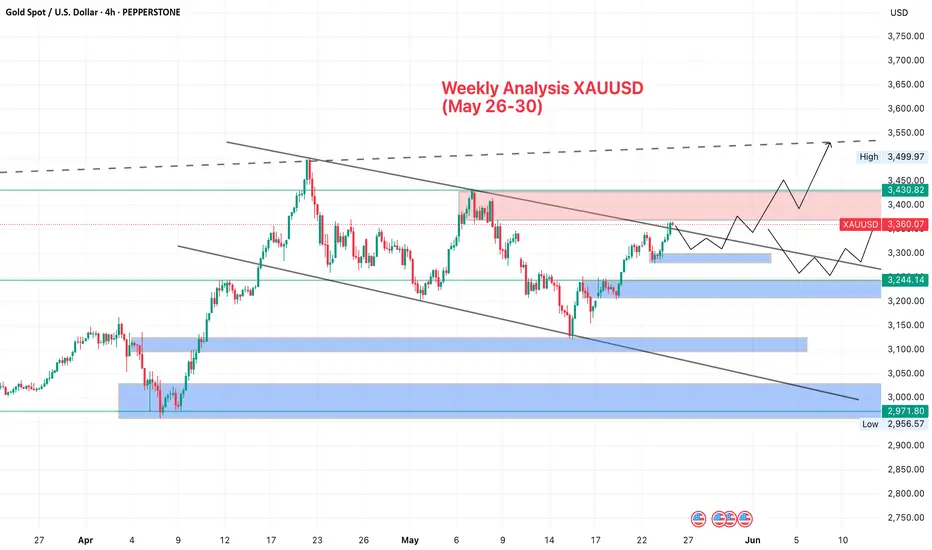
Weekly Analysis For XAUUSD (stress free trading) Weekly Analysis for Goldie (May 26–30)
From last week's analysis, we’re still on track and the move was fueled by news as expected. (just following Technical levels)
Gold broke the trendline clean and retested it, with structure still holding bullish. Price rejected around 3365, which aligns with the 4H fib (23%) and a minor supply zone. volume faded on Friday due to the early US close and the long weekend.
Powell’s speech is set for early Monday before the market opens. If he leans dovish or hints at rate cuts, gold could break above 3371 and push toward 3430 or even 3498. But if he stays hawkish, we might get another rejection at 3365 and a pullback to 3330 or even 3292 though the bullish bias remains intact unless 3244 breaks.
On the macro side, US/EU tariffs kicking in June 1 ongoing (but still unresolved) Iran talks, Trumps new tax bill adding more debt, and the Moody’s downgrade of the US credit outlook all lean toward further upside for gold. COT data also shows instiution still holding strong net long positions in gold.
⭐️ Expect low NY session volume on monday due to the US holiday. Key zones to watch 3371 for breakout continuation, 3330 and 3292 for pullback buys, and 3365 for short-term scalp rejections. Overall bias remains bullish with strong structure and macro confluence.
Market Insights with Gary Thomson: 19 - 23 MayMarket Insights with Gary Thomson: RBA Rate Decision, Canada & UK Inflation Rate, Earnings Reports
In this video, we’ll explore the key economic events, market trends, and corporate news shaping the financial landscape. Get ready for expert insights into forex, commodities, and stocks to help you navigate the week ahead. Let’s dive in!
In this episode, we discuss:
— RBA’s Interest Rate Decision
— Inflation Rate in Canada
— Inflation Rate in the UK
— Corporate Earnings Statements
Don’t miss out—gain insights to stay ahead in your trading journey.
This video represents the opinion of the Companies operating under the FXOpen brand only. It is not to be construed as an offer, solicitation, or recommendation with respect to products and services provided by the Companies operating under the FXOpen brand, nor is it to be considered financial advice.

XAU/USD 19-23 May 2025 Weekly AnalysisWeekly Analysis:
Swing Structure -> Bullish.
Internal Structure -> Bullish.
Analysis and bias remains the same as analysis dated 16 March 2025.
In my analysis dated 27 October 2024 I mentioned (below) that price could potentially print higher-highs in order to reposition CHoCH. This is exactly how price printed. CHoCH positioning has been brought significantly closer to current price action. CHoCH positioning is denoted with a shortened blue dotted horizontal line.
The remainder of my analysis and bias remains the same as analysis dated 09 February 2025.
Price has printed a further bullish iBOS.
Price is currently trading within an internal low and fractal high. CHoCH positioning is denoted with a blue dashed line.
Price Action Analysis:
In my analysis dated 27 October 2024, it was noted that the first sign of a pullback would be a bearish Change of Character (CHoCH), indicated by a blue dotted line. Price's consistent upward momentum had repositioned previous CHoCH much closer to recent price levels as expected for weeks. Current CHoCH positioning is quite a distance away from price, therefore, it would be viable if price continued bullish to reposition ChOCH.
Note:
It is highly unlikely price will "crash" as many analysts are predicting. My view is this is merely a corrective wave of the primary trend.
Given the Federal Reserve's dovish policy stance alongside heightened geopolitical risks, market volatility is likely to remain elevated, influencing intraday price swings.
Price could also be driven by President Trump's policies, geopolitical moves and economic decisions which are sparking uncertainty and potential repricing of Gold.
Weekly Chart:
Daily Analysis:
Swing -> Bullish.
Internal -> Bullish.
Analysis and Bias remains the same as Analysis dated 11 May 2025.
Since my last weekly analysis price has finally printed a bearish CHoCH.
This is the first indication, but not confirmation of bearish pullback phase initiation.
Price is now trading within an established internal range.
Price should now technically trade down to either discount of 50% internal EQ, or Daily demand zone before targeting weak internal high, priced at 3,500.200.
Note:
The Federal Reserve’s continued dovish stance, coupled with escalating geopolitical uncertainties, is expected to sustain elevated market volatility, influencing both intraday and broader trend developments.
Additionally, price action may be further shaped by U.S. policy decisions, including measures enacted under President Trump. Shifts in geopolitical strategy and economic policymaking could introduce further uncertainty, contributing to the ongoing repricing dynamics within the gold market.
Daily Chart:
H4 Analysis:
-> Swing: Bullish.
-> Internal: Bullish.
Analysis and bias remains the same as analysis dated 23 April 2025
Price has now printed a bearish CHoCH according to my analysis yesterday.
Price is now trading within an established internal range.
Intraday Expectation:
Price to trade down to either discount of internal 50% EQ, or H4 demand zone before targeting weak internal high priced at 3,500.200.
Note:
The Federal Reserve’s sustained dovish stance, coupled with ongoing geopolitical uncertainties, is likely to prolong heightened volatility in the gold market. Given this elevated risk environment, traders should exercise caution and recalibrate risk management strategies to navigate potential price fluctuations effectively.
Additionally, gold pricing remains sensitive to broader macroeconomic developments, including policy decisions under President Trump. Shifts in geopolitical strategy and economic directives could further amplify uncertainty, contributing to market repricing dynamics.
H4 Chart:

Tata Power is showing strengthTata Power's technical indicators suggest a strong buy signal based on moving averages and oscillators. Here’s a quick breakdown:
- Relative Strength Index (RSI): 65.04 (indicating bullish momentum)
- MACD: 3.38 (positive crossover, signaling upward trend)
- Moving Averages: All major SMAs and EMAs indicate a buy
- Pivot Points: Key support at ₹388.64, resistance at ₹398.69
Close Above 400 mark will be positive
- Short-Term Forecast: Technical analysis suggests support around ₹390 and resistance near ₹626, with a potential price target of ₹417.23 in the next two weeks.

Market Insights with Gary Thomson: 12 - 16 MayMarket Insights with Gary Thomson: US Inflation Rate, UK GDP Growth Rate, US PPI, Earnings Reports
In this video, we’ll explore the key economic events, market trends, and corporate news shaping the financial landscape. Get ready for expert insights into forex, commodities, and stocks to help you navigate the week ahead. Let’s dive in!
In this episode:
— US Inflation Rate
— UK GDP Growth Rate
— US Producer Price Index
— Corporate Earnings Statements
Don’t miss out—gain insights to stay ahead in your trading journey.
This video represents the opinion of the Companies operating under the FXOpen brand only. It is not to be construed as an offer, solicitation, or recommendation with respect to products and services provided by the Companies operating under the FXOpen brand, nor is it to be considered financial advice.

XAU/USD 12-16 May 2025 Weekly AnalysisWeekly Analysis:
Swing Structure -> Bullish.
Internal Structure -> Bullish.
Analysis and bias remains the same as analysis dated 16 March 2025.
In my analysis dated 27 October 2024 I mentioned (below) that price could potentially print higher-highs in order to reposition CHoCH. This is exactly how price printed. CHoCH positioning has been brought significantly closer to current price action. CHoCH positioning is denoted with a shortened blue dotted horizontal line.
The remainder of my analysis and bias remains the same as analysis dated 09 February 2025.
Price has printed a further bullish iBOS.
Price is currently trading within an internal low and fractal high. CHoCH positioning is denoted with a blue dashed line.
Price Action Analysis:
In my analysis dated 27 October 2024, it was noted that the first sign of a pullback would be a bearish Change of Character (CHoCH), indicated by a blue dotted line. Price's consistent upward momentum had repositioned previous CHoCH much closer to recent price levels as expected for weeks. Current CHoCH positioning is quite a distance away from price, therefore, it would be viable if price continued bullish to reposition ChOCH.
Note:
It is highly unlikely price will "crash" as many analysts are predicting. My view is this is merely a corrective wave of the primary trend.
Given the Federal Reserve's dovish policy stance alongside heightened geopolitical risks, market volatility is likely to remain elevated, influencing intraday price swings.
Price could also be driven by President Trump's policies, geopolitical moves and economic decisions which are sparking uncertainty and potential repricing of Gold.
Weekly Chart:
Daily Analysis:
Swing -> Bullish.
Internal -> Bullish.
Since my last weekly analysis price has finally printed a bearish CHoCH.
This is the first indication, but not confirmation of bearish pullback phase initiation.
Price is now trading within an established internal range.
Price should now technically trade down to either discount of 50% internal EQ, or Daily demand zone before targeting weak internal high, priced at 3,500.200.
Note:
The Federal Reserve’s continued dovish stance, coupled with escalating geopolitical uncertainties, is expected to sustain elevated market volatility, influencing both intraday and broader trend developments.
Additionally, price action may be further shaped by U.S. policy decisions, including measures enacted under President Trump. Shifts in geopolitical strategy and economic policymaking could introduce further uncertainty, contributing to the ongoing repricing dynamics within the gold market.
Daily Chart:
H4 Analysis:
-> Swing: Bullish.
-> Internal: Bullish.
Analysis and bias remains the same as analysis dated 23 April 2025
Price has now printed a bearish CHoCH according to my analysis yesterday.
Price is now trading within an established internal range.
Intraday Expectation:
Price to trade down to either discount of internal 50% EQ, or H4 demand zone before targeting weak internal high priced at 3,500.200.
Note:
The Federal Reserve’s sustained dovish stance, coupled with ongoing geopolitical uncertainties, is likely to prolong heightened volatility in the gold market. Given this elevated risk environment, traders should exercise caution and recalibrate risk management strategies to navigate potential price fluctuations effectively.
Additionally, gold pricing remains sensitive to broader macroeconomic developments, including policy decisions under President Trump. Shifts in geopolitical strategy and economic directives could further amplify uncertainty, contributing to market repricing dynamics.
H4 Chart:

XAUUSD Weekly Outlook – May 12–17, 2025High Timeframe Bias: Bullish with active pullback under premium supply
🔍 Macro Structure Insight:
Market structure remains bullish on Weekly, with a recent ATH at ~3500.
Price showed a strong rejection from the 3448–3500 premium supply zone but found support near 3284–3292.
We are currently in a retracement phase, and the next few candles will determine if it’s a reload or deeper correction.
📌 Key Weekly Structural Zones
Zone / Level Description
3500 ✅ ATH – liquidity sweep & rejection
3448–3500 🔺 Premium Weekly Supply – key rejection zone
3380–3395 🔁 Weekly FVG – potential short-term resistance
3284–3292 🔵 Fresh Support – demand reaction after daily wick bounce
3220–3250 🔵 HTF Weekly Demand – equilibrium & previous BOS zone
3120–3150 ❗ Critical Support – losing this would break bullish structure
📈 Fibonacci Weekly Extension Zones (Above ATH – 2285 → 3500 Leg)
Extension Level Target Price Description
1.0 3500 Current ATH
1.12 3560 First minor extension
1.18 3590 Shallow breakout target
1.236 3620 Key fibo confluence zone
1.272 3645 Round-level + breakout magnet
1.33 3680 Sentiment shift potential
1.414 3720 Major HTF fibo extension
1.5 3760 Mid-range round milestone
1.618 3800–3820 Golden extension + HTF magnet zone
🔁 Scenarios for This Week:
Bullish Continuation:
If 3284–3250 holds as a higher low → market may aim for 3380–3395, then test 3448–3500 again.
Breaking above ATH could trigger targets toward 3560 → 3590 → 3645.
Bearish Retracement:
If price breaks below 3250, a deeper move toward 3120–3150 could begin. This would threaten the weekly bullish leg.
⚠️ Watch for:
Weekly close below 3250 = short-term bearish shift
Push and hold above 3360–3380 = signs of bullish continuation
Rejection from 3448–3500 again = potential double-top liquidity trap

ES Futures at a Crossroads: Fed Steady, Market ReadyCME_MINI:ES1!
Recent Market Performance
ES Futures experienced a significant decline of 22.30% from the February 19, 2025 high of 6218.50 to the recent low of 4832 on Monday, April 7th, 2025. This drawdown included a sharp 16.30% sell-off, triggered by the announcement of reciprocal tariffs, marking a decline from the April 2, 2025 high to the April 7th low.
Since forming that low, ES Futures have rebounded impressively—rallying 18.48% into the May 2nd high, retracing well over 50% of the losses. Notably, price action has closely respected Fibonacci retracement levels, as illustrated in the accompanying chart.
Macro Fundamentals
There are several macroeconomic considerations at play:
• Quarterly GDP data appears skewed due to front-loaded imports, evident in the January and February import numbers.
• This week’s March trade balance, imports, and exports data for both the U.S. and China will be crucial. These figures will shed light on how escalating tariff tensions have influenced Q1 business activity.
• The key event this week is the Federal Reserve interest rate decision and FOMC press conference. Of particular interest will be how the Fed’s risk outlook has evolved in light of Trade War 2.0, along with updates to growth and inflation forecasts.
While the Fed is expected to hold rates steady, there are increasing calls from President Trump to cut rates. Although recent soft data has shown signs of deterioration, this has not yet translated into hard data. In fact, April’s Non-Farm Payroll (NFP) report beat expectations, underscoring continued economic resilience.
Key Question: What Comes Next?
Will ES Futures continue to trend higher, reverse lower, or consolidate?
Key Technical Levels
• mCVAL: 5635
• Upper Neutral Zone : 5620 – 5585
• March 2025 Low: 5533.75
• Lower Neutral Zone : 5171.75 – 5150.75
Fibonacci Retracement Levels (2025 High to Low)
• 2025 High: 6218.50
• 0.786 Retracement: 5921.75
• 0.618 Retracement: 5688.75
• 0.5 Level (Mid-Range): 5525.25
• 2025 Low: 4832
Our View
We believe downside risks are currently minimized, barring a new market-moving development—such as a disruptive social media post. Q1 earnings have broadly reflected strength, reducing the probability of further downside in the near term.
Given the current backdrop:
• Positive news could act as a catalyst for higher prices.
• In the absence of significant newsflow, we expect consolidation, followed by a potential resumption of the upward trend.
Scenario 1
A pullback to either the blue support zone near the 0.618 Fibonacci retracement confluence, or a deeper pullback towards the confluence of the 2025 mid-range and March 2025 lows, followed by a continuation higher.
Scenario 2
Seasonality supports consolidation. Historical index behavior at this time of year further aligns with the potential for sideways movement before the next leg higher.

Market Insights with Gary Thomson: 5 - 9 MayMarket Insights with Gary Thomson: Fed and BoE Rate Decisions, Canada Jobs, Earnings Reports
In this video, we’ll explore the key economic events, market trends, and corporate news shaping the financial landscape. Get ready for expert insights into forex, commodities, and stocks to help you navigate the week ahead. Let’s dive in!
In this episode, we discuss:
— Fed’s Interest Rate Decision
— BoE’s Interest Rate Decision
— Unemployment Rate in Canada
— Corporate Earnings Statements
Don’t miss out—gain insights to stay ahead in your trading journey.
This video represents the opinion of the Companies operating under the FXOpen brand only. It is not to be construed as an offer, solicitation, or recommendation with respect to products and services provided by the Companies operating under the FXOpen brand, nor is it to be considered financial advice.
