Bitcoin is heading to 20000K! Following a steady hourly uptrend, Bitcoin finally touched the $9000 level again and bulls took advantage of it and pushed it up to $9300 within 2 hours. Bitcoin did not crash this time and it’s stabilizing at $9250 for now. The daily uptrend is now in place again and the weekly bull flag seems to be confirmed at this point. Most importantly, the monthly uptrend is starting to take shape and the volume increasing is very significant.
It certainly seems like Bitcoin has all it needs for another bull run at this point, breaking the $20000 level this year doesn’t seem so far fetched now, in fact it looks quite probable. The next monthly resistance lies at $10000. The daily chart is still not overbought at this point so we have more room for the upside, either way we have seen that after this type of moves, the RSI doesn’t always act as resistance and can get really overextended for long periods of time before cooling off.
A lot of analysts talked about Bitcoin whales accumulation, it definitely seems like it was the case and it’s now reflected in a big way. FOMO (fear of missing out) also seems to be coming back and will certainly be a huge factor when Bitcoin approaches $20000 again.
Whaleagents

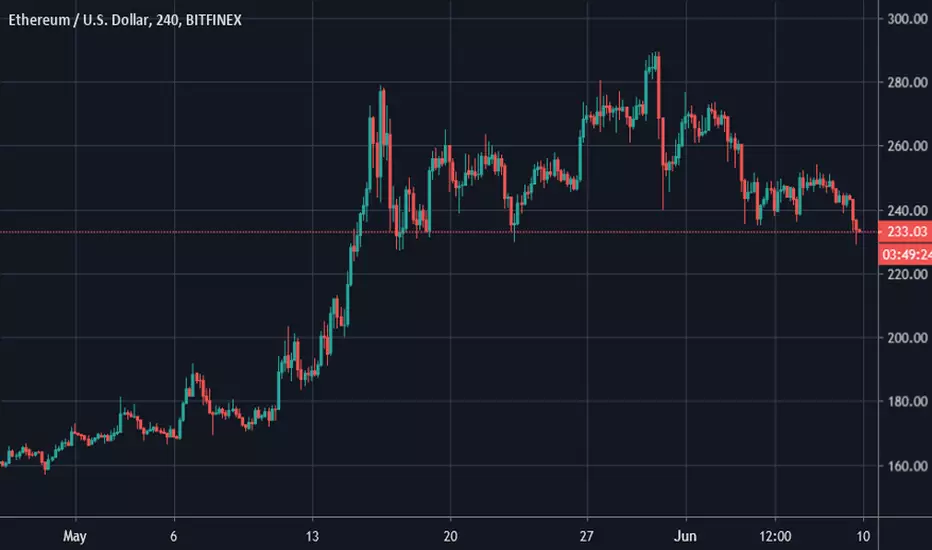
Ethereum Bears Showing Their StrengthEthereum on the daily time frame broke the low of $233 which was support and it’s clearly more bearish than Bitcoin and the others. Our new daily lower high is $254.4 and anything under that level is just a lower high of a bounce attempt. The next support is at $222.8, really important support level because after that, there is no nearby support level and would be notable.
This is a scenario where all the top cryptocurrencies are going down, Ethereum is simply going down faster and we can clearly see that in the ETH/BTC chart. The 4 Hour chart was certainly indicating a lack of strength even though it was a trend change. There was barely any continuation after we changed the trend, hitting $251. A lot of upper wicks started to appear which indicates lack of strength and bears holding the price.
Nonetheless a bullish candlestick is forming in the 4 Hour Chart and the RSI is getting closer to the oversold zone which could indicate a small bounce but we have to be cautious and realize we are still in a downtrend on the daily chart.
Ethereum 2.0 development is on schedule and might play an important role when it’s finally completed, although this is planned to happen in 2021 so it is still a long way until that.
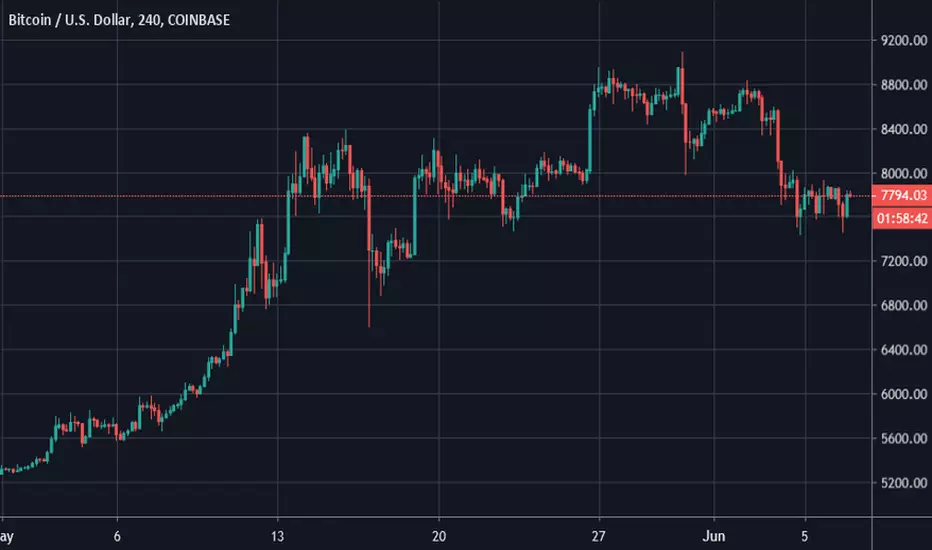
Bitcoin Bears Attack ?It’s no surprise to see Bitcoin pullback after 13 weeks of higher lows. Bitcoin was forming another tightening pattern, this time it broke bearish after we broke the low of $8005. Bears had a good amount of continuation and were able to bring Bitcoin down to $7481.
The daily chart is certainly showing signs of a trend change, we are now currently in a downtrend on the daily chart and bears are trying to form a bear flag. Long term, Bitcoin is still bullish and the weekly trend is still basically intact, the monthly chart can easily form a bull flag, which would be quite ideal for the bulls.
This pullback wasn’t a surprise and a lot of analysts expected it for some time now, the RSI is now at 50 for the first time in 3 months. This move, however, might have been caused by a whale, a redditor found out that someone moved 25k BTC just before the crash, someone selling that amount of Bitcoin could certainly cause a crash and trigger a lot of stop loss orders.
Analysts are still quite optimistic about bitcoin and most of them think this is a healthy move even if it was caused by manipulation.