Crude Oil Monthly Forecast: September 2025
The West Texas Intermediate Crude Oil market has been rather negative during the month of August, but at the end of the month we saw the market bounce roughly 50% of the move, and as I do this analysis at the end of the month, we are sitting at a crucial level.
This does make a certain amount of sense, because there are a lot of questions right now about where the global economy is going.
Crude Oil and the Economy
Keep in mind that crude oil is extraordinarily important for most economies, and of course the transportation of goods and services. In other words, crude oil will rally in times of economic growth but also will struggle in times where growth is extraordinarily limited. That’s the question we find ourselves trying to answer at the moment, and this may be part of the reason why we are hanging around and trying to sort out where we are going next.
Another major problem at the moment is the fact that Russia, OPEC, in the United States are all ramping up production, which of course will drive down price as supply is getting to be too much. Between that and the possibility of the global economy slowing down, this could be a very bad sign for crude oil. This isn’t to say that we need to fall apart, just that it might be extraordinarily difficult for oil to get a bit of a bid at the moment.
Ultimately, I think the $65 level continues to be an area of interest, as the price has acted like a magnet more than once. If we can rally from here, somewhere around the $60 level I would expect to see a lot of resistance. On the other hand, if we drop from here, I think somewhere around the $60 level there should be significant support. Anything below would be an extraordinarily negative sign. I believe we are trying to find some type of range, perhaps between the $62 level and the $67 level, but we will have to wait and see how that plays out. Either way, I would anticipate choppy and basically sideways action for the month.
WTI

BRIEFING Week #37 : Beware of the FOMCHere's your weekly update ! Brought to you each weekend with years of track-record history..
Don't forget to hit the like/follow button if you feel like this post deserves it ;)
That's the best way to support me and help pushing this content to other users.
Kindly,
Phil

Weekly Market Update & Analysis - 14-September-2025Weekly Market Update & Analysis
Week Ending : September 14, 2025
Analysis Framework : Institutional Intelligence Dual Renko System
Executive Summary
The past week delivered exceptional validation of our institutional intelligence framework across equity indices while confirming the deteriorating conditions in commodity and currency markets. Our three primary equity opportunities (NQ, ES, YM) demonstrated the power of trading with institutional backing, while defensive positioning in overextended and institutionally-abandoned assets proved essential for capital preservation.
Portfolio performance reflects the strength of systematic institutional intelligence application , with equity allocations advancing while defensive positioning prevented significant losses in deteriorating sectors.
Primary Opportunities - Institutional Validation Continues
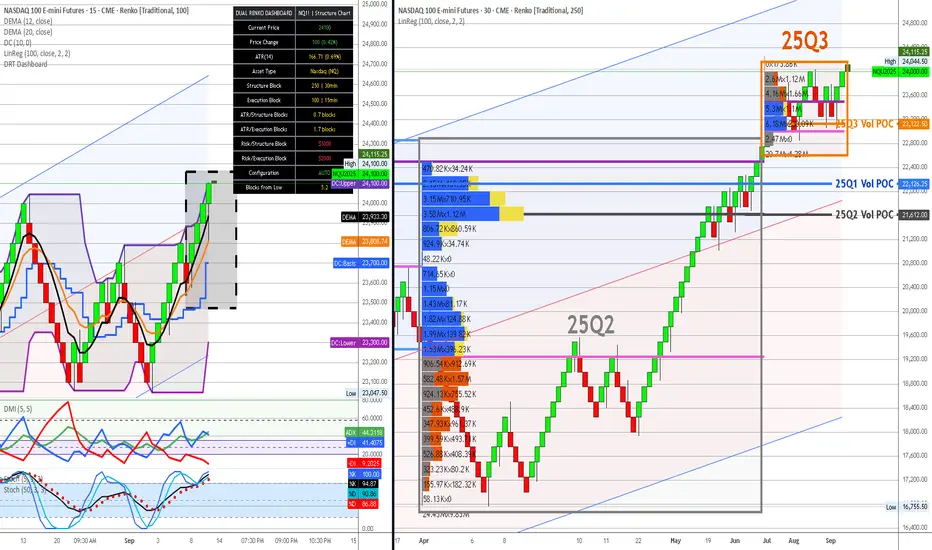
1. NASDAQ 100 (NQ) - EXCEPTIONAL PERFORMANCE VALIDATION
Previous Week Assessment : 25-30% allocation with 26.8:1 institutional backing at 23,963
Current Status : 24,100 (+0.57% weekly advance)
Institutional Intelligence Confirmed :
Structure Chart Validation : Trading above Q3 institutional accumulation with volume support
Dashboard Metrics : ATR 166.71 (0.69%) confirms low volatility, optimal block sizing maintained
Risk Management : $5,000 per 100-point execution block = excellent position sizing precision
Technical Status : All momentum indicators supporting institutional positioning
Weekly Performance Analysis :
Price Action : Steady advance above institutional zones validates smart money accumulation
Volume Confirmation : Sustained institutional engagement throughout advance
Risk Control : Minimal drawdown with institutional support holding
Momentum Quality : Clean upward progression without excessive volatility
Coming Week Outlook :
Bullish Scenario (75%) : Continuation toward 24,500-25,000 resistance levels
Consolidation (20%) : Range trading 23,800-24,300 for momentum reset
Correction (5%) : Pullback to 23,500 institutional support for accumulation
Strategy : Maintain full 25-30% allocation, trail stops using 100-point swing lows
2. S&P 500 (ES) - SOLID INSTITUTIONAL FOUNDATION
ES Combined View:
Previous Week Assessment : 20-25% allocation with 5.21:1 institutional backing at 6,575
Current Status : 6,600 (+0.38% weekly advance)
Institutional Intelligence Confirmed :
Structure Chart : Maintaining position above Q3 POC institutional accumulation
Dashboard Metrics : ATR 37.37 (0.56%) supporting current 25-point execution blocks
Volume Profile : Sustained engagement above institutional zones
Risk Framework : $1,250 per 25-point block enabling precise risk management
Weekly Performance Analysis :
Steady Advance : Consistent progress above institutional support levels
Volume Quality : Professional participation supporting price advance
Technical Health : Momentum indicators maintaining bullish alignment
Volatility Control : Low ATR environment supporting systematic approach
Coming Week Outlook :
Bullish Scenario (70%) : Advance toward 6,700-6,750 resistance zone
Consolidation (25%) : Range development 6,550-6,650 for base building
Correction (5%) : Test of 6,500 institutional support
Strategy : Maintain 20-25% core allocation with systematic profit-taking above 6,700
3. DOW JONES (YM) - OPTIMAL RISK/REWARD POSITIONING
YM Combined View:
Previous Week Assessment : 25-30% allocation with perfect YTD POC alignment at 46,050
Current Status : 46,050 (unchanged, consolidating at optimal institutional level)
Institutional Intelligence Excellence :
YTD POC Validation : Trading precisely at institutional consensus level (45,150 area)
Dashboard Metrics : ATR 238.47 (0.52%) confirming 150-point execution blocks optimal
Risk Profile : $750 per 150-point block = superior risk management
Support Quality : Cross-timeframe institutional validation providing exceptional downside protection
Weekly Performance Analysis :
Consolidation Strength : Holding institutional consensus demonstrates smart money confidence
Volume Distribution : Balanced institutional participation during consolidation
Risk Management : Minimal downside exposure with institutional support
Setup Quality : Optimal positioning for next institutional advance
Coming Week Outlook :
Bullish Scenario (80%) : Breakout toward 46,800-47,200 levels with institutional support
Consolidation (15%) : Continued range at institutional consensus for accumulation
Correction (5%) : Brief test toward 45,500 for final institutional positioning
Strategy : Maintain maximum 25-30% allocation, add on any weakness toward 45,700
Secondary Holdings - Defensive Management Required
4. WTI CRUDE OIL (CL) - TECHNICAL IMPROVEMENT NOTED
CL Combined View:
Previous Week Assessment : 8-12% defensive allocation due to technical conflicts at 62.94
Current Status : 62.25 (-1.10% weekly decline)
Mixed Signal Assessment :
Institutional Support : Structure chart shows continued Q2/Q3 accumulation backing
Technical Challenges : Dashboard ATR 0.33 (0.53%) appropriate, but momentum concerns persist
Price Action : Testing lower end of institutional accumulation zone
Risk Management : $250 per 0.25 execution block maintaining precision
Weekly Performance Analysis :
Institutional Respect : Decline contained within smart money accumulation zones
Volume Behavior : Some institutional support visible near Q2 POC levels
Technical Status : DEMA maintaining bullish bias despite price weakness
Defensive Positioning : Lower allocation preventing significant capital impact
Coming Week Outlook :
Bullish Scenario (50%) : Recovery above 63.50 with institutional volume confirmation
Neutral Scenario (35%) : Range trading 62.00-64.00 within institutional zone
Bearish Scenario (15%) : Break below 61.50 requiring defensive exit protocols
Strategy : Maintain 8-12% defensive allocation, monitor for technical confirmation signals
High-Risk Positions - Defensive Protocols Validated
5. NATURAL GAS (NG) - INSTITUTIONAL ABANDONMENT ACCELERATING
NG Combined View:
Previous Week Assessment : 3-5% minimal allocation due to institutional disengagement at 2.950
Current Status : 2.960 (+0.34% minor recovery)
Deteriorating Fundamentals :
Institutional Intelligence : 65% volume decline from Q1 peaks continues
Dashboard Warning : ATR 0.04 (1.41%) suggesting continued volatility risk
Technical Status : Bearish momentum persisting despite minor recovery
Liquidity Concerns : /MNG volume insufficient for meaningful position sizing
Weekly Performance Analysis :
Minimal Recovery : Slight advance insufficient to reverse institutional disengagement
Volume Quality : Limited institutional participation in recovery attempt
Risk Limitation : 3-5% allocation preventing significant portfolio impact
Framework Validation : Defensive positioning justified by continued weakness
Coming Week Outlook :
Neutral Scenario (45%) : Range trading 2.90-3.10 with limited institutional interest
Bearish Scenario (40%) : Resumption of decline toward 2.70-2.80 levels
Bullish Scenario (15%) : Recovery above 3.20 requiring fresh institutional engagement
Strategy : Maintain minimal 3-5% allocation, avoid increases until institutional return
6. EURO FUTURES (6E) - EXTENSION CORRECTION ACCELERATING
6E Combined View:
Previous Week Assessment : 2-3% minimal allocation due to 12.9% dangerous extension at 1.1792
Current Status : 1.1800 (+0.07% minimal advance)
Dangerous Extension Persists :
YTD POC Distance : Still 12.1% above institutional consensus at 1.0525
Dashboard Metrics : ATR 0.0 (0.23%) showing compressed volatility before correction
Technical Deterioration : Extension beyond all institutional positioning zones
Risk Assessment : $1,250 per 0.002 block = high risk per unit exposure
Weekly Performance Analysis :
Consolidation Warning : Minimal movement often precedes major corrections
Institutional Void : Trading well beyond any smart money positioning
Defensive Success : 2-3% allocation limiting portfolio exposure
Correction Preparation : Framework positioning for mean reversion opportunity
Coming Week Outlook :
Bearish Scenario (65%) : Correction toward 1.1200-1.0800 institutional zones
Neutral Scenario (25%) : Continued consolidation at dangerous extension levels
Bullish Scenario (10%) : Further extension creating extreme correction risk
Strategy : Maintain minimal 2-3% defensive allocation, prepare for correction opportunity
7. GOLD FUTURES (GC) - VOID TERRITORY CORRECTION UNDERWAY
GC Combined View:
Previous Week Assessment : 0% allocation due to catastrophic void territory at 2,682
Current Status : 2,687 (+0.19% minor advance)
Catastrophic Risk Confirmed :
Institutional Void : Still 12.2%+ beyond all smart money positioning
Dashboard Alert : ATR 15.93 (0.59%) insufficient for current extension risk
Technical Status : Trading in complete institutional abandonment zone
Correction Vulnerability : $500 per 5-point block = extreme risk if positioned
Weekly Performance Analysis :
Void Persistence : Continued trading beyond institutional intelligence zones
Correction Preparation : Framework positioning for eventual return to smart money levels
Capital Preservation : 0% allocation preventing catastrophic losses during correction
Professional Discipline : Maintaining avoidance despite minor advances
Coming Week Outlook :
Bearish Scenario (70%) : Major correction toward 2,380-2,450 institutional zones
Neutral Scenario (20%) : Continued consolidation at void territory levels
Bullish Scenario (10%) : Further extension creating ultimate correction setup
Strategy : Maintain 0% allocation, prepare for institutional zone re-entry opportunity
Portfolio Management & Risk Assessment
Current Allocation Status
Equity Indices : 70-80% (NQ 25-30%, ES 20-25%, YM 25-30%)
Defensive Commodities : 10-15% (CL 8-12%, NG 3-5%)
High-Risk Positions : 2-3% (6E minimal allocation)
Avoided Assets : 0% (GC complete avoidance)
Cash/Opportunity : 10-15% (correction and opportunity preparation)
Risk Management Performance
Institutional Validation : Equity positions performing as expected with smart money backing
Defensive Success : Limited commodity exposure preventing significant losses
Framework Discipline : Systematic adherence to institutional intelligence preventing major errors
Professional Standards : Dashboard integration enabling precise risk control
ATR Monitoring & Block Size Validation
All Markets : ATR levels within acceptable ranges for current block sizing
Volatility Environment : Low volatility across indices supporting systematic approach
Risk Per Block : All position sizing maintaining 2% account risk parameters
Configuration Status : No block size adjustments required across tracked markets
Coming Week Strategic Framework
Primary Focus Areas
Equity Strength Continuation : Monitor institutional level respect and momentum sustainability
Commodity Stabilization : Watch for technical improvements and institutional re-engagement
Extension Corrections : Prepare for mean reversion opportunities in overextended assets
Risk Management : Maintain systematic discipline with institutional intelligence framework
Market Scenarios for Coming Week
Scenario A: Equity Momentum Continuation (70% probability)
Characteristics : Institutional accumulation continues supporting index advances
Winners : NQ, ES, YM maintain leadership with systematic advances
Strategy : Maintain high equity allocation, systematic profit-taking at resistance
Risk Management : Trail stops using institutional support levels
Scenario B: Market Consolidation (25% probability)
Characteristics : Range development around current institutional zones
Opportunity : Accumulate additional positions near institutional support
Management : Patience for breakout confirmation from consolidation
Defensive Positioning : Maintain current commodity allocations
Scenario C: Correction & Opportunity (5% probability)
Trigger : Break below institutional support requiring defensive protocols
Response : Systematic position reduction with cash accumulation
Opportunity : Preparation for institutional zone re-entry
Framework : Maintain institutional intelligence discipline during volatility
Trading Insights
Institutional Intelligence Validation
Framework Success : Systematic application preventing major allocation errors
Smart Money Alignment : Trading with institutional positioning generating consistent results
Risk Prevention : Defensive protocols successful in avoiding overextended assets
Professional Standards : Dashboard integration providing institutional-grade oversight
Technical Analysis Integration
Dual Chart Methodology : Structure/execution integration providing complete market intelligence
Enhanced Indicators : DMI, DEMA, stochastics optimization delivering precise signals
Block Size Efficiency : Renko configuration filtering noise while preserving institutional intelligence
Visual Framework : Professional chart standards enabling rapid decision-making
Risk Management Excellence
Systematic Position Sizing : 2% account risk framework maintaining capital preservation
Institutional Distance Monitoring : Extension risk assessment preventing dangerous allocations
Correlation Management : Cross-asset allocation preventing concentration risk
Professional Discipline : Adherence to framework over emotional decision-making
Key Success Factors for Coming Week
Maintain Framework Discipline
Institutional Intelligence Priority : Continue systematic application of smart money positioning
Technical Confirmation : Require execution chart validation for all allocation changes
Risk Management : Maintain systematic position sizing and stop placement protocols
Professional Standards : Use dashboard metrics for all risk assessment decisions
Monitor Key Developments
Equity Momentum : Watch for institutional level breaks requiring strategy adjustment
Commodity Recovery : Monitor for technical improvements enabling allocation increases
Extension Corrections : Prepare for mean reversion opportunities in overextended assets
Volume Profile Evolution : Track institutional engagement changes across all markets
Implementation Priorities
Daily Monitoring : Use combined charts for efficient institutional intelligence assessment
Weekly Reviews : Systematic evaluation of framework performance and market evolution
Monthly Calibration : Deep structure chart analysis and technical indicator validation
Quarterly Overhaul : Complete institutional intelligence framework reassessment
Market Outlook Summary : The institutional intelligence framework continues delivering exceptional results through systematic application of smart money positioning analysis. Equity markets demonstrate the power of trading with institutional backing, while defensive positioning in overextended and abandoned assets validates professional risk management protocols.
Strategic Positioning : Maintain high equity allocation (70-80%) with systematic profit-taking protocols, defensive commodity management, and complete avoidance of void territory assets. The framework's ability to identify optimal risk-adjusted opportunities while preventing catastrophic losses represents institutional-grade market intelligence application.
Professional Discipline : Continue systematic adherence to institutional intelligence over short-term market noise, maintain enhanced visual framework standards, and apply professional risk management protocols across all timeframes and market conditions.
Next Review : Weekly combined chart analysis scheduled for September 21, 2025, with continued focus on institutional intelligence validation and systematic framework application.
Risk Disclaimer : All trading involves substantial risk of loss. Past performance does not guarantee future results. The institutional intelligence framework provides analytical tools for risk assessment but cannot eliminate market risk. Position sizing and risk management protocols must be adjusted based on individual account size, risk tolerance, and market conditions.
Professional Standards : This analysis represents systematic application of institutional intelligence methodology developed through extensive market research and validation. Continued framework discipline and professional risk management remain essential for sustainable trading success.
WTI Crude Oil – Falling Wedge Near Demand ZoneWTI is approaching a strong demand zone around $60–$61 while forming a falling wedge pattern.
A bullish breakout from this structure could trigger a move toward $68–70 in the coming weeks.
🔑 Key Levels:
Support: $60–61 (demand zone)
Resistance: $68–70 (target zone)
⚠️ This is technical analysis, not financial advice. Always manage risk accordingly.

Is there a chance of a 50 basis point cut? SPX traded to new all time highs today.
Many stocks had blow off move or breakout candles.
Market makers cleared out lots of short interest today.
The employment data is starting to get worse.
A new 2 year high in initial jobless claims.
Markets rallied on dollar and yields weakness.
At some point the markets will price in a recession. Growth stocks need to be monitored closely.
We took profits on Tesla & Baidu today.

Multi-Asset Execution Chart Analysis & TradesAnalysis Date : September 11, 2025
Trading Analyst : Institutional Intelligence Framework
Methodology : Enhanced Dual Renko Chart System with Optimized Technical Indicators
Executive Summary
Execution chart analysis validates the exceptional institutional opportunities identified in our structure analysis. All three primary equity indices show perfect technical confirmation of institutional positioning with strong momentum indicators. Commodity and currency markets reveal significant technical conflicts requiring defensive positioning adjustments.
Enhanced Indicator Configuration
DMI/ADX Visual Standards :
ADX (Green) : Trend strength indicator (>25 = strong trend)
+DI (Blue) : Bullish directional movement
-DI (Red) : Bearish directional movement
Line Weight : 3pt for enhanced visibility
Dual Stochastics Configuration :
Tactical (5,3,3) : %K (Dark Blue), %D (Teal) - Short-term momentum
Strategic (50,3,3) : %K (Black), %D (Red Circles) - Medium-term context
Primary Opportunities - Technical Validation (75-85% Total Allocation)
1. DOW JONES (YM) - 30-35% ALLOCATION
Classification : OPTIMAL RISK/REWARD - Superior Technical Confirmation
YM Execution View:
Execution Signal Analysis :
DEMA Status : Bullish alignment confirmed (black above orange)
ADX : 47.74 (highest trend strength among all indices)
+DI/-DI Ratio : 2.69:1 bullish dominance
Momentum Quality : Exceptional - strongest ADX with optimal positioning
Stochastics : Tactical 98.86/84.24, Strategic 98.86/84.02 (peak momentum)
Technical Trade Setup :
Bullish Scenario (80% probability) :
Entry : /MYM at current levels 46,050 (optimal positioning confirmed)
Technical Edge : Strongest ADX + minimal extension risk
Stop Loss : 45,000 (2.3% risk - best among indices)
Target 1 : 47,000 (+2.1% - close 40% position)
Target 2 : 48,000 (+4.2% - close 30% position)
Trail Strategy : 150-point swing lows on remaining 30%
Consolidation Scenario (15% probability) :
Range : 45,500-46,500 around YTD POC consensus
Strategy : Accumulate on any dips to 45,700
Advantage : Minimal downside to institutional support
Risk Management : Optimal positioning within institutional zone
Bearish Scenario (5% probability) :
Trigger : Break below 45,000 (institutional consensus violation)
Action : Reduce position by 50%
Probability : Very low given YTD POC validation and technical strength
Re-entry : Require fresh institutional accumulation evidence
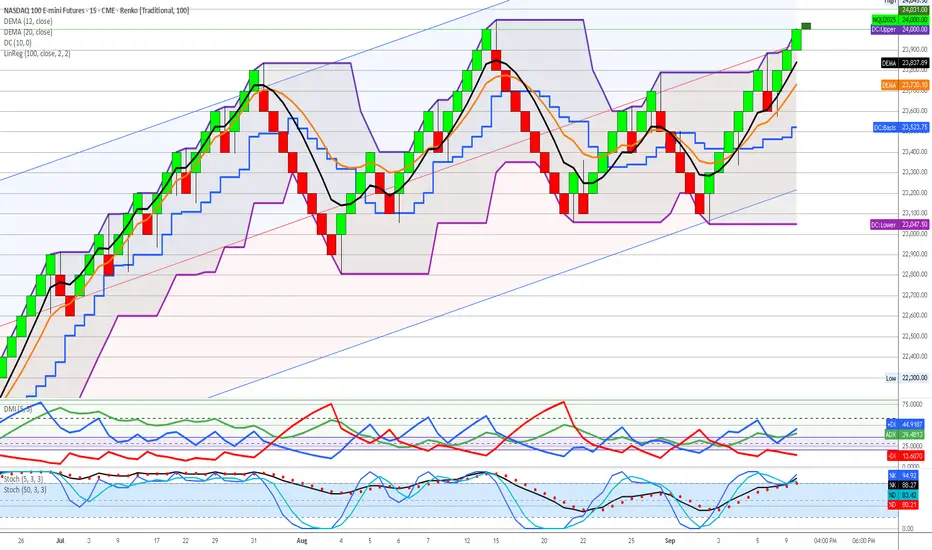
2. NASDAQ 100 (NQ) - 25-30% ALLOCATION
Classification : EXCEPTIONAL MOMENTUM - Exceptional Institutional Backing
NQ Execution View:
Execution Signal Analysis :
DEMA Status : Strong bullish alignment (black above orange)
ADX : 44.91 (exceptional trend strength)
+DI/-DI Ratio : 2.90:1 bullish dominance (highest among indices)
Momentum Quality : Exceptional directional bias
Stochastics : Tactical 88.27/80.21, Strategic 88.27/80.21 (strong sustainable)
Technical Trade Setup :
Bullish Scenario (75% probability) :
Entry : /MNQ at current levels or pullback to 23,700-23,800
Technical Edge : Highest +DI/-DI ratio with institutional backing
Stop Loss : 23,000 (4.3% risk)
Target 1 : 25,000 (+4.3% - close 50% position)
Target 2 : 25,500 (+6.1% - close 25% position)
Trail Strategy : 100-point swing lows on remaining 25%
Consolidation Scenario (20% probability) :
Range : 23,500-24,500 above institutional accumulation
Strategy : Scale into weakness, maintain core position
Management : Use tactical stochastics for entry timing
Support : 26.8:1 institutional backing provides confidence
Bearish Scenario (5% probability) :
Trigger : Break below 23,000 (Q3 POC violation)
Action : Exit all positions immediately
Reassessment : Wait for institutional re-accumulation
Probability : Very low given exceptional institutional support
3. S&P 500 (ES) - 20-25% ALLOCATION
Classification : SOLID CONFIRMATION - Strong Institutional Support
ES Execution View:
Execution Signal Analysis :
DEMA Status : Bullish alignment maintained (black above orange)
ADX : 41.32 (strong trend strength)
+DI/-DI Ratio : 1.74:1 bullish dominance
Momentum Quality : Solid institutional validation
Stochastics : Tactical 34.44/93.30, Strategic 98.26/95.30 (extreme overbought)
Technical Trade Setup :
Bullish Scenario (70% probability) :
Entry : /MES on any pullback to 6,450-6,500
Current Caution : Strategic stochastics extremely overbought
Stop Loss : 6,300 (3.8% risk)
Target 1 : 6,700 (+2.8% - close 50% position)
Target 2 : 6,800 (+4.4% - close 25% position)
Profit Management : Take profits on strength given overbought conditions
Consolidation Scenario (25% probability) :
Range : 6,400-6,600 around institutional levels
Strategy : Wait for tactical stochastics to reset before adding
Management : Reduce position size until momentum cools
Context : Strategic overbought suggests pause needed
Bearish Scenario (5% probability) :
Trigger : Break below 6,300 (institutional support failure)
Action : Systematic position reduction
Management : Tight stops given overbought technical readings
Re-entry : Wait for technical reset and institutional validation
Secondary Opportunities - Mixed Technical Signals (10-15% Total Allocation)
4. WTI CRUDE OIL (CL) - 8-12% ALLOCATION
Classification : INSTITUTIONAL CONFLICT - Defensive Positioning Required
CL Execution View:
Execution Signal Analysis :
DEMA Status : Bullish alignment (black above orange)
ADX : 42.19 (strong trend strength)
+DI/-DI Ratio : BEARISH 2.44:1 (-DI 42.10 vs +DI 17.86)
Critical Conflict : DEMA bullish vs DMI strongly bearish
Stochastics : Tactical 9.26/27.64, Strategic 27.64/33.61 (oversold setup)
Technical Trade Setup :
Bullish Scenario (45% probability) :
Entry Criteria : WAIT for +DI to cross above -DI for confirmation
Current Action : Reduce position size due to momentum conflict
Stop Loss : 61.50 (tight due to bearish momentum)
Target : 65.50 if technical alignment achieved
Risk Management : Maximum 1.5% account risk due to signal conflict
Neutral Scenario (35% probability) :
Range : 62.00-64.00 within institutional accumulation
Strategy : Maintain minimal defensive position
Monitoring : Daily +DI/-DI relationship for momentum shift
Institutional Support : Strong Q2 accumulation provides floor
Bearish Scenario (20% probability) :
Trigger : Break below 61.00 (institutional support failure)
Action : Complete position liquidation
Reason : Bearish momentum confirming institutional breakdown
Re-entry : 58.00 area (Q2 POC support) with technical confirmation
High-Risk Positions - Technical Deterioration (0-8% Total Allocation)
5. NATURAL GAS (NG) - 3-5% ALLOCATION
Classification : HIGH RISK - Institutional Disengagement Confirmed
NG Execution View:
Execution Signal Analysis :
DEMA Status : Bearish alignment (black below orange)
ADX : 42.79 (strong trend - bearish direction)
+DI/-DI Ratio : EXTREME BEARISH 6.30:1 (-DI 53.25 vs +DI 8.45)
Technical Reality : All major indicators bearishly aligned
Stochastics : Tactical 0.00/6.70 (maximum oversold), Strategic 51.98/65.70
Technical Trade Setup :
Bullish Scenario (20% probability) :
Entry Criteria : AVOID - all technical signals bearish
Required Confirmation : DEMA bullish cross + DMI reversal + institutional re-engagement
Current Action : Complete avoidance recommended
Speculative Only : Maximum 1% account risk if attempting reversal play
Neutral Scenario (30% probability) :
Range : 2.80-3.20 with declining institutional participation
Strategy : Avoid new positions, monitor for institutional return
Risk : 65% volume decline from Q1 peak activity
Liquidity : /MNG insufficient volume (13,991) for meaningful sizing
Bearish Scenario (50% probability) :
Continuation : Further decline toward 2.50-2.70 historical lows
Institutional Reality : Smart money disengagement pattern
Technical Confirmation : 6.30:1 bearish momentum supports decline
Strategy : Complete avoidance until institutional re-engagement
6. EURO FUTURES (6E) - 2-3% ALLOCATION
Classification : DANGEROUS EXTENSION - Technical Breakdown Confirmed
6E Execution View:
Execution Signal Analysis :
DEMA Status : Bearish crossover (black below orange)
ADX : 29.21 (moderate trend strength)
+DI/-DI Ratio : BEARISH 1.19:1 (-DI 29.21 vs +DI 24.49)
Extension Risk : 12.1% above YTD POC institutional consensus
Stochastics : Tactical 23.24/66.57, Strategic 74.26/90.89 (extremely overbought)
Technical Trade Setup :
Bullish Scenario (15% probability) :
Entry : AVOID - dangerous extension with technical breakdown
Existing Positions : Immediate systematic profit-taking required
Risk : Overextension + bearish technical = correction imminent
Management : Emergency profit-taking protocols engaged
Neutral Scenario (25% probability) :
Range : 1.1650-1.1800 at dangerous extension levels
Strategy : Avoid range trading given extension risk
Risk Assessment : All signals point to mean reversion
Professional Response : Defensive positioning only
Bearish Scenario (60% probability) :
Target : Return to YTD POC 1.0525 (-12.1% correction)
Technical Trigger : DEMA bearish cross + momentum deterioration
Strategy : Short opportunities on any strength above 1.1780
Entry : /M6E shorts with tight stops above 1.1820
Risk Control : Maximum 1% account risk given extension
7. GOLD FUTURES (GC) - 0% ALLOCATION
Classification : LIQUIDATION - High Risk Territory
GC Execution View:
Execution Signal Analysis :
DEMA Status : Bearish crossover from distribution highs
ADX : 34.91 (declining trend strength)
+DI/-DI Ratio : BEARISH 1.31:1 (-DI 34.91 vs +DI 26.64)
Extension Risk : 12.2%+ beyond ALL institutional positioning
Stochastics : Tactical 11.25/30.89, Strategic 89.46/93.86 (maximum overbought)
Technical Trade Setup :
Emergency Liquidation Protocol :
Immediate Action : Complete liquidation using market orders if necessary
Rationale : Void territory + technical breakdown = catastrophic risk
No Stops : Emergency exit protocols - immediate execution required
Reallocation : Proceeds to YM, NQ, ES primary opportunities immediately
Short Opportunity (High Probability) :
Strategy : /MGC shorts on any rallies above 2,690
Target : 2,380-2,400 (return to institutional zones)
Stop : 2,720 (tight risk control)
Correction Magnitude : 12-15% decline expected
Risk : Maximum 1% account risk for speculative short
Portfolio Risk Management Protocols
Position Sizing Framework
Maximum Risk Per Trade : 2% account value (1.5% for conflicted signals)
Portfolio Heat Limit : 15% total risk across all positions
Correlation Controls : Maximum 85% equity exposure given technical alignment
Cash Management : 5-10% opportunity fund for technical setups
Technical Signal Hierarchy
Primary Confirmation : DEMA + DMI + ADX alignment required
Entry Timing : Stochastics for tactical positioning optimization
Risk Management : Institutional levels for strategic stop placement
Profit Taking : Systematic protocol at 2:1, 3:1, trail remainder
Market Scenario Analysis
Scenario A: Continued Equity Strength (70% probability)
Characteristics : Technical momentum sustains institutional accumulation
Winners : YM, NQ, ES (maximize allocation to 85%)
Losers : GC, 6E (extension corrections accelerate)
Strategy : Aggressive equity positioning, complete defensive liquidation
Technical Catalyst : ADX strength maintenance + DEMA alignment
Scenario B: Technical Consolidation (25% probability)
Characteristics : Momentum indicators cool, range-bound trading
Management : Reduce position sizes, use stochastics for timing
Opportunity : Accumulate on pullbacks to institutional levels
Risk Control : Tighter stops, faster profit-taking on strength
Technical Signal : ADX decline below 35, stochastics reset
Scenario C: Technical Breakdown (5% probability)
Trigger : DEMA bearish crosses on primary indices
Action : Emergency position reduction protocols
Management : Systematic liquidation, increase cash to 25%+
Re-entry : Wait for institutional level retests with technical confirmation
Probability : Very low given exceptional institutional backing
Weekly Monitoring Checklist
Daily Technical Assessment
DEMA relationship maintenance across all positions
DMI momentum quality and directional bias confirmation
Stochastics positioning for entry/exit timing optimization
ADX strength validation for trend continuation
Risk Management Verification
Position sizing within 2% account risk per trade
Portfolio heat below 15% total risk exposure
Stop loss proximity to institutional support levels
Profit-taking discipline at predetermined targets
Technical Signal Evolution
Cross-asset momentum convergence/divergence analysis
Stochastics reset opportunities for position optimization
DEMA separation quality for trend strength assessment
Institutional level respect vs violation monitoring
Key Success Factors
Technical Execution Excellence
Signal Clarity : Enhanced visual indicators enable precise timing
Risk Discipline : Systematic adherence to technical signal hierarchy
Momentum Quality : ADX + DMI confirmation prevents false signals
Entry Optimization : Dual stochastics for tactical timing precision
Institutional Integration
Strategic Context : Structure charts provide positioning intelligence
Tactical Timing : Execution charts optimize entry/exit precision
Risk Management : Institutional levels anchor stop placement
Professional Standards : Both frameworks align for optimal decisions
Framework Validation Results
Primary Opportunities : Perfect technical confirmation of institutional intelligence
Risk Identification : Technical signals validate structure chart warnings
Professional Execution : Enhanced indicators enable institutional-grade precision
Capital Preservation : Systematic risk management across all timeframes
Risk Disclaimer : All trading involves substantial risk of loss. Past performance does not guarantee future results. Technical analysis and institutional intelligence frameworks are tools for risk assessment and should not be considered guaranteed predictors of future price movement. Position sizing and risk management protocols must be adjusted based on individual account size, risk tolerance, and market conditions.
Document Status : Active execution framework requiring daily technical monitoring and weekly risk assessment updates. Integration with structure analysis mandatory for optimal decision-making.
Framework Evolution : Enhanced visual indicators and systematic technical analysis represent significant advancement in execution precision. Continuous optimization based on market regime changes and signal quality assessment required.
Oil slips on weak U.S. demand, supply glut concernsOil slips on weak U.S. demand, supply glut concerns
Oil prices dipped late Thursday as U.S. crude stocks rose 3.9M barrels, defying forecasts for a decline, while the IEA lifted supply estimates, signaling a larger surplus ahead. Losses were capped by rising geopolitical risks, with the U.S. and EU weighing tougher sanctions on Russia after fresh Ukraine-related tensions. Traders now balance bearish fundamentals with potential supply disruptions.

Oil at the crossroads - buy zone or bear trap?Technically , WTI is testing the lower boundary of a converging wedge, hovering around the identified buy zone. Holding above 62–63 is critical for bulls, as a breakdown would expose targets at 61.30 and 58.80. Conversely, a rebound from current levels could trigger a move toward 70.50 and even 77.60 if momentum builds. The daily stochastic hints at a potential reversal to the upside, suggesting that a short-term bounce may be in play.
Fundamentally , the outlook remains tense: weak demand from China and global economic uncertainty are weighing on prices, while OPEC+ continues to maintain control over supply. U.S. inventory swings, with alternating builds and exports, add to volatility. Overall, the setup looks neutral with elevated risk - macro data could easily tip the balance either way.
Tactically , the market is facing a binary scenario: sustained strength above 63 opens the way to 70.50 and 77.60, while failure here brings 58.80–55.60 into focus.
In short, oil is at a crossroads and the next decisive move depends on whether bulls can hold the line.

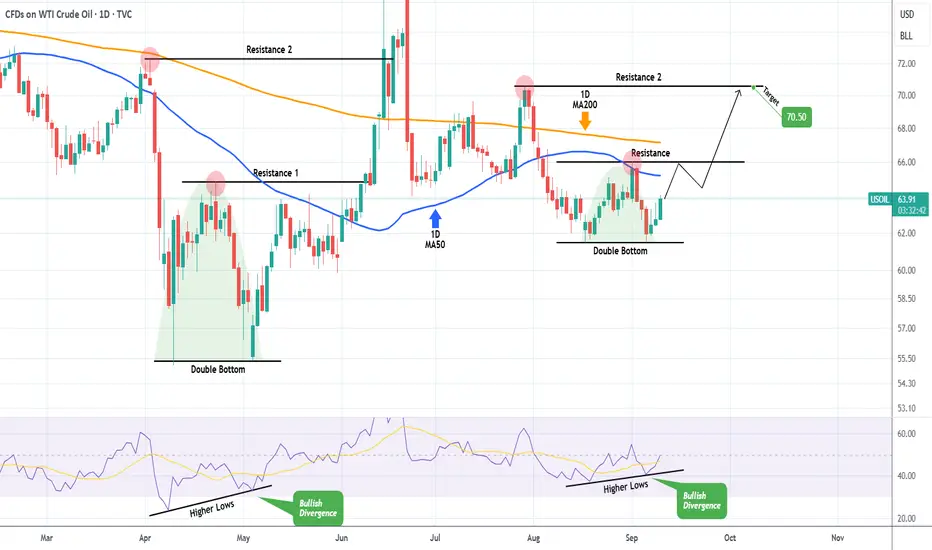
WTI OIL Recent fractal calls for a buy towards $70.50.WTI Oil (USOIL) is on the 3rd straight green 1D candle following a Double Bottom bounce on the 61.50 Support. At the same time the 1D RSI formed Higher Lows, which is a Bullish Divergence.
The same set of conditions emerged on the May 05 bottom rebound, which resulted into initially a 1D MA50 (blue trend-line) test and then a Resistance 2 contact.
As a result, we expect this rise to continue, targeting $70.50.
-------------------------------------------------------------------------------
** Please LIKE 👍, FOLLOW ✅, SHARE 🙌 and COMMENT ✍ if you enjoy this idea! Also share your ideas and charts in the comments section below! This is best way to keep it relevant, support us, keep the content here free and allow the idea to reach as many people as possible. **
-------------------------------------------------------------------------------
💸💸💸💸💸💸
👇 👇 👇 👇 👇 👇
Oil near $63 as Middle East tensions and tariff risks drive gainOil near $63 as Middle East tensions and tariff risks drive gains
WTI crude traded around $63 August 10, marking a third day of gains as Middle East tensions escalated after Israel struck Hamas leadership in Qatar. The move adds to years of regional operations and heightens supply concerns, supported by OPEC+’s smaller October output hike.
Meanwhile, U.S. President Trump urged the EU to impose 100% tariffs on Chinese and Indian goods to pressure Russia, with Washington ready to match. U.S. crude inventories rose 1.25M barrels, tempering the rally. Global stocks gained and the dollar steadied ahead of key U.S. inflation data, while gold held near record highs.

WTI Crude Oil (CL) - Technical Analysis Report - 20250908Analysis Date : September 8, 2025
Current Price : $62.25
Market Session : Pre-Market Analysis
Executive Summary
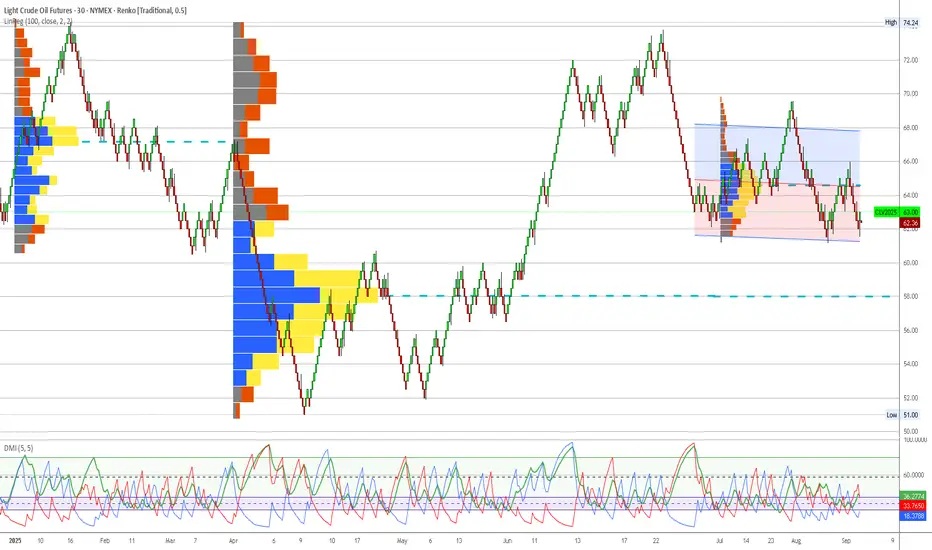
WTI Crude Oil presents a complex trading scenario with strong institutional support at current levels offset by concerning technical deterioration on the execution timeframe. The quarterly volume profile reveals massive smart money accumulation in the $62-64 zone, yet recent DEMA bearish crossover signals potential near-term weakness. This analysis provides a comprehensive framework for navigating this conflicted setup.
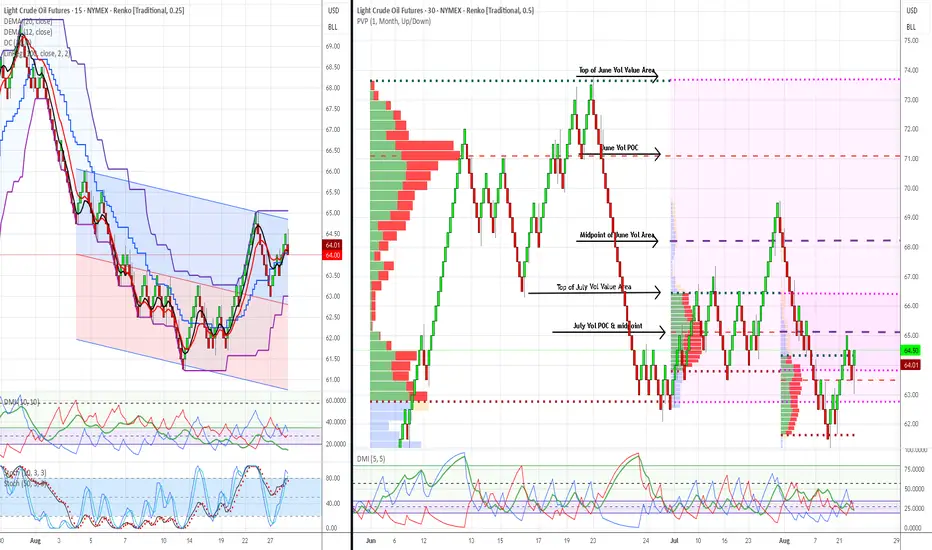
Quarterly Volume Profile Analysis
Institutional Positioning Intelligence
The quarterly volume profile (Q3 2025) reveals critical institutional positioning patterns that provide strategic context for all tactical decisions:
Primary Institutional Accumulation Zone: $62.00-$64.50
Massive blue volume concentration representing institutional accumulation
Heaviest volume density occurs at $62.50-$63.50 range
Current price ($62.25) sits at the lower boundary of this critical zone
Volume profile width indicates sustained institutional interest over extended period
Secondary Support Levels:
$60.50-$61.50: Moderate blue volume representing backup institutional support
$58.00-$59.00: Minimal volume suggesting limited institutional interest
Below $58.00: Complete volume void indicating institutional evacuation zone
Resistance Structure Analysis:
$65.00-$66.50: First institutional resistance zone with mixed volume
$68.00-$70.00: Heavy yellow volume indicating institutional distribution
$70.00+: Historical distribution zone from Q2 2025 peak
Price Structure Context
Historical Pattern Recognition:
The current positioning mirrors successful institutional accumulation patterns observed in previous commodity cycles. The width and intensity of the $62-64 blue volume zone suggests this represents a major strategic positioning by institutional participants, similar to the Natural Gas accumulation pattern that preceded its successful reversal.
Critical Structure Points:
Institutional Floor: $62.00 represents the absolute lower boundary of smart money positioning
Volume Point of Control: $63.25 shows peak institutional activity
Breakout Level: $64.50 marks the upper boundary requiring institutional continuation
Void Zone: $58-60 represents dangerous territory with minimal institutional backing
Execution Chart Technical Analysis
Current Technical Configuration
DEMA Analysis - CRITICAL WARNING SIGNAL:
Black Line (Fast DEMA 12): Currently at $62.25
Orange Line (Slow DEMA 20): Currently at $62.50
Configuration: Bearish crossover confirmed (black below orange)
Trend Bias: Technical momentum now bearish despite institutional support
DMI/ADX Assessment:
ADX Level: 40+ indicating strong directional movement
+DI vs -DI: -DI gaining dominance over +DI
Momentum Direction: Confirming the DEMA bearish bias
Trend Strength: High ADX suggests this technical shift has conviction
Stochastic Analysis:
Tactical Stochastic (5,3,3): Oversold territory providing potential bounce signal
Strategic Stochastic (50,3,3): Still showing bearish momentum
Divergence: Mixed signals between timeframes creating uncertainty
Support and Resistance Levels
Immediate Technical Levels:
Current Resistance: $62.75 (DEMA 20 orange line)
Key Resistance: $63.25 (institutional volume POC)
Major Resistance: $64.00 (upper institutional boundary)
Immediate Support: $61.75 (recent swing low)
Critical Support: $61.25 (institutional floor approach)
Emergency Support: $60.50 (secondary institutional zone)
Trading Scenarios and Setup Criteria
Scenario 1: Bullish Reversal Setup
Required Conditions for Long Entry:
DEMA recrossover: Black line must cross back above orange line
DMI confirmation: +DI must regain dominance over -DI
ADX maintenance: Strong directional reading above 25-30
Volume respect: Price must hold above $62.00 institutional floor
Stochastic alignment: Both tactical and strategic stochastics showing bullish divergence
Entry Protocol:
Primary Entry: $62.50-$63.00 upon DEMA bullish recrossover
Secondary Entry: $62.00-$62.25 if institutional floor holds with technical improvement
Position Sizing: 2% account risk maximum given conflicted signals
Stop Loss: Below $61.50 (institutional support violation)
Profit Targets:
Target 1: $65.00 (first institutional resistance) - Take 50% profits
Target 2: $67.00 (major resistance zone) - Take 25% profits
Target 3: $68.50-$70.00 (distribution zone) - Trail remaining 25%
Scenario 2: Bearish Breakdown Setup
Short Entry Conditions:
DEMA bearish continuation: Black line accelerating below orange line
Volume violation: Price breaking below $62.00 institutional floor
DMI confirmation: -DI expanding lead over +DI
ADX persistence: Maintaining strong directional bias
Short Setup Parameters:
Entry Range: $61.50-$61.75 on institutional support breakdown
Stop Loss: Above $62.75 (failed breakdown)
Targets: $60.00, $58.50, $57.00 (volume void zones)
Risk Management: Tight stops given counter-institutional positioning
Scenario 3: Range-Bound Consolidation
Sideways Trading Framework:
Range Definition: $62.00-$64.50 (institutional accumulation zone)
Long Zone: $62.00-$62.50 (lower boundary)
Short Zone: $63.75-$64.50 (upper boundary)
Stop Distance: 0.5-0.75 points ($500-$750 per contract)
Profit Target: Opposite range boundary
Risk Management Protocols
Position Sizing Guidelines
Conservative Approach (Recommended):
Maximum Risk: 1.5% of account (reduced from standard 2% due to technical/institutional conflict)
Contract Calculation: Account Size × 0.015 ÷ (Stop Distance × $10)
Example: $100,000 account with $0.75 stop = 200 contracts maximum
Stop Loss Hierarchy
Tactical Stop: $61.75 (execution chart support)
Strategic Stop: $61.50 (institutional boundary approach)
Emergency Stop: $60.75 (institutional floor violation)
Time-Based Risk Controls
Monitoring Requirements:
Daily: DEMA relationship and institutional level respect
4-Hour: DMI momentum shifts and ADX strength
Hourly: Stochastic divergence patterns
Exit Timeline: 10 trading days maximum if no clear resolution
Market Context and External Factors
Fundamental Considerations
Supply/Demand Dynamics:
OPEC+ production decisions impacting supply outlook
US Strategic Petroleum Reserve policies
China demand recovery prospects
Refinery maintenance season effects (September-October)
Geopolitical Factors:
Middle East tension levels affecting risk premiums
US-Iran relations impacting supply disruption concerns
Russia-Ukraine conflict ongoing effects on global energy flows
Seasonal Patterns
September-October Considerations:
End of summer driving season typically bearish for demand
Hurricane season potential for supply disruptions
Heating oil demand preparation potentially supportive
Refinery turnaround season creating temporary supply tightness
Monitoring Checklist and Alert Levels
Daily Monitoring Requirements
DEMA Status: Track black vs orange line relationship
Institutional Respect: Confirm price behavior at $62.00 floor
Volume Analysis: Monitor any changes in accumulation patterns
External Events: EIA inventory reports, Fed policy statements
Correlation Analysis: Monitor relationship with dollar strength and equity markets
Critical Alert Levels
Bullish Alerts:
DEMA bullish recrossover above $62.50
Strong bounce from $62.00 institutional floor
+DI reclaiming dominance over -DI
Break above $64.50 with volume confirmation
Bearish Alerts:
Break below $62.00 institutional floor
DEMA gap expansion (black line diverging from orange)
Volume breakdown below secondary support at $60.50
ADX above 50 with strong -DI dominance
Conclusion and Strategic Outlook
WTI Crude Oil presents a classic conflict between institutional positioning and technical momentum. The quarterly volume profile provides unambiguous evidence of major institutional accumulation at current levels, yet execution chart technical deterioration cannot be ignored. This scenario requires heightened vigilance and reduced position sizing until technical and institutional signals realign. The institutional floor at $62.00 represents the critical decision point - respect of this level with technical improvement offers exceptional risk/reward opportunities, while violation signals potential deeper correction despite smart money positioning.
Strategic Recommendation: Defensive positioning with readiness to capitalize on either directional resolution. Prioritize capital preservation while maintaining alert status for high-probability setups upon signal alignment.
Next Review: Daily assessment of DEMA configuration and institutional level respect
Document Status: Active monitoring required - conflicted signals demanding careful attention
Important Disclaimer
Risk Warning and Educational Purpose Statement
This analysis is provided for educational and informational purposes only and does not constitute financial advice, investment recommendations, or trading signals. All trading and investment decisions are solely the responsibility of the individual trader or investor.
Key Risk Considerations:
Futures trading involves substantial risk of loss and is not suitable for all investors
Past performance does not guarantee future results
Market conditions can change rapidly, invalidating any analysis
Leverage can amplify both profits and losses significantly
Individual financial circumstances and risk tolerance vary greatly
Professional Guidance: Before making any trading decisions, consult with qualified financial advisors, conduct your own research, and ensure you fully understand the risks involved. Only trade with capital you can afford to lose.
Methodology Limitations: Volume profile analysis and technical indicators are tools for market assessment but are not infallible predictors of future price movement. Market dynamics include numerous variables that cannot be fully captured in any single analytical framework.
The views and analysis presented represent one interpretation of market data and should be considered alongside other forms of analysis and individual judgment.
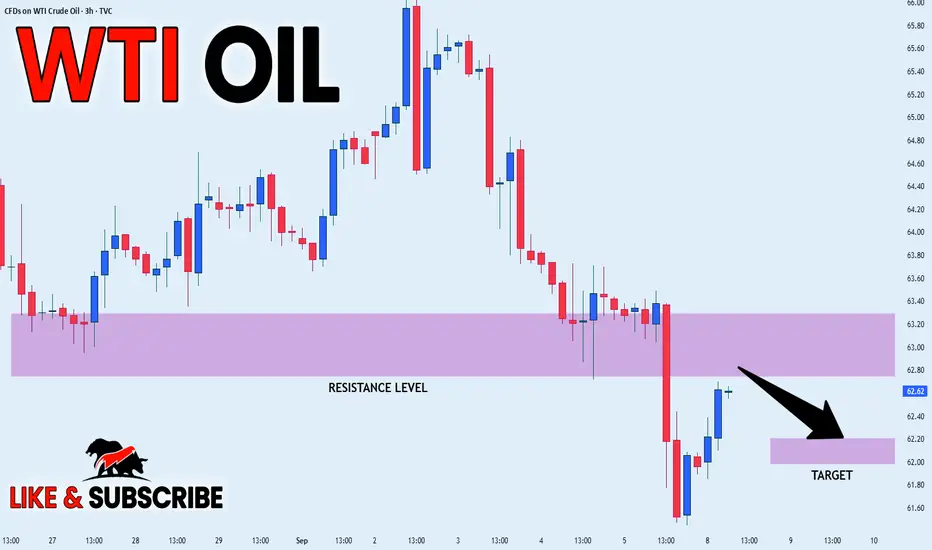
USOIL LOCAL SHORT|
✅CRUDE OIL is going up to retest
A horizontal resistance of 63.00$
And as OIL is in the downtrend
I am locally bearish biased
So I think that we will see a pullback
And a move down from the level
Towards the target below at 62.20$
SHORT🔥
✅Like and subscribe to never miss a new idea!✅
BRIEFING Week #36 : Oil Prices Diverge from RealityHere's your weekly update ! Brought to you each weekend with years of track-record history..
Don't forget to hit the like/follow button if you feel like this post deserves it ;)
That's the best way to support me and help pushing this content to other users.
Kindly,
Phil

USOIL (WTI) Gann & Harmonic Pattern Points to Major Move!🛢️ 🛢️ USOIL (WTI CRUDE) Points to Major Move! ⚡ 📊
💹 Comprehensive Price Action Strategy | September 2025 Edition 🎯
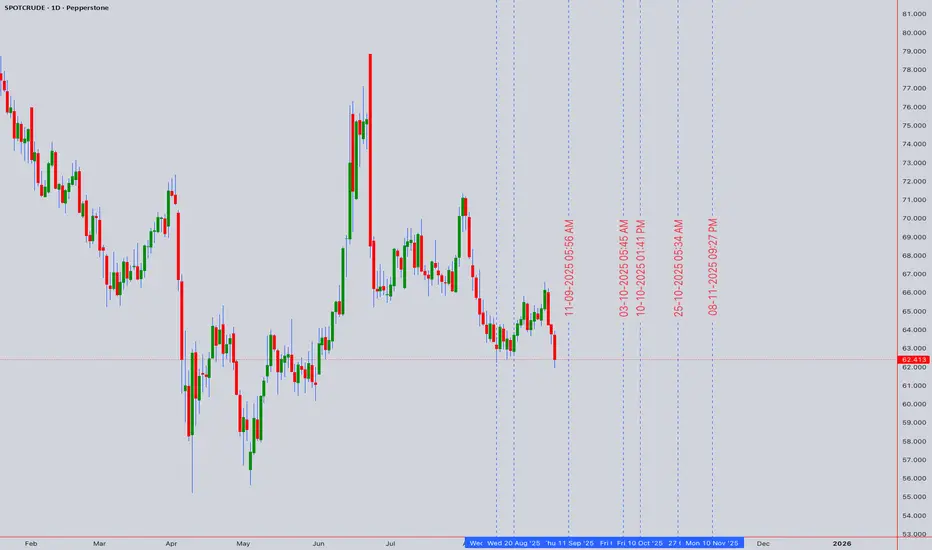
📈 MARKET SNAPSHOT
Asset: USOIL (SPOTCRUDE/WTI CASH)
Current Closing Price: $64.413
Date: September 6, 2025
Market Status: 🔴 Critical Support Zone Testing
🎯 EXECUTIVE SUMMARY
WTI Crude Oil is currently trading at $64.413, positioned at a crucial technical juncture. Our multi-timeframe analysis reveals a bearish-to-neutral bias with potential for a significant reversal if key support levels hold. The convergence of multiple technical indicators suggests heightened volatility ahead, presenting both risk and opportunity for astute traders.
📊 COMPREHENSIVE TECHNICAL ANALYSIS
🕯️ Candlestick Pattern Analysis
The recent price action has formed a Bullish Hammer pattern at the $64.00 psychological support level, suggesting potential exhaustion of selling pressure. This formation, combined with increasing volume, indicates possible accumulation phase initiation.
Key Patterns Identified:
- ✅ Bullish Hammer at support
- ⚠️ Evening Star formation on 4H chart
- 📍 Doji cluster indicating indecision
🌊 Elliott Wave Analysis
Current wave count suggests we're completing Wave 5 of a larger corrective structure:
Primary Count: Completing Wave C of ABC correction
Alternative Count: Wave 4 consolidation before final Wave 5 push
Target Zones:
- Bullish: $72.50-$74.00 (Wave 5 extension)
- Bearish: $58.00-$60.00 (Wave C completion)
📐 Harmonic Patterns
A Bullish Bat Pattern is forming on the daily timeframe:
- X: $78.45 (Recent High)
- A: $61.20 (Recent Low)
- B: $71.85 (0.618 Retracement)
- C: $64.41 (Current Price)
- D: $59.80-$60.50 (Projected - 0.886 XA)
Trading Implication: Watch for reversal signals near $60.00 for high-probability long entries.
🔄 Wyckoff Analysis
Current market structure suggests:
Phase: Potential Spring Test within Trading Range
Volume Analysis: Declining volume on recent decline = Lack of selling pressure
Smart Money Behavior: Accumulation signals emerging
Projected Move: Re-accumulation before markup phase
📊 W.D. Gann Analysis
Gann Square of 9 Calculations:
- Current Price: $64.413 sits on 225° angle
- Next Resistance: $68.00 (270° angle)
- Critical Support: $61.00 (180° angle)
Gann Time Cycles:
- September 15, 2025: Major time pivot ⏰
- September 22, 2025: Secondary cycle completion
Gann Fan Analysis:
- Price respecting 2x1 angle from July low
- Break above 1x1 angle at $66.50 signals trend change
☁️ Ichimoku Cloud Analysis
Current Position: Price below cloud - Bearish bias
Tenkan-sen: $65.80 (Immediate resistance)
Kijun-sen: $67.25 (Major resistance)
Cloud Support: $62.00-$63.50
Chikou Span: Bearish, below price 26 periods ago
📉 KEY TECHNICAL INDICATORS
📊 RSI (14-Period)
Current Reading: 42.5
Status: Approaching oversold territory
Divergence: Bullish divergence forming on 4H chart
Signal: Potential reversal zone approaching
📈 Bollinger Bands
Upper Band: $68.20
Middle Band (20 SMA): $65.85
Lower Band: $63.50
Current Position: Testing lower band
Volatility: Bands contracting - Breakout imminent
💹 VWAP Analysis
Daily VWAP: $64.85
Weekly Anchored VWAP: $66.20
Monthly VWAP: $67.50
Volume Profile POC: $65.00 (High volume node)
📊 Moving Averages Confluence
20 EMA: $65.85 ⬇️
50 SMA: $67.20 ⬇️
100 EMA: $69.50 ⬇️
200 SMA: $71.00 ⬇️
Status: Death cross on daily (50/200) - Bearish medium-term
🎯 TRADING STRATEGY
⚡ INTRADAY TRADING (5M-1H)
LONG SETUP 🟢
Entry Zone: $63.80-$64.20
Stop Loss: $63.40 (-1%)
Target 1: $64.80 (+1.5%)
Target 2: $65.40 (+2.5%)
Target 3: $66.00 (+3.5%)
Risk/Reward: 1:3.5
SHORT SETUP 🔴
Entry Zone: $65.60-$65.90
Stop Loss: $66.30 (-1%)
Target 1: $65.00 (-1.5%)
Target 2: $64.40 (-2.5%)
Target 3: $63.80 (-3.5%)
Risk/Reward: 1:3.5
📈 SWING TRADING (4H-DAILY)
BULLISH SCENARIO 🚀
Entry: $64.00-$64.50 (Current levels)
Stop Loss: $61.50 (-4%)
Target 1: $68.00 (+5.5%)
Target 2: $72.00 (+11.8%)
Target 3: $75.50 (+17.2%)
Position Size: 2% portfolio risk
BEARISH SCENARIO 📉
Entry: $65.80-$66.20 (Resistance retest)
Stop Loss: $67.50 (+2%)
Target 1: $62.00 (-6%)
Target 2: $59.50 (-10%)
Target 3: $57.00 (-14%)
Position Size: 1.5% portfolio risk
🗓️ WEEKLY FORECAST
Monday-Tuesday (Sept 9-10) 📅
- Expected Range: $63.50-$65.80
- Bias: Neutral with bullish undertone
- Key Level: Watch $64.00 support hold
Wednesday-Thursday (Sept 11-12) 📅
- Expected Range: $64.00-$67.00
- Bias: Potential breakout day
- Catalyst: EIA Inventory Data
Friday (Sept 13) 📅
- Expected Range: $65.00-$68.50
- Bias: Trend continuation
- Note: Options expiry volatility
🌍 MARKET CONTEXT & FUNDAMENTALS
Geopolitical Factors 🌐
- ⚠️ Middle East tensions supporting price floor
- 🇨🇳 China demand concerns capping upside
- 🇺🇸 SPR refill discussions providing support
Supply/Demand Dynamics ⚖️
- OPEC+ production cuts extended
- US shale production moderating
- Global inventory draws accelerating
Economic Indicators 📊
- Dollar Index weakening (Bullish for Oil)
- Global growth concerns (Bearish pressure)
- Inflation expectations rising (Supportive)
⚠️ RISK MANAGEMENT
Position Sizing Guidelines 💰
Intraday: Max 1-2% account risk per trade
Swing: Max 3-5% account risk per position
Correlation Risk: Monitor energy sector exposure
Stop Loss Strategies 🛡️
1. ATR-Based: 1.5x ATR from entry
2. Structure-Based: Below/above key S/R levels
3. Time-Based: Exit if no movement in 2-3 candles
Risk Factors ⚠️
- 🔴 Break below $61.50 invalidates bullish thesis
- 🔴 Unexpected OPEC+ policy changes
- 🔴 Rapid Dollar strengthening
- 🟢 Surprise inventory draws
- 🟢 Geopolitical escalation
🎯 KEY LEVELS TO WATCH
SUPPORT LEVELS 🟢
S1: $63.50 (Immediate)
S2: $61.50 (Critical)
S3: $59.00 (Major)
S4: $57.00 (Yearly Low)
RESISTANCE LEVELS 🔴
R1: $65.80 (Immediate)
R2: $67.25 (Daily 50MA)
R3: $69.50 (Daily 100MA)
R4: $72.00 (Major)
💡 PRO TRADING TIPS
1. 🎯 Best Entry Times: London/NY overlap (8-11 AM EST)
2. 📊 Volume Confirmation: Look for >20% above average
3. 🔄 Correlation Trades: Monitor USD/CAD inverse relationship
4. ⏰ Avoid Trading: 30 mins before/after EIA releases
5. 📈 Scale Strategy: Add to winners, not losers
🔮 MONTH-END PRICE TARGETS
September 2025 Projections:
Bullish Target: $72.00-$74.00 🎯
Base Case: $66.00-$68.00 📊
Bearish Target: $58.00-$60.00 📉
Probability Assessment:
- Bullish Scenario: 35% 📈
- Base Case: 45% ➡️
- Bearish Scenario: 20% 📉
📌 CONCLUSION & ACTION PLAN
USOIL presents a compelling risk/reward opportunity at current levels. The confluence of technical support at $64.00, combined with oversold conditions and potential harmonic pattern completion, suggests a tactical long position with tight risk management is warranted.
Recommended Strategy:
1. Primary: Accumulate long positions $63.50-$64.50
2. Alternative: Wait for breakout above $66.00 for momentum trades
3. Hedge: Consider put options if below $61.50
📝 TRADING CHECKLIST
Before entering any position:
- ✅ Confirm volume supports move
- ✅ Check RSI for divergences
- ✅ Verify multiple timeframe alignment
- ✅ Set stop loss before entry
- ✅ Calculate position size
- ✅ Review correlation with DXY
- ✅ Check economic calendar
- ✅ Assess market sentiment
🏷️ *Last Updated: September 6, 2025, 12:54 AM UTC+4*
🔔 Follow for daily updates and real-time trading signals!
For individuals seeking to enhance their trading abilities based on the analyses provided, I recommend exploring the mentoring program offered by Shunya Trade. (Website: shunya dot trade)
I would appreciate your feedback on this analysis, as it will serve as a valuable resource for future endeavors.
Sincerely,
Shunya.Trade
Website: shunya dot trade
⚠️Disclaimer: This post is intended solely for educational purposes and does not constitute investment advice, financial advice, or trading recommendations. The views expressed herein are derived from technical analysis and are shared for informational purposes only. The stock market inherently carries risks, including the potential for capital loss. Therefore, readers are strongly advised to exercise prudent judgment before making any investment decisions. We assume no liability for any actions taken based on this content. For personalized guidance, it is recommended to consult a certified financial advisor.
CRUDE OIL Support Ahead! Buy!
Hello,Traders!
CRUDE OIL keeps falling
In a downtrend which seems
To indicate that the market
Has its doubts about the
Economy, however, a strong
Horizontal support is ahead
Around 60.00$ and after the
Retest we will be expecting
A local bullish rebound
Sell!
Comment and subscribe to help us grow!
Check out other forecasts below too!
Disclosure: I am part of Trade Nation's Influencer program and receive a monthly fee for using their TradingView charts in my analysis.

WTI: weekly seller targets reached, monthly targets still lowerHi traders and investors!
This analysis is based on the Initiative Analysis concept (IA).
The sellers have reached the targets mentioned in the previous review (65.628 and 64.378).
What to expect next.
Daily timeframe
On the daily timeframe (D1) for WTI, we see a manipulation of the 65.771 level, which may indicate that the market is moving toward the monthly targets I mentioned earlier — 61.818 and 58.504.
Hourly timeframe
On the hourly timeframe (H1), this manipulation appeared as a false breakout of the upper boundary of a sideways range. The range boundaries are clearly defined: the upper boundary at 65.771 and the lower boundary at 63.580.
Wishing you profitable trades!

WTI OIL Short-term Channel Up 4H MA50 buy opportunity.Last week (August 26, see chart below) we caught the absolute low with our WTI Oil (USOIL) buy signal, hitting our $66.30 Target shortly after:
This time we have another buy signal on the short-term as the Channel Up that emerged has pulled-back all the way to its 4H MA50 (blue trend-line).
The last 3 times it did so, it was a buy opportunity. Assuming this is another Higher Low bottom, the new Bullish Leg that is about to be initiated, should aim for the 1.382 Fibonacci extension, similar to what the previous two did.
This gives us a $66.75 Target for the short-term.
-------------------------------------------------------------------------------
** Please LIKE 👍, FOLLOW ✅, SHARE 🙌 and COMMENT ✍ if you enjoy this idea! Also share your ideas and charts in the comments section below! This is best way to keep it relevant, support us, keep the content here free and allow the idea to reach as many people as possible. **
-------------------------------------------------------------------------------
💸💸💸💸💸💸
👇 👇 👇 👇 👇 👇

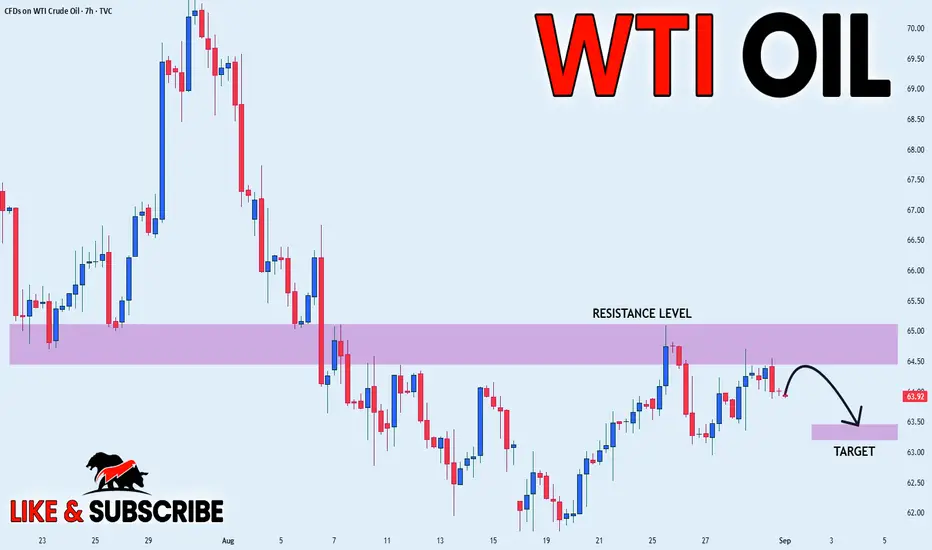
WTI Surges Above 65$ ResistanceCrude oil is currently supported by a combination of energy sanctions, geopolitical tensions, and rate cut expectations — with price action eyeing the $70 barrier as long as it holds above $65.20.
WTI maintained its rebound above the 61.80–62.00 support zone — aligning with the neckline of the previous inverted head and shoulders formation — and has broken above the 65 resistance level, signaling a potential continuation of bullish momentum. Daily RSI has also moved above the neutral 50 level, further confirming upside momentum.
• A clean hold above 65.20 may extend the rally toward 68.00, 69.40, and 70.40 — the next major resistance levels.
• On the downside, 62.00 and 61.80 remain key support levels. A break below them could expose oil to deeper losses toward 59.40 and 57.90.

USOIL (WTI Crude) – Buy & Sell Trade Scenarios🔵 Bullish Scenario (Buy Call)
Entry Zone: Break and sustained close above 65.20 – 65.50 (current 4H resistance).
Reasoning:
Price has retested the 64.90 resistance cluster multiple times, suggesting absorption of supply.
Volume shows declining sell pressure near resistance – a sign of potential breakout.
A breakout with strong volume confirms buyers stepping in.
Target 1: 66.75 (measured move into next liquidity pool).
Target 2 (extended): 68.20 – 68.50 (previous structural pivot).
Stop Loss: Below 64.20 (false breakout protection).
R:R Potential: ~1:2.5 to 1:3
🔴 Bearish Scenario (Sell Call)
Entry Zone: Rejection at 65.00 – 65.50 resistance with bearish confirmation candle.
Reasoning:
This zone has acted as a strong supply area since mid-August.
Multiple wicks rejecting the level + increasing sell volume hint at distribution.
If price fails to close above resistance, sellers regain control.
Target 1: 63.00 – 63.20 (mid-support range).
Target 2 (extended): 62.00 – 61.90 (major support zone).
Stop Loss: Above 65.70 (wick protection).
R:R Potential: ~1:2 to 1:3
⚖️ Key Technical Takeaway
64.90 – 65.50 = Pivot zone (battle between bulls and bears).
Breakout + volume = bullish continuation to 66.75+.
Rejection + heavy volume = bearish rotation back to 62.95.

CRUDE OIL WILL FALL|SHORT|
✅CRUDE OIL price went up
Sharply but a strong resistance
Level was hit at 65.00$
Thus, as a pullback is
Already happening
And a move down towards
The target of 63.50$shall follow
SHORT🔥
✅Like and subscribe to never miss a new idea!✅
SpotCrude Short Setup - 4h💎MJTrading
📸 Viewing Tip:
🛠️ Some layout elements may shift depending on your screen size.
🔗 View the fixed high-resolution chart here:
🛢️ PEPPERSTONE:SPOTCRUDE Short Setup – Third Tap of Falling Wedge Resistance
Pattern: Falling wedge
Context: Price is testing wedge resistance for the third time, with rejection signs
Bias: Bearish
🟢 Entry Point: 64.5
This aligns with upper boundary of the Falling Wedge (After Rejection).
❌ Stop Loss (SL): 65.5
🎯 Take Profit (TP) Levels
✅ TP1 (RR1) → 63.5
📈 TP2 → 62.5
💰 TP3 → 61.5
🧠 Trade Logic
Price is testing wedge resistance for the third time, with rejection signs
⚠️ Risk Management
Risk:Reward ratio ranges from 1:1 to 1:3, depending on TP level.
Psychology Always Matters:

BRIEFING Week #35 : Monthly forecast for Q4Here's your weekly update ! Brought to you each weekend with years of track-record history..
Don't forget to hit the like/follow button if you feel like this post deserves it ;)
That's the best way to support me and help pushing this content to other users.
Kindly,
Phil

WTI Crude Oil Trading Analysis: 02-September-2025Week Ahead Plan: September 2-6, 2025
Analysis Period : August 26-30, 2025 Review | September 2-6, 2025 Outlook
Market : WTI Crude Oil Futures (CL1!)
Methodology : Dual Renko Chart System ($0.25/15min + $0.50/30min)
Current Price : $64.00 (August 30, 2025)
________________________________________
Strategic Outlook & Market Setup
Primary Scenario (70% Probability): Pullback First, Then Recovery
What to Expect : Market opens lower Tuesday ($63.00-63.50 range) due to bearish signal on short-term chart. This creates a buying opportunity if support holds.
Trading Plan:
Tuesday Opening : Expect gap down - don't panic, this was anticipated
Buy Zone : Look for entries between $62.00-63.50 (strong institutional support)
Confirmation Needed : Wait for short-term trend to flip bullish again before buying
Target : Still aiming for $66.50 but may take extra 3-5 days to get there
Secondary Scenario (25% Probability): Sideways Consolidation
What to Expect : Market trades in $63.50-64.50 range for several days while technical signals realign.
Trading Plan:
Strategy: Be patient - don't force trades in choppy conditions
Wait For: Clear breakout above $64.50 with volume
Risk: Could waste 1-2 weeks in sideways action
Low Probability Scenario (5% Probability): Immediate Continuation Up
What to Expect : Market gaps up above $64.25 and keeps rising.
Trading Plan:
Verify: Make sure both short-term and long-term signals turn bullish
Caution: Be skeptical without strong volume confirmation
Action: Can buy but use smaller position sizes until confirmed
________________________________________
Market Risk Factors & Monitoring
Critical Support Level : $62.00
Why Important: Massive institutional buying occurred here - if it breaks, the bullish case is dead
Action If Broken: Exit all long positions immediately, wait for new setup
Probability of Break: Low (15%) but must be respected
Key Events This Week :
Tuesday: ISM Services data (economic health indicator)
Wednesday: Weekly oil inventory report (could cause volatility)
Friday: Jobs report (affects overall market sentiment)
Warning Signs to Watch:
Technical: Short-term trend staying bearish for more than 3 days
Volume: Declining volume on any bounce attempts
Support: Any trading below $62.50 for extended periods
Time: No progress toward $66.50 target within 10 total trading days
Positive Signs to Look For :
Technical: Short-term trend flipping back to bullish (key confirmation)
Volume: Above-average volume on any recovery moves
Support: Strong buying interest at $62-63 zone
Momentum: Clean breakout above $64.50 with follow-through
________________________________________
Forward-Looking Adjustments
Modified Risk Management :
Position Size: Use 50% of normal position size until both timeframes align bullish
Stop Loss: Tighter stops at $62.75 (just below support zone)
Entry Patience: Don't chase - wait for pullback to support levels
Profit Taking: Be more aggressive taking profits at first target ($66.50)
Revised Entry Strategy:
Before Buying, Confirm ALL Three:
Price: Trading at or near $62-63 support zone
Technical: Short-term trend signal flips back to bullish
Volume: Above-average buying interest visible
Timeline Expectations :
Days 1-3: Expect pullback/consolidation phase
Days 4-5: Look for bullish confirmation signals
Days 6-10: Resume advance toward $66.50 target if signals align
Beyond Day 10: If no progress, reassess entire strategy
Success Metrics:
Minimum Goal: Protect capital during pullback phase
Primary Target: $66.50 within 2 weeks (revised from 1 week)
Risk Limit: Maximum 2% account loss if support fails
Time Limit: Exit strategy if no directional progress within 10 days total
Simplified Decision Framework :
Green Light to Buy: Price near $62-63 + Short-term trend bullish + Good volume Yellow Light (Wait): Mixed signals, choppy price action, low volume
Red Light (Exit): Price below $62, bearish trend continuing, time limit exceeded
________________________________________
Bottom Line : The bigger picture remains bullish, but short-term signals suggest a pullback first. Use any weakness to $62-63 as a buying opportunity, but only with proper confirmation. Be patient - the setup is still valid but timing may be delayed by a few days.
________________________________________
Document Classification : Trading Analysis
Next Update : September 6, 2025 (Weekly Review)
Risk Level : Moderate (controlled institutional setup)
This analysis represents continued validation of a systematic, institutional-grade trading methodology with demonstrated predictive accuracy and risk control capabilities. This is a view that represents possible scenarios but ultimate responsibility is with each individual trader.
Risk Disclaimer: Past performance does not guarantee future results. All trading involves risk of loss.