WTI(20250821)Today's AnalysisMarket Update:
This week, central bankers from around the world gathered in Jackson Hole, Wyoming, for the annual global central bank meeting. They planned not only to exchange research and enjoy the beautiful mountain scenery, but also to defend Federal Reserve Chairman Jerome Powell. Powell has come under sustained attack from US President Trump for his refusal to cut interest rates. Trump has also promised to replace Powell with a more compliant candidate after his term ends next year. This offensive has unnerved global policymakers, who worry that central bank independence, seen as key to controlling inflation, could be undermined.
Technical Analysis:
Today's Buy/Sell Levels:
62.47
Support and Resistance Levels:
63.64
63.21
62.92
62.02
61.74
61.30
Trading Strategy:
On the upside, consider buying on a breakout above 62.92, with the first target at 63.21.
On the downside, consider selling on a breakout above 62.47, with the first target at 62.02.
Wticrudeoil

WTI OIL Buy signal if the 4H MA50 breaks.WTI Oil (USOIL) appears to have found short-term Support since the August 13 Low, turning sideways, with its 4H RSI however on Higher Lows, thus displaying a Bullish Divergence.
This is similar to the June 24 - July 02 Bullish Divergence, which once it broke above the 4H MA50 (blue trend-line), it topped a little over the 0.382 Fibonacci retracement level.
As a result, we will be waiting for the 4H MA50 bullish break-out signal to target $65.60 (Fib 0.382).
-------------------------------------------------------------------------------
** Please LIKE 👍, FOLLOW ✅, SHARE 🙌 and COMMENT ✍ if you enjoy this idea! Also share your ideas and charts in the comments section below! This is best way to keep it relevant, support us, keep the content here free and allow the idea to reach as many people as possible. **
-------------------------------------------------------------------------------
Disclosure: I am part of Trade Nation's Influencer program and receive a monthly fee for using their TradingView charts in my analysis.
💸💸💸💸💸💸
👇 👇 👇 👇 👇 👇

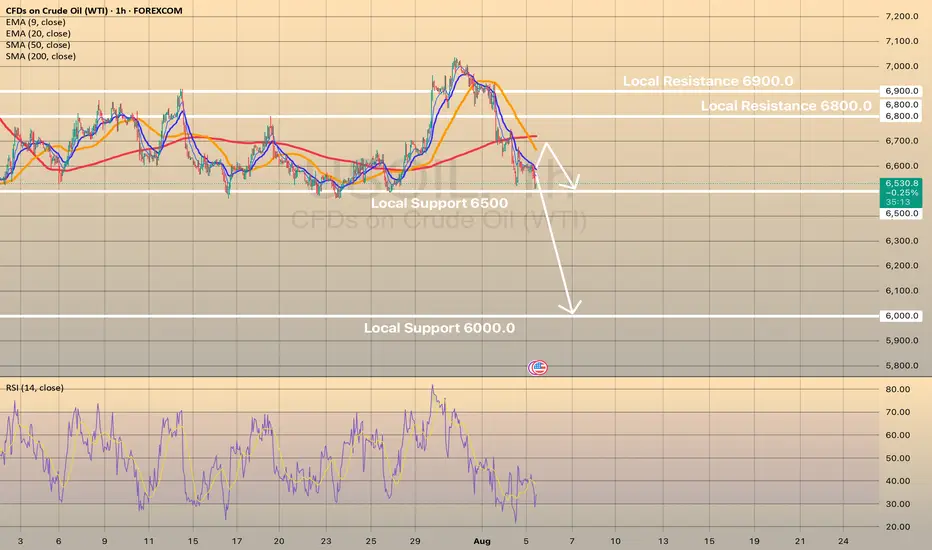
WTI Crude sideways consolidation capped at 6600The WTI Crude Oil is currently trading with a bearish bias, aligned with the broader downward trend. Recent price action shows a retest of the resistance, suggesting a further selling pressure within the downtrend.
Key resistance is located at 6600, a prior consolidation zone. This level will be critical in determining the next directional move.
A bearish rejection from 6600 could confirm the resumption of the downtrend, targeting the next support levels at 6200, followed by 6100 and 6000 over a longer timeframe.
Conversely, a decisive breakout and daily close above 6600 would invalidate the current bearish setup, shifting sentiment to bullish and potentially triggering a move towards 6710, then 6800.
Conclusion:
The short-term outlook remains bearish unless the pair breaks and holds above 6600. Traders should watch for price action signals around this key level to confirm direction. A rejection favours fresh downside continuation, while a breakout signals a potential trend reversal or deeper correction.
This communication is for informational purposes only and should not be viewed as any form of recommendation as to a particular course of action or as investment advice. It is not intended as an offer or solicitation for the purchase or sale of any financial instrument or as an official confirmation of any transaction. Opinions, estimates and assumptions expressed herein are made as of the date of this communication and are subject to change without notice. This communication has been prepared based upon information, including market prices, data and other information, believed to be reliable; however, Trade Nation does not warrant its completeness or accuracy. All market prices and market data contained in or attached to this communication are indicative and subject to change without notice.

Oil Prices Drop on Russia-Ukraine Talks HopeOil prices decline in anticipation of potential negotiations between Russia and Ukraine
U.S. President Donald Trump announced plans to facilitate a meeting between Ukrainian President Volodymyr Zelenskiy and Russian President Vladimir Putin, following his Monday summit with Zelenskiy and European leaders. Zelenskiy called the talks with Trump “very productive,” highlighting discussions on U.S. security assurances for Ukraine. A resolution to the Russia-Ukraine conflict could lift sanctions on Russian energy exports, freeing up crude oil trade. Oil prices have dropped around 10% this month due to trade tensions and increased OPEC+ production.
Technically the price consolidates below the intermediate 6,300.00, forming the bearish pennant. Price is getting ready to decline. Here, the first target will be the major level of 6,000.00.

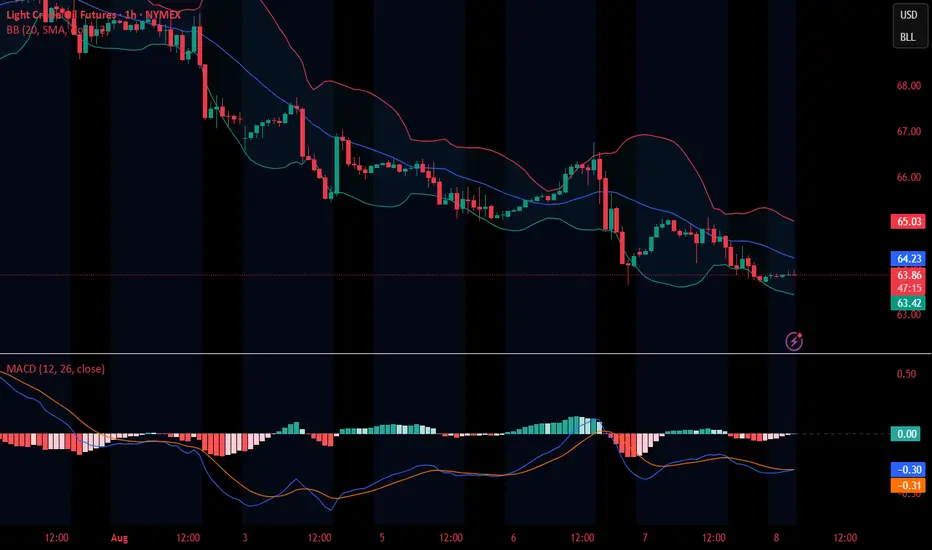
Market Analysis: WTI Crude Oil Struggles In RedMarket Analysis: WTI Crude Oil Struggles In Red
WTI Crude oil is also down and remains at risk of more losses below $62.00.
Important Takeaways for WTI Crude Oil Price Analysis Today
- WTI Crude oil prices extended losses below the $65.00 support zone.
- A major bearish trend line is formed with resistance at $63.05 on the hourly chart of XTI/USD.
WTI Crude Oil Price Technical Analysis
On the hourly chart of WTI Crude Oil, the price struggled to continue higher above $66.00 against the US Dollar. The price formed a short-term top and started a fresh decline below $65.00.
There was a steady decline below the $64.50 pivot level. The bears even pushed the price below $63.50 and the 50-hour simple moving average. Finally, the price tested the $62.15 zone, and the price is now consolidating losses.
On the upside, immediate resistance is near the 23.6% Fib retracement level of the downward move from the $65.98 swing high to the $62.15 low at $63.05. There is also a major bearish trend line at $63.05 and the 50-hour simple moving average.
The main hurdle is $63.50. A clear move above the $63.50 zone could send the price toward the 61.8% Fib retracement level at $64.50.
The next key resistance is near $66.00. If the price climbs further higher, it could face sellers near $68.00. Any more gains might send the price toward the $70.00 level.
Immediate support is near the $62.15 level. The next major level on the WTI crude oil chart is near $61.20. If there is a downside break, the price might decline toward $60.00. Any more losses may perhaps open the doors for a move toward the $55.00 zone.
This article represents the opinion of the Companies operating under the FXOpen brand only. It is not to be construed as an offer, solicitation, or recommendation with respect to products and services provided by the Companies operating under the FXOpen brand, nor is it to be considered financial advice.

WTI Crude downtrend capped at 6600The WTI Crude Oil is currently trading with a bearish bias, aligned with the broader downward trend. Recent price action shows a retest of the resistance, suggesting a further selling pressure within the downtrend.
Key resistance is located at 6600, a prior consolidation zone. This level will be critical in determining the next directional move.
A bearish rejection from 6600 could confirm the resumption of the downtrend, targeting the next support levels at 6200, followed by 6100 and 6000 over a longer timeframe.
Conversely, a decisive breakout and daily close above 6600 would invalidate the current bearish setup, shifting sentiment to bullish and potentially triggering a move towards 6710, then 6800.
Conclusion:
The short-term outlook remains bearish unless the pair breaks and holds above 6600. Traders should watch for price action signals around this key level to confirm direction. A rejection favours fresh downside continuation, while a breakout signals a potential trend reversal or deeper correction.
This communication is for informational purposes only and should not be viewed as any form of recommendation as to a particular course of action or as investment advice. It is not intended as an offer or solicitation for the purchase or sale of any financial instrument or as an official confirmation of any transaction. Opinions, estimates and assumptions expressed herein are made as of the date of this communication and are subject to change without notice. This communication has been prepared based upon information, including market prices, data and other information, believed to be reliable; however, Trade Nation does not warrant its completeness or accuracy. All market prices and market data contained in or attached to this communication are indicative and subject to change without notice.

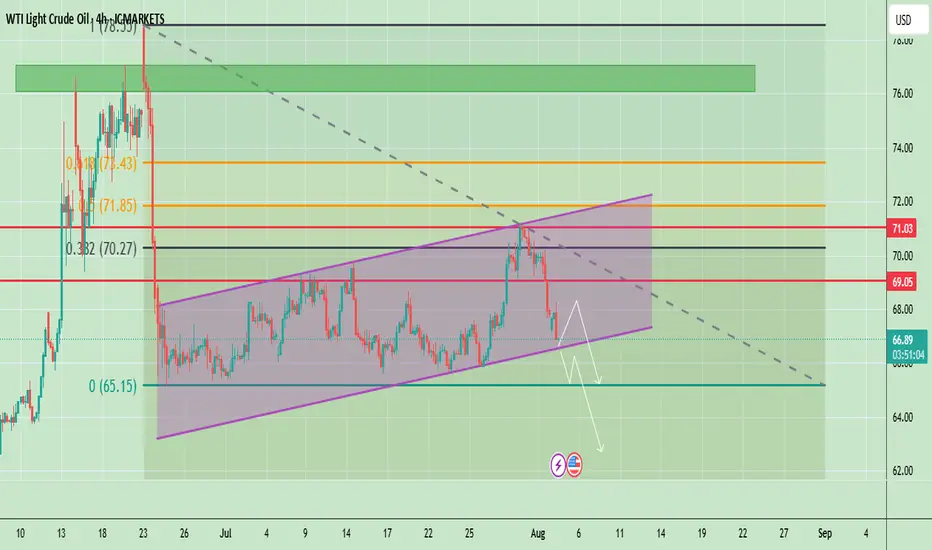
Oil at Key Support – Bounce or Breakdown?Crude oil is trading around $66.94, showing a bearish correction after failing to hold above $69.05. The chart shows price respecting an ascending channel but currently testing its lower boundary. The recent drop signals weakening bullish momentum, and a confirmed break below the channel could accelerate selling pressure toward lower levels.
📈 Potential Scenarios
- Bullish Rebound: If price holds above the channel support (~$66.00–$66.50) and breaks back above $69.05, it may target $71.03 and possibly $72.00.
- Bearish Breakdown: A confirmed close below $66.00 can accelerate the downside toward $65.00, with extended targets near $63.50–$62.00.
📊 Key Technical Highlights
- Price rejected from the channel top and is now testing lower support.
- Key resistance zones: $69.05 (immediate), $71.03 (major).
- Key support zones: $66.00 (channel), then $65.00–$63.50 (breakdown targets).
- Momentum indicators show weakening buying pressure, favoring cautious trading.
🔑 Key Levels to Watch
- Resistance: $69.05 → $71.03 → $72.00
- Support: $66.00 → $65.00 → $63.50
🧭 Trend Outlook
- A short-term relief bounce is possible, but failure to reclaim $69.05 keeps sellers in control.
- Breaking below the channel would shift the overall outlook to bearish for August.
Note
Please risk management in trading is a Key so use your money accordingly. If you like the idea then please like and boost. Thank you and Good Luck!
USOIL rebounds from 6,300.0. Where next?USOIL rebounds from 6,300.0. Where next?
USOIL bounced back from the 6,300.0 mark on Tuesday, building on slight gains from the prior session, after President Donald Trump prolonged a tariff truce with China for an additional 90 days. The decision, made just before new tariffs were due, provided temporary relief from rising trade tensions that might hinder global growth and energy demand. The modest rise towards SMA50 and 6,500.0 level is expected. Market participants will also be waiting for OPEC’s monthly report, along with US EIA and IEA forecasts, for fresh supply–demand signals.

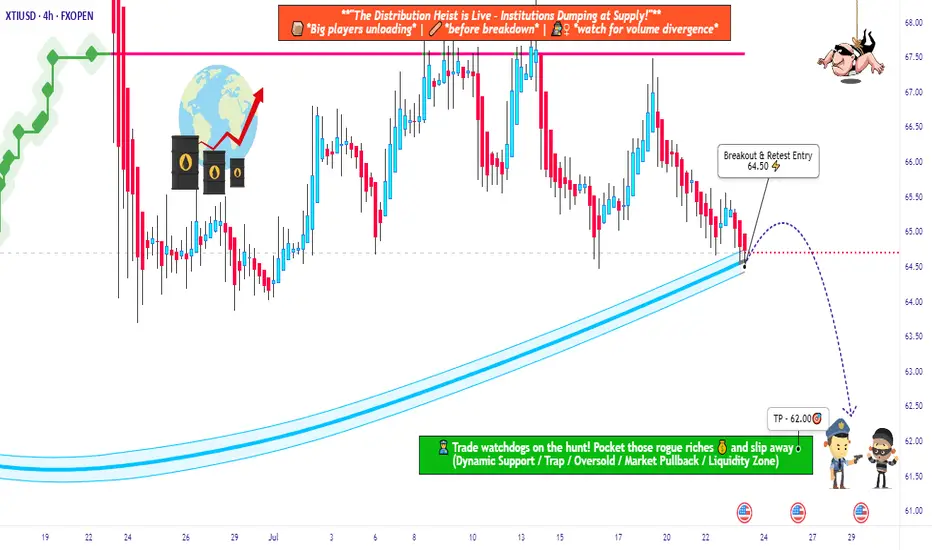
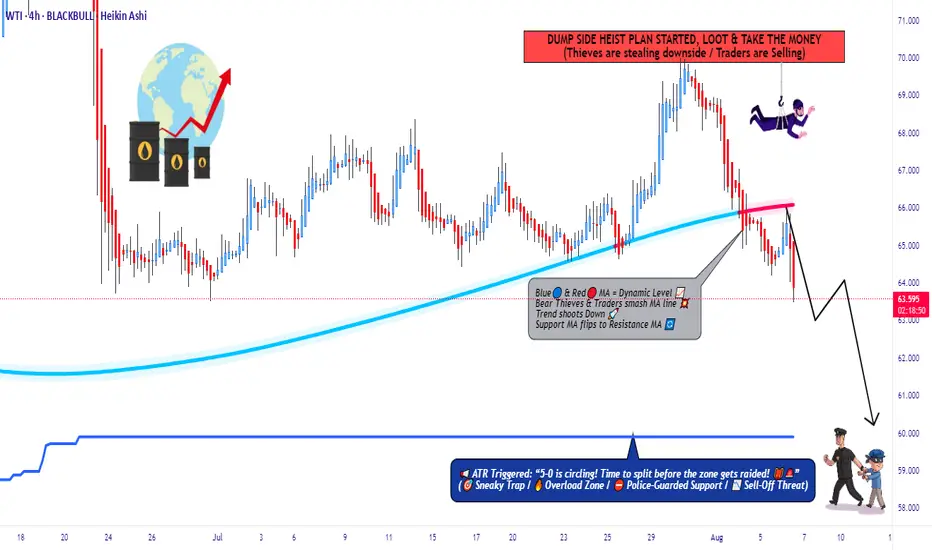
USOIL Robbery Alert! Smart Entry Plan Below Key MA Level🔐💥 “WTI Energy Heist: Thief Trader’s Bearish Master Plan” 💥🔐
The Official Robbery Blueprint for Smart Traders
🌟 Hi! Hola! Ola! Bonjour! Hallo! Marhaba! 🌟
💸 Welcome, Money Makers & Market Robbers! 💸
🚨 Get ready to break into the "US Oil Spot/WTI" market with precision-crafted bearish strategy from the one and only — Thief Trader Style!
📉💣 THE HEIST IS ON: SHORT PLAN LOADED! 💣📉
We’ve analyzed the charts using Thief Technicals + Fundamental Lockpick Tools and spotted a high-risk GREEN zone – a consolidation trap where greedy bulls usually get caught. This is where we strike.
🔑 ENTRY:
"Wait for the Neutral Moving Average to Break — Then Make Your Move!"
🎯 Focus zone: 64.50
☠️ Wait for the breakout – do NOT enter before it happens.
✅ Use sell stop orders above the MA line or place sell limit orders on the pullback after the breakout (target within the 15–30 min candle near swing high/low).
🧠 Thief Tip: Layer in entries using the DCA (layered attack strategy) to catch price on its way down. Set a chart alert so you don’t miss the strike moment.
🛑 STOP LOSS:
"Set it smart or don’t set it at all — you choose the fire you want to play with!"
📍 SL only gets placed AFTER breakout.
🎯 Recommended SL at 66.00 on the 4H swing level.
☠️ DO NOT place any orders or SL before confirmation breakout.
📊 Your SL depends on your risk %, lot size, and number of entries stacked.
🎯 TARGET ZONE: 62.50
💸 Lock profits before the bulls wake up. This level is based on market exhaustion zones and historical bounce areas.
🧠 WHY WE'RE SHORTING THIS?
This isn’t just a chart move — it’s backed by full-scale robbery research:
📰 COT Reports
📈 Macro & Seasonal Trends
🛢️ Crude Oil Inventories
💹 Sentiment & Intermarket Correlation
📉 Supply-Demand Dynamics
📚 Before pulling the trigger, educate yourself with the fundamentals. Dive into COT, Seasonal, and Macro reports. Don’t rob blindly — rob smart.
⚠️ Risk Management Alert:
Major news releases? Step back.
Trailing stops? Lock it in.
Position sizing? Know your risk.
Trade like a professional robber, not a street pickpocket.
💥💖 SUPPORT THE ROBBERY PLAN 💖💥
🧨 Smash that BOOST button to support this trading style and help more traders rob the market clean. Every like, every boost makes this community stronger.
💬 Drop a comment, share your entry levels, or post your winning trades.
This is a trading crew – we rob together, we profit together.
🔔 Stay tuned — more heist plans dropping soon.
Until then... Rob Smart. Trade Hard. Take Profits. 💰💪🎯
WTI: Oil Markets on Edge Despite Trump Considering Major TariffsOil prices could drop if Trump backs down on tariffs on countries buying Russian oil, but short-term bullish catalysts, like geopolitical tensions and bullish speculative bets, may still push prices up before longer-term headwinds take hold.
----------------------------------------------------------------------------------------------------------------------
Trump’s threats of steep tariffs on countries buying Russian oil have sent oil prices surging, as traders fear a global supply crunch if Russian barrels are cut off.
But here’s the twist: Trump has a history of backing down or delaying tariffs after using them as leverage. When he does, oil prices usually fall, as the immediate risk of supply disruption fades.
If he caves in again by the deadline, which is 10 to 12 days from 4 August, or extends it, oil prices could drop. The bigger picture also appears bearish: OPEC+ is ramping up supply, global demand is slowing and expected to drop in H2, and inventories are rising (first glimpse by EIA, Wed).
But with the deadline falling around 14–16 August, 2025, short-term bullish catalysts could spark a rally up to the 38.2%-61.8 % Fibonacci retracement levels, positioning WTI better for declines (conditional on Trump!).
This content is not directed to residents of the EU or UK. Any opinions, news, research, analyses, prices or other information contained on this website is provided as general market commentary and does not constitute investment advice. ThinkMarkets will not accept liability for any loss or damage including, without limitation, to any loss of profit which may arise directly or indirectly from use of or reliance on such information.

Oil continues to decline due to geopolitics optimismOil continues to decline due to geopolitics optimism
A Kremlin official announced that Presidents Trump and Putin will hold a summit soon, their first since 2021, with a White House source suggesting it could occur as early as next week. Optimism surrounding potential U.S.-Russia discussions on the Ukraine conflict has alleviated concerns about oil supply disruptions, despite U.S. sanctions targeting India for its continued Russian crude imports. Trump introduced a 25% tariff on Indian goods and signaled possible additional tariffs on China. However, increased OPEC production and ongoing trade tensions remain key concerns, raising fears of slower economic growth and reduced demand.
Technically, USOIL trades just above the 6,300.00 support level. Insignificant rebound from this level is expected with possible decline towards crucial 6,000.00 support level.

WTI(20250808)Today's AnalysisMarket News:
① Trump nominated Stephen Milan, Chairman of the White House Council of Economic Advisers, to serve on the Federal Reserve Board, with a term ending January 31, 2026.
② Waller is reportedly a leading candidate for the next Fed Chair.
③ U.S. Treasury Secretary Bensont stated that the interview process for the Fed Chair has begun.
④ Bostic stated that the July jobs report did change the Fed's outlook on its employment goals.
Technical Analysis:
Today's Buy/Sell Levels:
63.55
Support and Resistance Levels:
64.86
64.37
64.06
63.05
62.73
62.24
Trading Strategy:
If the price breaks above 63.55, consider entering a buy position, with the first target price being 64.06.
If the price breaks below 63.05, consider entering a sell position, with the first target price being 62.73.
USOIL declines on possibility of geopolitical stabilityUSOIL declines on possibility of geopolitical stability
Crude oil and gasoline prices fell August 6 after an early rally, as Trump announced "great progress" in U.S.-Russia talks to end the Ukraine war, reducing fears of new sanctions on Russian energy exports. Additionally, OPEC+’s planned 547,000 bpd production increase for September further pressured prices amid concerns of a global oil supply glut.
Technically, USOIL broke crucial local support at 6,500.00. Currently, the price is retesting this level. The decline towards 6,300.00 is expected in short-term.
WTI Under Attack – Rob the Market with This Bear Setup🛢️💣 WTI Oil Short Raid: Bearish Heist Activated! 💣🛢️
📉 Thief Trader’s Limit-Layered Attack Plan 🔐
💥 Attention Market Robbers & Chart Breakers! 💥
We're about to break into the XTIUSD / US Oil Spot vault — Bearish style.
🚨 The Setup:
This ain’t your average breakout — we’re talking high-precision, multi-layered entries on a downside raid.
🧠 Thief Trader Strategy: Drop limit orders at key zones like trip wires. Let price walk into your trap.
🎯 Plan:
🧱 Entry: Any level after MA resistance confirmation.
Layer multiple limit orders — DCA-style — after trend shows weakness.
🛑 Stop Loss: 66.300 🔒
Protect your vault. Place SL just above major 4H rejection zone.
🎯 Target: 60.000 💰
Profit at exhaustion level. This is where bulls cry, and we cash out.
🧠 Robbery Logic Backed By:
COT Data 📊
Crude Oil Inventories 🛢️
Macro + Sentiment Flows 🌐
Technical MA Break + Retest Patterns 🎯
🔥 Why this isn’t a random short?
Because thieves do research — not guesswork.
Bulls have overextended. Oil’s price is reacting to strong supply pressure and weakening demand outlook.
⚠️ Risk Note:
No entry without trend confirmation.
No blind shots — place alerts and wait for the setup.
This is a sniper job, not a shotgun spray.
💬 Join the Robbery Crew
Smash that ❤️ & Boost if you're riding with the thieves!
Drop your charts, entries, or sniper shots in the comments 💬
We rob together. We win together.
🔔 Follow for more heist plans – next market break-in coming soon.
💰 Rob Smart. Trade Sharp. Exit Clean. 🏴☠️
WTI Crude key support zone at 6553The WTI Crude Oil remains in a neutral trend, with recent price action showing signs of a corrective pullback within the broader uptrend.
Support Zone: 6553 – a key level from previous consolidation. Price is currently testing or approaching this level.
A bullish rebound from 6553 would confirm ongoing upside momentum, with potential targets at:
6850 – initial resistance
6950 – psychological and structural level
7090 – extended resistance on the longer-term chart
Bearish Scenario:
A confirmed break and daily close below 6553 would weaken the bullish outlook and suggest deeper downside risk toward:
6400 – minor support
6310 – stronger support and potential demand zone
Outlook:
Neutral bias remains intact while the WTI trades around pivotal 6553 level. A sustained break below or above this level could shift momentum.
This communication is for informational purposes only and should not be viewed as any form of recommendation as to a particular course of action or as investment advice. It is not intended as an offer or solicitation for the purchase or sale of any financial instrument or as an official confirmation of any transaction. Opinions, estimates and assumptions expressed herein are made as of the date of this communication and are subject to change without notice. This communication has been prepared based upon information, including market prices, data and other information, believed to be reliable; however, Trade Nation does not warrant its completeness or accuracy. All market prices and market data contained in or attached to this communication are indicative and subject to change without notice.

WTI Crude Oil – Range Support in FocusWe're waiting for price to reach the bottom of the range, and with a solid buy signal, we’ll consider going long.
However, since this level has been tested multiple times, it’s highly vulnerable to stop fishing — so caution is key.
As always, we’re ready for all scenarios:
If price breaks below, we’ll wait for a pullback to enter short.
But right now, we’re watching the range support for potential longs

WTI(20250806)Today's AnalysisMarket News:
The US non-manufacturing PMI fell to 50.1 in July from 50.8 in June, below the expected 51.5. The ISM New Orders Index fell to 50.3 in July from 51.3 in June, with export orders contracting for the fourth time in five months.
Technical Analysis:
Today's Buy/Sell Levels:
64.90
Support and Resistance Levels:
66.21
65.72
65.40
64.40
64.08
63.59
Trading Strategy:
On a break above 64.90, consider a buy entry, with the first target at 65.40. On a break below 64.40, consider a sell entry, with the first target at 64.08

USOIL Bulls Seize a New OpportunityThe EIA crude oil inventory data is scheduled for release today and is expected to have a significant impact on USOIL prices. Based on the previously released API report, there’s a high probability that the EIA data will also be bullish.
From a technical perspective, USOIL is currently showing signs of a potential rebound. Therefore, for traders participating in USOIL today, it may be more favorable to adopt a bullish bias. If managed well around key support levels and timing, the setup could offer attractive profit opportunities.

USOIL drops on rising supply and demand concernsUSOIL drops on rising supply and demand concerns
Oil prices fell Tuesday as OPEC+ planned a 547,000 bpd output increase for September, overshadowing potential Russian oil supply constraints from U.S. policies. Brent and WTI crude dropped to their lowest in a week, marking a fourth consecutive decline. OPEC+’s reversal of 2.5 million bpd cuts, combined with weak demand outlooks due to U.S. recession risks and China’s lack of new stimulus, pressured prices. Trump’s threatened 100% tariffs on Russian crude buyers like India, which imports 1.75 million bpd, heightened trade tensions but failed to lift oil prices. Analysts warn U.S. tariffs could further weaken global growth and fuel demand.
USOIL shows some in-moment strength on RSI on 1-h chart, the price may rebound towards sma200 at 6,700.00. However, in long-term perspective, low oil price is expected. Eventually, the price may decline towards level of 6,000.00.
WTI(20250805)Today's AnalysisMarket News:
Goldman Sachs: We expect the Federal Reserve to cut interest rates by 25 basis points three times starting in September; if the unemployment rate rises further, a 50 basis point cut is possible.
Technical Analysis:
Today's Buy/Sell Levels:
65.85
Support/Resistance Levels:
67.97
67.18
66.67
65.04
64.53
63.74
Trading Strategy:
If the market breaks above 65.85, consider buying, with the first target at 66.67. If the market breaks below 65.04, consider selling, with the first target at 64.53.
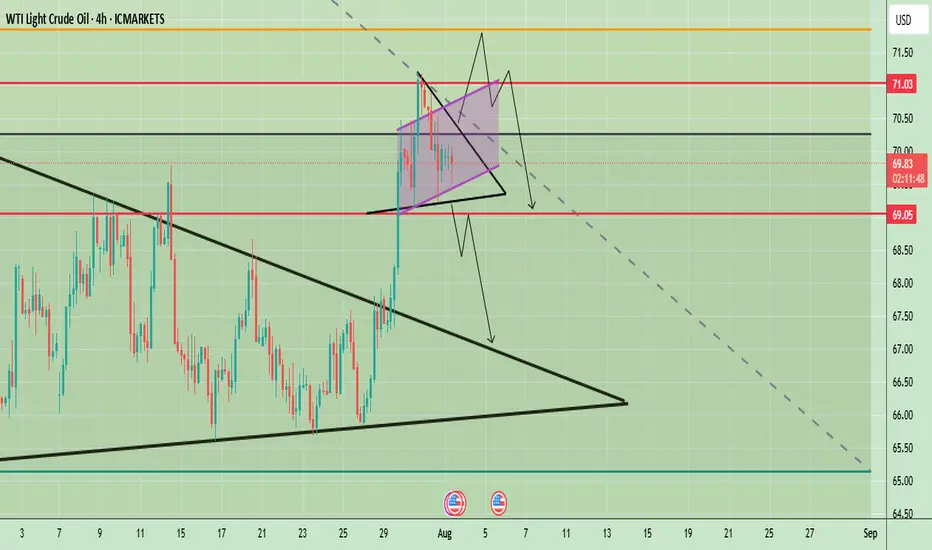
WTI Crude Oil Technical Outlook – Key Breakout or BreakdownWTI Crude Oil 4-hour chart suggests a potential inflection point after a strong bullish breakout from a larger symmetrical triangle pattern in late July. The price surged past key resistance levels and is now consolidating in a smaller symmetrical triangle formation just below the psychological $70 mark. This indicates a phase of indecision following a strong move, with market participants awaiting further confirmation.
Price is currently hovering around $69.82, with key levels marked at $71.03 (resistance) and $69.05 (support). The short-term price action within the tight triangle could determine the next move, with both bullish continuation and bearish reversal scenarios on the table.
Prices remain supported by supply concerns after Trump threatened to impose 100% secondary tariffs on buyers of Russian crude and warned China, a major oil consumer of severe penalties if it continues its purchases of Russian oil.
🔍 Potential Scenarios
- Bullish Breakout Scenario
If price breaks out of the smaller symmetrical triangle to the upside and clears the $70 resistance level with strong momentum, it may quickly test the $71.03 zone. A clean break above $71.03 would confirm the continuation of the previous uptrend, potentially opening room toward $72.50 and beyond in the medium term. The pattern would resemble a bullish pennant — a continuation pattern following the late July rally.
-Bearish Rejection and Breakdown
Conversely, a failure to sustain above $70 followed by a break below the lower boundary of the smaller triangle could lead to a sharper decline. The first critical level to watch would be $69.05; a break below this would likely invalidate the bullish setup and initiate a retest of the previously broken upper trendline of the larger triangle near $67.50. A further breakdown could lead price towards the larger support zone around $65–$66.
📈 Trend Outlook
- Short-Term: Neutral to Bullish — Consolidation in a smaller symmetrical triangle suggests a pause before continuation. However, the structure is still technically bullish unless $69.05 is broken.
- Medium-Term: Bullish Bias — The breakout from the large symmetrical triangle in late July indicates a shift in market sentiment, favoring higher prices unless the price fails to hold above $67.50.
- Long-Term: Cautiously Bullish — As long as WTI holds above the $65–$66 structural support area, the longer-term outlook remains constructive.
Note
Please risk management in trading is a Key so use your money accordingly. If you like the idea then please like and boost. Thank you and Good Luck!
USOIL declines for the 3 days in a row. What's next?USOIL declines for the 3 days in a row. What's next?
Since the last post the USOIL has already declined on 2.5%, currently rebounding from SMA50 on 4-h chart. 2 main reasons are behind this.
On August 3, the Organization of the Petroleum Exporting Countries and their partners, collectively known as OPEC+, decided to increase oil production by 547,000 barrels per day in September, the latest in a series of swift production boosts aimed at regaining market share. They cited a robust economic outlook and low inventories as the reasons for their decision. However, Friday NFP report may signal of a potential recession risk in the United States, the biggest oil consumer in the world. Here is what the Goldman Sachs writes down in x.com: "The decline in employment growth over the previous two months in the July report was one of the largest since 1960 and was accompanied by several months of similar revisions earlier. Corrections of this magnitude are extremely rare outside of the recession period."
So, fundamentals don't favor oil and despite the current rebound from SMA50, there are low chances of developing some bullish momentum here. The pullback from 6,800.00 is expected with the following decline towards 6,500.00
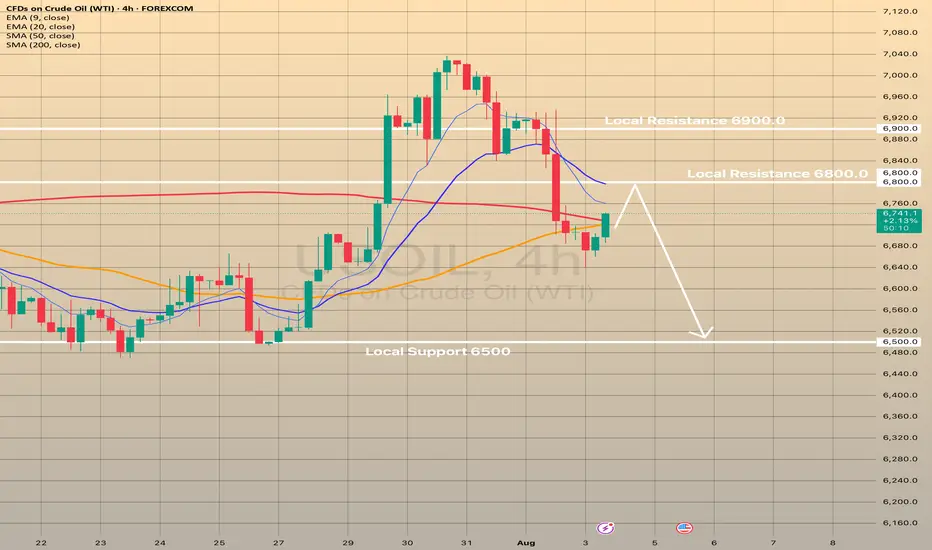
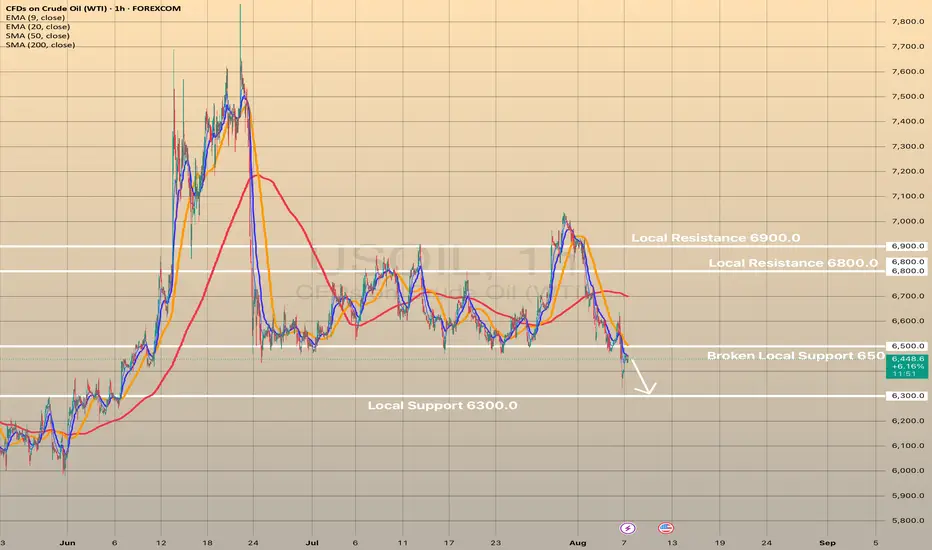
USOIL REACHED THE 6,900.00 SUPPORT LEVEL. WHAT'S NEXT?USOIL REACHED THE 6,900.00 SUPPORT LEVEL. WHAT'S NEXT?
As we told July 31, the price got reversed towards first support level of 6,900.00. Market participants are waiting for the OPEC+ meeting this week, expecting a significant output hike. Currently, the price sits slightly above the support level. Although, the asset trades above this level, considering the current weakness of the asset, further decline is expected. The 6,800.00 support level is the next target here.
