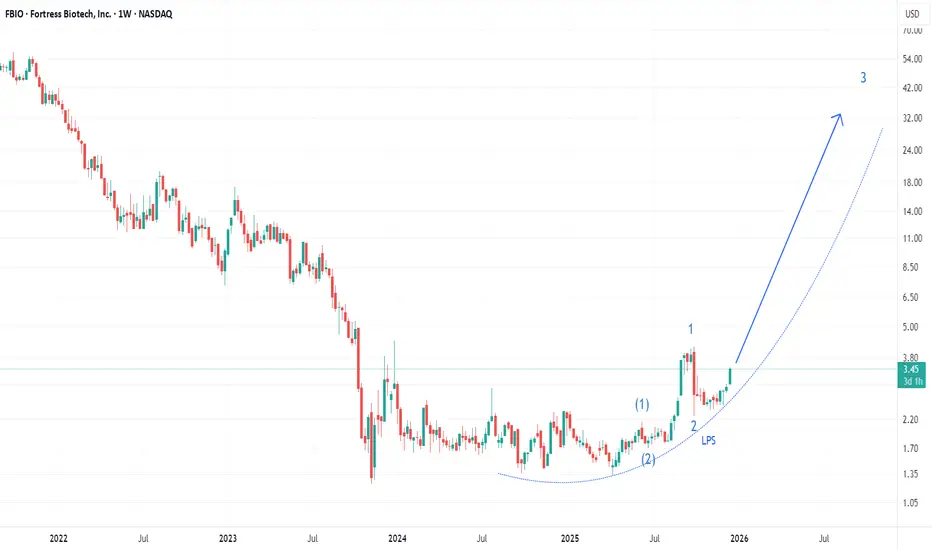
FBIO Stock Has the Potential to SkyrocketAfter years of accumulation, FBIO broke higher with clear signs of strength, marking what appears to be the first leg of Wave 3. The pullback held up well, behaving more like an LPS and fitting a Wave-2-of-3. From here, with the structure now lining up for the early acceleration of the main Wave-3-of-3 move.
Wyckoff
FKLI SHORTThis is a continuation from my previous post :
Kindly refer as attached
We started shorting yesterday, been looking for a good spot past few weeks.
-might add up today if sweet spots available
We view, the current price behaviour, are pointing towards distribution esp with individual stocks, that exhibit Tape-Dominating Distributions
Tight risk here

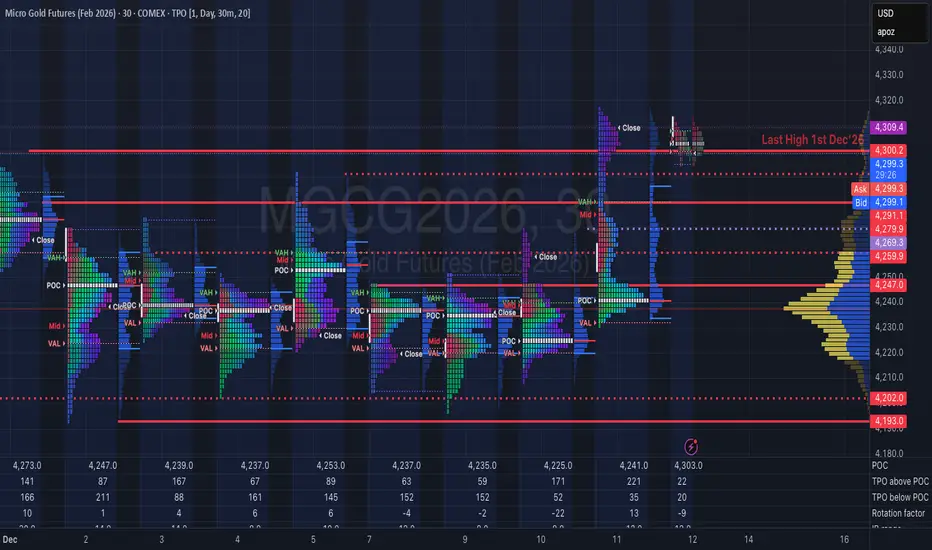
Gold Context: Mechanical Balance & The Poor HighFOREXCOM:XAUUSD COMEX_MINI:MGCG2026 COMEX:GC1!
Analysis
1. Market Context (Mechanical Balance)
The auction has entered a phase of Mechanical Balance . By maintaining trade above 4300 for a week, the market is signaling acceptance of higher prices, but the momentum has paused.
* The Behavior: The test of yesterday’s Midpoint/POC and the "mild" activity confirms that Short-Term Timeframe traders are currently dominant. They are trading off visual references rather than creating new value.
2. Structure (The Poor High)
We have a structural anomaly at the 4380/90 area : a Poor High .
* Implication: A poor high lacks "excess" (a buying tail), which indicates the auction did not finish properly. Selling wasn't aggressive; buying simply dried up. This leaves "unfinished business" to the upside.
* The Nuance: While the destination is likely higher to repair this poor high, the market may lack the immediate energy to do so without an inventory adjustment first.
3. Short-Term Scenario (Liquidation)
The mild, mechanical trade increases the odds of Long Liquidation .
* The Flush: A rotation back toward the 4300 shelf would test the lower limits of this balance.
* The Opportunity: If we flush to 4300 and find responsive buying, it re-energizes the market to finally go up and repair the 4380/90 poor high.
Plan & Execution
* Bias: Neutral-to-Bullish (awaiting repair).
* Observation: Watch the 4300 test. Do we get a "look below and fail" (bullish) or acceptance lower? The poor high remains a magnet for the future.
Talk to you for the next update.

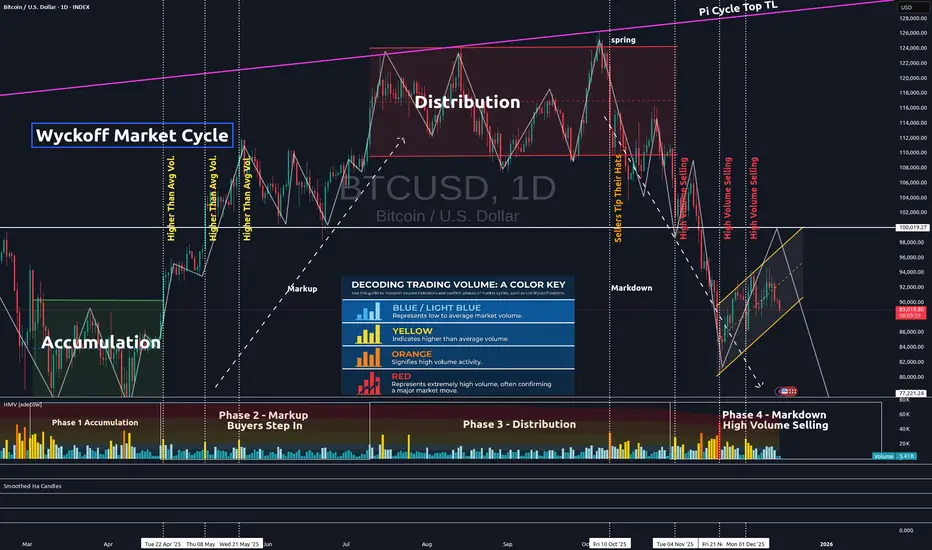
Confirming Chart Patterns With VolumeIn the chart above, one can clearly recognize the Wyckoff Market Cycle pattern. The pattern's legitimacy can be confirmed by volume. The volume is represented in the lower portion of the chart.
Low to average volume candles are blue. Average volume is indicated by light blue candles. Yellow candles represent higher than average volume. Orange is high volume. And red represents extremely high volume.
You will see each phase of the Wyckoff Market Cycle pattern confirmed by this volume on our current Bitcoin chart.
First, the market enters the accumulation phase. Market volume is fairly high, as seen in the accumulation quadrant in the lower left on the chart. However, it is important to note that there is an equal distribution of high-volume selling days as there are high-volume buying days. Thus, price tends to trend sideways within the channel until the true buying power comes into action.
Next, the buyers step in and take the price higher. This is generally indicated by a high-volume day when the price breaks above the accumulation channel. When buyers step in, most of the yellow and orange volume candles are, in fact, buyers in the markup phase. You can verify this is true by lining these higher-than-average volume candles up with the green price candles on the Bitcoin chart. This indicates the markup phase has begun and is underway.
Then, we come to the distribution phase on our chart. Notice the volume in that 3rd quadrant, the distribution quadrant. It is mostly average volume. Institutional sellers are attempting to carefully exit quietly. But you can also see that near the end of the distribution phase, sellers are starting to step in, tipping their hats and indicating that the distribution phase is about to end.
Finally, sellers take back full control, dropping us from the distribution channel altogether. High volume selling confirms this move and the pattern. The final quadrant in the bottom right proves that mostly sellers have control, as the majority of higher volume candles (yellow, orange, and red) are credited to the sellers.
Our Wyckoff Market Cycle pattern is now confirmed, and further selling can be expected until volume is once again taken back by the buyers. One will need to see clearly that high-volume candles are in line with green price candles. In this chart, that is not yet the case. Thus, more selling should be expected until it is clearly evident that buyer command control once again.
Hope you found this brief educational write-up informative and helpful, as volume can often be utilized in many uncertain pattern formations to find pattern legitimacy and confirmation.
✌️Stew
Gold Context: Initiative Breakout & The ATH Magnet
COMEX:GC1! COMEX_MINI:MGCG2026 FOREXCOM:XAUUSD
Analysis
1. Market Context (The Transition)
The auction has successfully transitioned. What began as mechanical Short Covering has evolved into apparent Initiative Buying .
• Structure: The market is facilitating trade at higher prices, signaling that "New Money" (Innovators/Early Adopters) sees value here.
• Momentum: This is not just emotional momentum; it is structural. The migration of value suggests confidence in the breakout.
2. The ATH Approach (Nuance Required)
With the fundamental backdrop updated (Policy Divergence/Fed Pause) and year-end flows active, the auction is magnetically drawn to the All-Time High .
• The Probability: The path of least resistance is higher. We are likely to test the ATH limits soon.
• The Caution (Laggards): As we press into record highs, be aware of the "Diffusion of Information." We want to ensure the buying remains dominated by smart money, not Laggards chasing the move late. If the buying quality deteriorates (low volume breakouts), expect a sharp inventory adjustment.
Plan & Execution
• Bias: Long/Constructive.
• Invalidation: We need to hold acceptance above the recent breakout shelf (4300 area). A failure to hold would suggest the current participants were just "renting" the position, not owning it.
Talk to you for the next update.

Gold Context: Initiative Buying & The Path to ATHCOMEX:GC1! COMEX_MINI:MGCG2026 FOREXCOM:XAUUSD
Analysis
1. Market Context (Transition to Initiative) The Gold auction has evolved significantly. What began as mechanical short covering has transitioned into probable initiative buying (New Money).
Structure: The auction is facilitating trade at higher prices, indicating that buyers are aggressive and willing to pay up.
The Shift: We have moved away from the "emotional" phase into a more sustainable value migration. The market is now seeking to repair the structure and test the extremes.
2. The Road to ATH (4425) We are now within striking distance of the All-Time High (4425 area) .
Key Reference (4300): This level has shifted from a psychological barrier to a potential support shelf.
The Setup: If Gold can hold and build acceptance above 4300 , it confirms the breakout. We expect the auction to establish a new balance area here before making the final rotation toward the ATH.
Friday Flows: Be mindful of weekend profit-taking, but as long as the structure holds above the breakout point, the medium-term bias remains firmly to the upside.
Plan & Execution
Focus: Watch for acceptance above 4300.
Scenario: If we see a pullback, I am monitoring for responsive buyers to defend the breakout zone (turning old resistance into support).
Talk to you for the next update.
EURUSD: Downside Reversal - Failure Trade Setup📊 Setup Breakdown:
Phase 1: Trend-Changing Pattern (TCP) Complete
The EURUSD completed a trend-changing pattern, signalling potential shift in market structure.
Phase 2: Strong Extended Bullish Rally
Following the TCP, price delivered a powerful extended rally—pushing higher with strong momentum.
Phase 3: Break & No Follow-Through (The Failure)
Price broke to a new high but failed to follow through. This is the critical signal—buyers pushed but couldn't sustain the move.
🎯 The Trade Setup:
Entry: 1.1753
Stop Loss (Invalidation): 1.1763
Risk: 10 pips
Target: 1.1682 (TCP Low)
Potential: 71 pips
Risk: Reward: 7:1
📚 The Wyckoff Principle:
Richard Wyckoff called this pattern "Shortening of the Thrust"—when price makes a new high with diminishing momentum and fails to follow through, it signals exhaustion and potential reversal.
This is a classic failure trade pattern:
Price breaks a key level
Buyers fail to show conviction
No follow-through = weakness
Short opportunity confirms
Key Trading Principle:
When the market shows its hand through failure patterns, we react mechanically. Extended rallies followed by failed breakouts often lead to sharp reversals.
This is textbook price behaviour. This is the WavesOfSuccess methodology.
👍 Hit the boost button if this analysis helps
👤 Follow for more failure trade setups

Long Term Wyckoff Distribution In-PlayAs the title states, we have a Wyckoff distribution method/pattern in play here on the chart.
So far the set up and pattern has been pretty on-point if you take a look and analyze Wyckoff Methods from www.wyckoffanalytics.com .
I don't have a ton of additional analysis to add here. I am only analyzing the chart and indicators I have. However, I'd love to hear some additional feedback for contrasting opinions or agreeing opinions for some confluence.
Have a great day TV gang and I hope you have a great December.
Post-FOMC Context: Policy Divergence & Inventory AdjustmentCOMEX:GC1! FOREXCOM:XAUUSD COMEX_MINI:MGCG2026
Analysis
1. Macro Context (The Currency Auction)
The structural bid for the USD remains valid due to clear Policy Divergence .
* The Fed: The "Hawkish Cut" (25bps) coupled with the signal for a "slower pace" (only one cut projected for 2026) confirms a pivot to a "pause" to verify data.
* The ECB: Conversely, Europe is cutting into economic weakness.
* Implication: This widening rate spread creates a fundamental floor. The recent drop in DXY displays the characteristics of a Liquidation Break (inventory adjustment) rather than a structural reversal. The market flushed weak, crowded longs, but value has not migrated lower.
2. Gold Auction Analysis (Emotional Structure)
The post-FOMC rally in Gold displays the hallmarks of an Emotional Trade .
* Structure: The vertical move has left behind Low Volume Nodes (LVNs) and single prints. This indicates the auction was driven by mechanical short covering rather than initiative buying, leaving a "poor" or "thin" structure.
* The Test: We are trading into Higher Time Frame (HTF) resistance.
* Scenario A: For a credible attempt at ATH, we require New Money (OTF) to step in and backfill these LVNs—converting the thin structure into accepted value.
* Scenario B: Without sustained OTF participation, the probability favors a rotation back to value to repair the poor structure. Emotional rallies often fade once the short covering inventory is depleted.
3. ES Context (Liquidity Window)
The "Hawkish" pause signal removes the "easy money" narrative for 2026. If 10Y yields break higher, the ES auction is vulnerable to its own liquidation break as participants adjust to the new rate path.
Plan & Execution
* Gold: Caution on the long side at these highs. The structure is fragile. Monitoring for a fade back to value versus genuine acceptance.
* DXY: Expect two-way trade as the liquidation stabilizes and inventory balances.
Talk to you for the next update.
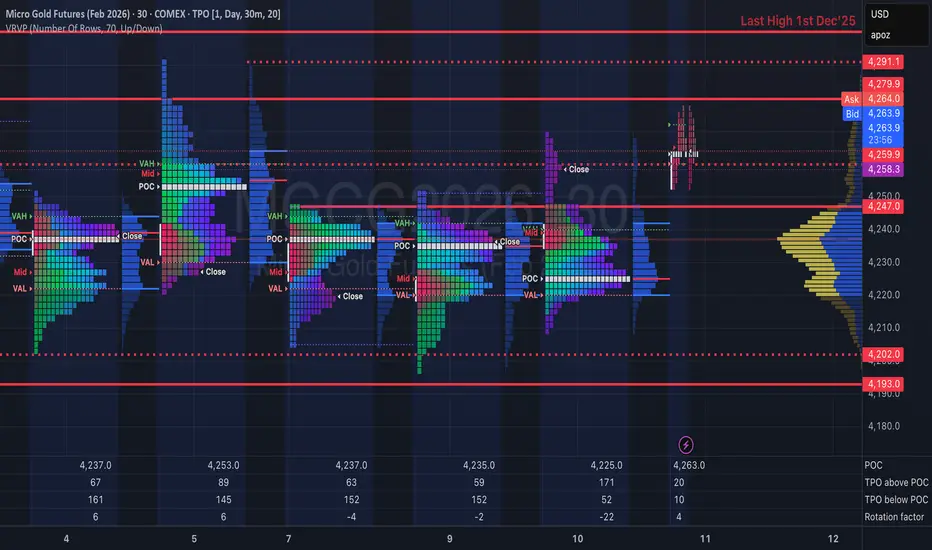
Gold Context: Reclaiming 4227 & Follow-Through FlowsFOREXCOM:XAUUSD COMEX_MINI:MGCG2026 COMEX:GC1!
Traders. Pre-US Open update on the developing structure.
Market Context (Reclaiming Value):
Gold has successfully rotated back above 4227, reclaiming Friday's trading range.
• The Flow: We observed initial short covering that found genuine follow-through. This indicates that the market is not just covering shorts but finding acceptance at these higher prices.
• Structural Shift: By trading back inside Friday's range, the auction has negated the immediate bearish pressure seen at the lows.
Structure & Outlook:
• The Pivot (4227): This level is now our key reference. As long as Gold facilitates trade above 4227, the bias remains constructive (Long).
• The Target: The immediate destination for this rotation is 4250.
• Condition: We need to see the US Open maintain this bid and not fall back below the 4227 shelf.
Plan & Execution:
• Bias: Long / Constructive.
• Invalidation: A failure to hold 4227 would put the auction back into a weak position.
Talk to you for the next update.

Gold Context: Failed Breakdown & Structure ResilienceCOMEX:GC1! COMEX_MINI:MGCG2026 FOREXCOM:XAUUSD
Traders. Update on the opening flows of the week.
Market Context (The Defense): Yesterday, the auction probed slightly below Friday's low, but failed to find acceptance or continuation.
The Reaction: Instead of triggering a broader liquidation break, we saw immediate short covering.
Key Observation: The market barely tested Thursday's low. This inability to extend lower and "repair" the structure indicates a lack of aggressive selling interest.
Structure & Outlook: I do not view this price action as a sign of weakness. On the contrary, the rejection of lower prices suggests responsive buying is present.
The Expectation: We are looking for this initial short covering to transition into New Money (OTF) buying.
The Confirmation: If "New Money" steps in above the current balance, it validates the resilience we saw yesterday and should drive the auction higher.
Plan & Execution:
Bias: Constructive / Looking for upside rotation.
Focus: Monitoring the transition from mechanical short covering to genuine initiative buying.
Talk to you for the next update.

Somethings Off. Santa Clause Rally Ending In Sync w/Dollar Drop?Trading Fam,
Providing a quick update on a few new and alarming chart events and indications I am seeing. Usually, when the dollar drops, as long as the VIX remains low, stocks and crypto will rise. However, an anomaly is currently occurring on the charts. As stocks seem to be topping, the dollar is also testing major 17 year and 42 year support! I am not quite sure how to read this, but it seems that in this case, we could see stocks drop along with the dollar. How could this happen? Unknown. Could it have something to do with BRICS? Could it have something to do with the upcoming Fed decision? I honestly don't know how to answer this. I am simply just reading what the charts are showing me and telling you what it might mean for stocks and crypto.
Let's dive in!
✌️Stew

Gold Context: The 4290 Probe & Weekly Balance OutlookFOREXCOM:XAUUSD COMEX_MINI:MGCG2026 COMEX:GC1!
Traders. Weekly wrap-up and context outlook for the next auction.
Market Context (The Rejection):
Gold rejected the 4290 level, falling just short of the 4300 psychological magnet.
• Interpretation: While the day ended with a rejection (excess), we must not ignore that the auction did facilitate trade at these levels. This extension above our 3-day balance indicates intent.
• The Profile: The rally displays characteristics of short covering (squeezing weak shorts) rather than aggressive new buying. The rejection simply indicates the price was "too high" for the current timeframe, but the level remains a valid target for a revisit.
Structure & Outlook (Next Week):
We are monitoring the Weekly Balance zone roughly between 4220 – 4260.
• The Bull Case (Acceptance): If we see continued short covering transition into New Money (OTF) buying above this balance, we look for acceptance at these higher prices. This would open the door to trade through 4300.
• The Bear Case (Liquidation): There is a probability of long liquidation if the auction fails to hold the balance, but I am cautious/skeptical of the downside potential right now.
Plan:
Watch for acceptance vs. rejection relative to the 4220–4260 balance. We need "New Money" to sustain the break of 4300.
Talk to you for the next update.
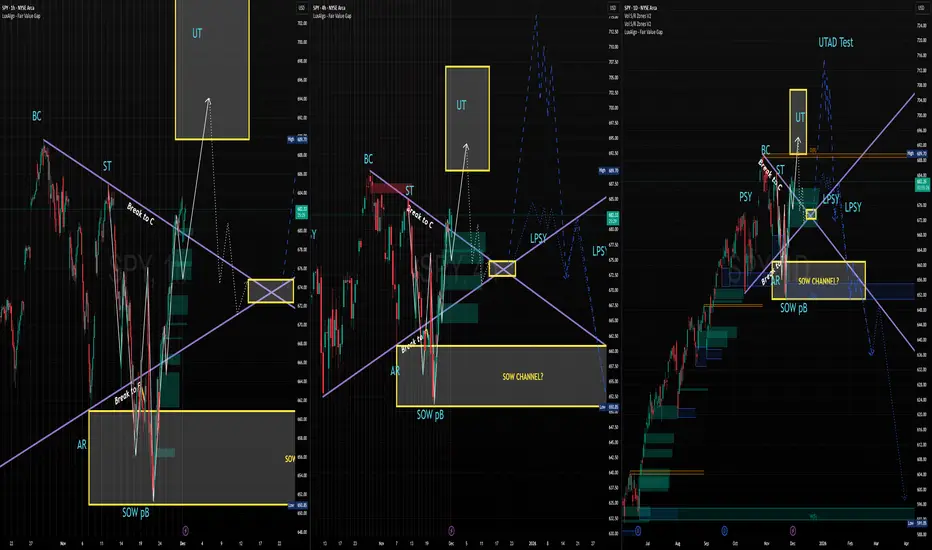
15M/30M Possible Wyckoff Distribution on $SPYFor tomorrow for me it's pretty simple, looking at the 15M and 30M charts.
Break above $685 with some force and I re-analyze what I thought was a Wyckoff Distro on the 15M/30M charts.
Chop between $683 & $685, then look for a break below $685 and it aligns with Phase C > Phase D LPSY.
Not financial advice, I am a regard.

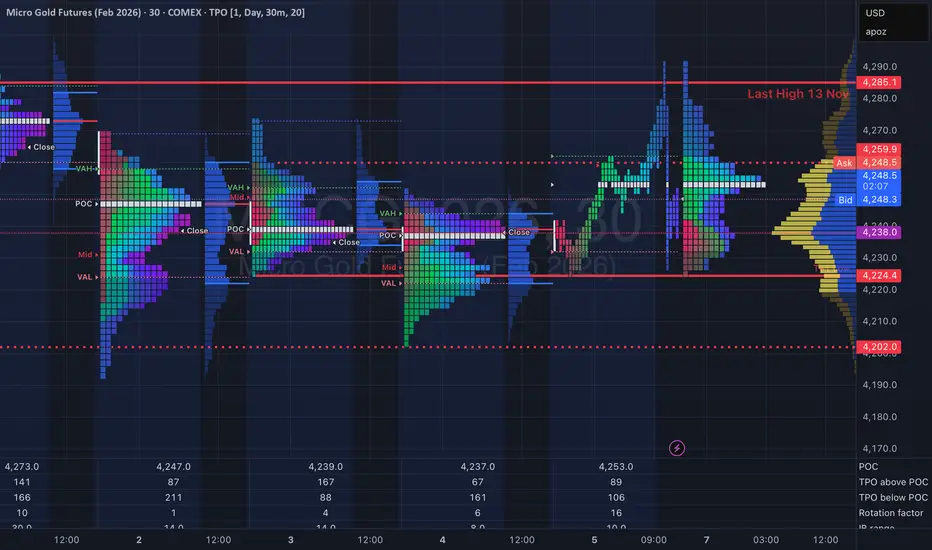
Balancing Range & The 4190 PivotCOMEX:GC1! COMEX_MINI:MGCG2026 FOREXCOM:XAUUSD
Traders. Update on the current auction structure.
Market Context (No New Money): We have yet to see any "New Money" or Initiative Buying enter the market. Yesterday developed as another Balance Day, capped by some late-session liquidation.
The Reality: The auction remains range-bound between 4,290 (High) and 4,190 (Low). Without a fresh catalyst, price is simply rotating within this established bracket.
Structure & Key Levels:
Bullish Scenario: If Gold can hold acceptance above Yesterday's Low, the rotation favors a re-test of the upper distribution around 4,260 – 4,270 later this week.
Bearish Scenario: The line in the sand is 4,190. A breakdown and acceptance below this level changes the context significantly, likely dragging the auction down to repair the November Balance Area (~4,100).
Plan:
Stance: Neutral / Range Trading.
Execution: Fading the extremes of the 4290-4190 range until we see a breakout with volume confirmation.
Talk to you for the next update.

Short Covering vs. New Money (Waiting for the Catalyst)COMEX:GC1! COMEX_MINI:MGCG2026 FOREXCOM:XAUUSD
Traders. Mid-week context check as we wait for institutional commitment.
Market Context (The Mechanical Bounce): As noted in the previous update, yesterday's rotation was driven by Short Covering—old money exiting profitable shorts—rather than Initiative Buying (New Money) entering fresh longs.
The Trap: Short covering can lift the auction, but it lacks the sustained energy to break new highs. We are seeing price drift without aggressive volume.
Inventory: We are currently balancing above the Previous Week High (PWH). This zone is holding, but the auction feels "heavy" without fresh inflows.
The Fundamental "Hold" (Why Big Funds are Waiting): "Big Funds" are likely sidelined ahead of the tier-1 data dump. They need clarity before deploying serious capital for the week.
Today (Wed): ADP Payrolls & ISM Services.
Friday: The NFP (Non-Farm Payrolls).
The Reality: Until these numbers drop, we may remain in a "chop" or "balance" phase as institutions hedge rather than commit.
Plan & Execution:
Bias: Slightly Long, strictly conditional on holding above the PWH.
The Trigger: I need to see Follow Through. We need a volume spike (Initiative Buying) to confirm that "New Money" has arrived to defend this breakout.
Caution: If we fail to find acceptance higher and lose the PWH, expect a rotation back inside the previous balance to find liquidity.
Talk to you for the next update.

Liquidation Break & The "New Money" TestCOMEX:GC1! COMEX_MINI:MGCG2026 FOREXCOM:XAUUSD
Following up on the previous context regarding the "Thin Structure Repair."
Market Context (The Repair): As anticipated, the auction corrected lower to repair the thin profile left behind by the holiday drift.
Monday: Developed as a Balance Day, digesting the recent move.
Today: We saw a Liquidation Break early in the session, effectively flushing out weak hands, followed by a rotation back up.
Structure & Inventory (The "Tell"): The current bounce is characteristic of Short Covering (old money exiting winning shorts) rather than Initiative Buying (new money entering longs).
The Trap: Short covering can rally price, but it is mechanical and temporary. It creates a "hollow" move if not supported by fresh volume.
The Requirement: To re-test and break the All-Time Highs, we need to see "New Money" step in. Without this sustained buying flow, the auction will lack the energy to hold higher prices.
Plan & Execution:
Stance: Cautious / Monitoring for flow confirmation.
Scenario A (Bullish): If we see aggressive Initiative Buying absorbing offers above the short-covering highs, we target the ATH.
Scenario B (Bearish): If the rally stalls and "new money" fails to show up, expect the market to rotate deeper to find supportive bids (value) at lower levels.
Talk to you for the next update.

AUDUSD – Expansion Origin RetestEducational idea only – not financial advice.
Price completed a clean cycle:
Accumulation range
Liquidity sweep (spring)
Bullish displacement
Re-accumulation at the top
There’s still an unmitigated FVG at the origin of the expansion.
If price pulls back into that zone, I’ll wait for an MSS confirmation before looking for longs.
Bias stays bullish as long as that demand zone holds.

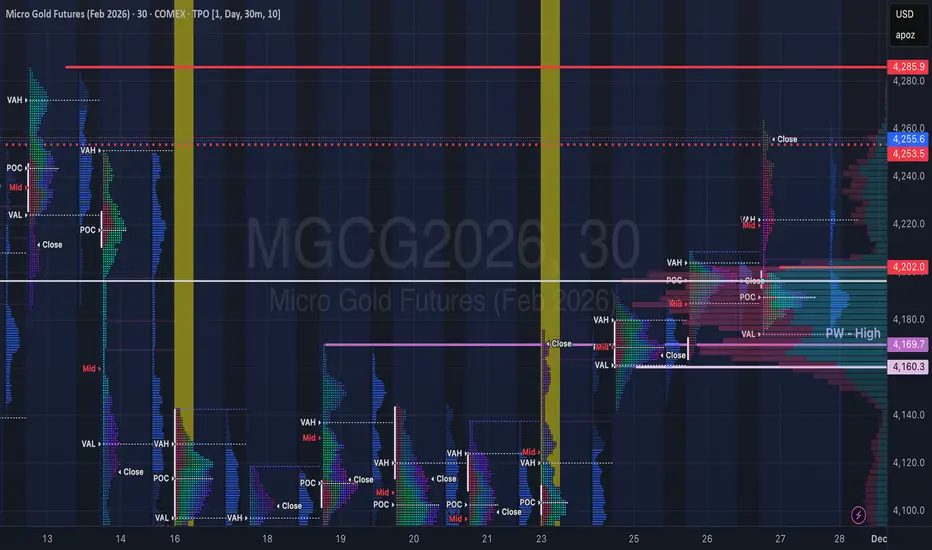
Thin Structure Repair & ATH ProximityCOMEX:GC1! COMEX_MINI:MGCG2026
Market Structure (The Problem):
The rally into this new high was built on a very thin profile. The auction moved higher emotionally on low holiday volume, leaving a series of single prints/low volume nodes (LVN) below current price.
The Theory:
In Market Profile, "thin" structures are fragile. The market often needs to rotate back down to "repair" this structure—backfilling the volume to prove that buyers actually exist at these higher prices.
Context & Seasonality:
ATH Proximity: We are striking distance from All-Time Highs. The air is thin up here, and without strong volume support, a breakout is prone to failure.
Time Constraint: We have a short trading window (runway) before Christmas and Year-End book squaring. Liquidity will likely be sporadic.
Plan & Execution: Heading into the US Open, I am cautious of this rally.
Stance: Flat / Monitoring.
The Setup: I am looking for a correction to repair the thin profile below.
Execution: If the market rotates down and finds acceptance (buyers) within that thin structure, it validates the trend. If it slices through, the rally was a fake-out.
Let's see how the auction develops today.
Talk to you for the next update.
KLCI CONTINUE TO SELLThis is an update from my previous post
-Kindly refer to the link attached
Persistent weakening, Dominating tape of Weakness from Leaders.
I view all rallies as nothing more than a 'counter-trend' rally, in which ,
spots for the institutions to sell their positions
Bar @ 28/11/25 (red arrow), formed A spring-type action [/b ].
Penetrated the Ice-Line (bold black line)
- given today's incomplete bar (1/12/25), im still humbly bearish on market.
no position at the moment, 100% cash sitting.
Until condition improve, im sitting tight awaiting next opportunity.
In a Bear market, weakness beget more weakness
i always reminding myself : do not be confuse . As strength in weakness, during bear market, is different as compared to, strenght in weakness, during bull market.
**TradingView doesnt provide vol data for KLCI. Need to refer other source.

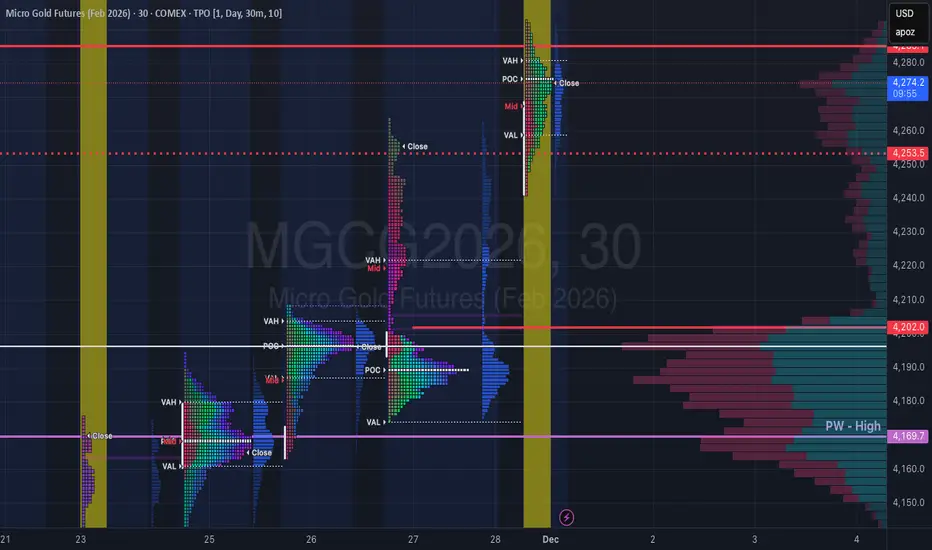
Gold Context: December Open & Holiday Inventory CheckCOMEX_MINI:MGCG2026 COMEX:GC1!
Traders. Here is the context update as we transition into the new month.
Market Context (Holiday Drift): The auction drifted higher on thin volume during the Thanksgiving and Black Friday shortened sessions. This extension was largely driven by a lack of sellers rather than aggressive buying, leaving us with a "thin" structure.
Structure & Inventory: We have significant inventory resting back at 4200 – 4170, sitting just above the Previous Week High (PWH).
Current Action: Price is holding the holiday extension.
The Problem: The move up lacks heavy volume support. We have "unfinished business" below at the breakout zone.
Plan & Execution: Monday marks the start of fresh December flows. I am not interested in chasing this extension at these highs.
Stance: Flat / Patient.
The Test: I want to see Gold rotate back to test the inventory at 4200 – 4170 first.
Decision: We need to verify if buyers will defend this zone (turning old resistance into support) before committing to a new directional bias.
Talk to you for the next update.
AMC Accumulation I believe NYSE:AMC has been in a large accumulation starting around April 24'. The most recent break below the range on decreasing volume leads me to believe we are in Phase C. In order for this to be a Spring, we need to see strong volume come into the upside to break back into the range and a test of Supply. A break above Supply would be a Sign of Strength. (SOS) While many scream fundamentals, I choose to trade the chart. With that said, a strong Q4 could flip net profit positive. (HUGE) I see deep value in AMC if they can pull off profitability in Q4. This is just my opinion and what I see on the chart. I am focused on the Wyckoff events and phases. As far as timing, I wish I could remove the dates below the chart. This is my thesis.
Originally posted on Nov. 19th. Had to remove due to educational link to external source explaining what accumulations and distributions are.

Bulls Will Take BTC to 100k Then Become Leftover Turkey Dinner!Trading Fam,
First things first, Happy Thanksgiving to my U.S. followers. I hope your holiday is blessed as you enjoy time with friends and family.
Let's get to the chart.
As noted numerous times in previous posts, BTC is now in a longer-term bearish trend. There are many indicators that have shown us this.
Our first signs came when my indicator flashed a rare sell signal
This coincided with the third touch of our Pi Cycle Top Trendline
It also formed what I thought at the time might be the "spring" of our Wyckoff Market Cycle pattern
After these first three important indicators flashed, I waited for a drop below the support (RED descending TL) of our bearish megaphone pattern. That happened.
Finally, we almost synchronized that drop with the drop below our 350 SMA
I have a target down of 72-76k. We almost reached that but we were stopped by 80k support. That RED ascending TL prints on the weekly starting with one of our tops in April of 2021!
We bounced off of this trendline, using it as strong support. It should be and I expected this bounce! Now, I am expecting we should go to at least 100-102k. Even that is a very underwhelming target. I will NOT be impressed at all if the bulls should succeed at hitting it. This, at least, should be expected!
If we don't hit that target, I will be wrong about how bearish I should have been. Even the "Buy the Dip" Viagra being sold by all these whales as exit liquidity will not have worked for these bulls. What a disappointment they will have become! And my target of 72-76k will still be in play.
But you can all see that I have a question mark there. See, the thing is, what happens when Michael Saylor's Microstrategy goes underwater? Microstrategy owns nearly 650k BTC at an avg cost of 74.5k. Current strategy is: issue shares → raise debt → buy BTC → repeat. If BTC falls below 74.5k it could become: buy back shares → lower debt → sell BTC → repeat. If this occurs, BTC could drop even further. My next serious support is not found until around 46k! Therefore, we have to keep a serious eye on this area of 72-76k if we do in fact visit it.
Now, if bulls do beat 102k and then 110k after that, I think I can admit I was wrong. I missed my downside target by a whopping 4k! I will admit defeat even though I was a small fraction of a coin off. Honestly, I hope I am wrong. I hope the market is revived and Santa gives you all the profit you ever wanted for the Christmas season. But the grinch in me thinks not.
So, play this rally as you like. Personally, I think it's an early gift to some of you who were not expecting this or just didn't believe it would occur. You now have your second chance to exit. This is a contrarian view. I know. But think about who might be propagating the "Buy the Dip" memes. I alluded to it above. If I were a whale and wanted to exit without crashing the market how would I best do this? Ding, ding, ding. That's right. I'd market the hell out of "Buy the Dip". It would become the meme of the hour. Retail would buy it up and hopefully provide the exit liquidity I need. This might be my only way out if I were looking for it.
Something to think about.
✌️Stew
