Gold next week Key S/R Levels and Outlook for Traders🔥 GOLD WEEKLY SNAPSHOT — BY PROJECTSYNDICATE
🏆 Swing High / Swing Low
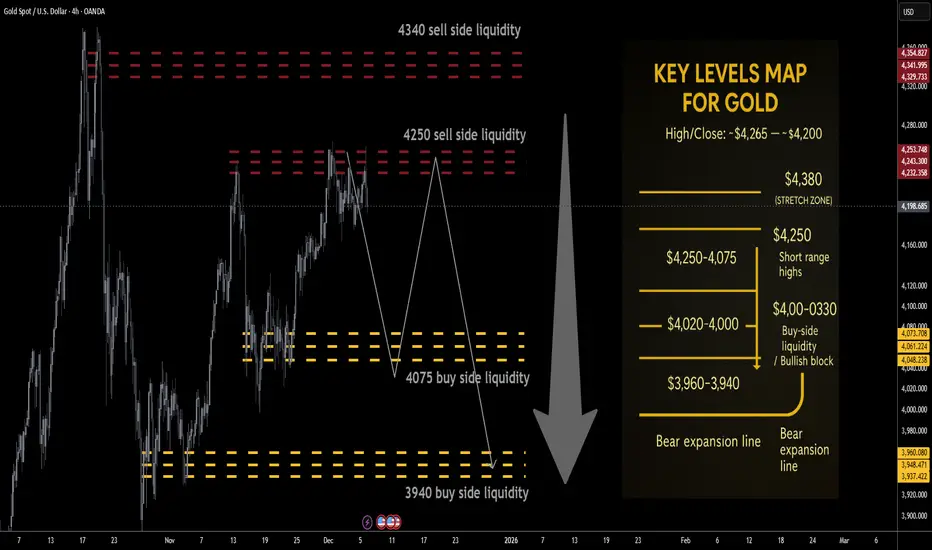
$4,265 → ~$4,164 — clean rejection from the 4,26x breakout zone with a long upper wick, but weekly close still near $4,200, keeping price pinned in the upper part of the broader $4k range.
📈 Trend
Higher-timeframe: Structural bull trend intact while price holds above the $3,940–$4,000 block.
Tactical: Last week’s failed extension above $4,250 and the close back near $4,200 tilt the tape into distributive mode:
Rallies into $4,250 / $4,340 = sell-side liquidity magnets.
Downside liquidity sits lower at $4,075 / $3,940, making upside risk/reward look asymmetric to the downside from current levels.
🛡 Supports – Buy-Side Liquidity / Downside Objectives
$4,130–$4,100:
Short-term intraday pivot where buyers repeatedly stepped in last week; first micro-reaction zone on any flush.
$4,090–$4,075 🟢 Buy-side liquidity #1
First true BSL pocket below the close; ideal TP1 for shorts from above and a spot where responsive dip-buyers are likely to probe.
$4,020–$4,000:
Psychological shelf; loss of 4k would confirm that local distribution is winning and open the deeper BSL run.
$3,960–$3,940 🟢 Buy-side liquidity #2 / structural block
Higher-timeframe demand and key liquidity magnet for a fuller corrective leg. A sustained break/acceptance below $3,940 would signal that the 2025 blow-off is transitioning into broader mean-reversion rather than shallow consolidation.
🚧 Resistances – Sell-Side Liquidity / Short-Side Focus
$4,220–$4,250 🔴 Sell-side liquidity #1
First overhead supply from the prior week’s failed breakout structure and just under recent highs. Clean area for “sell the rip” probes and for late longs to de-risk.
$4,300–$4,340 🔴 Sell-side liquidity #2
Extension / SLI pocket aligned with the upper part of last week’s range and just below the prior $4,38x–$4,40x all-time high band. Ideal for scaling adds if a news-driven squeeze runs stops above 4,250.
Stretch: $4,380–$4,400:
Prior record spike / stop-run area; only expected on a full-on squeeze into the Fed, but a tag here would likely be exhaustion rather than a new sustainable trend leg higher.
🧭 Bias Next Week
Base tactical bias: fade strength / short rallies, not chase upside.
the tape favors a liquidity grab higher → rotation lower scenario:
Look for wicks into $4,220–$4,340 to be sold.
Downside path of least resistance: $4,090–$4,075 → $4,020–$4,000 → $3,960–$3,940.
⚖️ Base Case Scenario
Open/early week:
Price opens near $4,200 and either trades flat or spikes briefly into $4,220–$4,250 on weekend gap/early flow.
Liquidity sweep into resistance:
Rejection from SLI:
Failure to accept above $4,250/4,300 leaves upper wicks on 4H/daily, signaling distribution.
Rotation into BSL:
First objective: $4,090–$4,075 (TP1)
Secondary objective: $4,020–$4,000 (TP2)
Stretch / full flush: $3,960–$3,940 (TP3) into the structural demand block and buy-side liquidity pocket.
🚀 Breakout / Invalidation Trigger
Bearish framework invalidation:
A strong daily/weekly acceptance above $4,380 would imply shorts caught offside and re-open the path toward $4,450+ in line with the higher Street targets for 2026.
In that case, shift from short-the-rip → neutral / buy shallow pullbacks until a new top structure forms.
🔓 Bull / Bear Trigger Lines
Structural bull line:
Above $3,940–$4,000: long-term bull structure remains intact. Even if you’re tactically short, treat deep moves into this area with respect – this is where higher-timeframe players are likely to re-accumulate.
Bear expansion line:
Below $3,940: opens scope for a faster liquidation wave toward $3,880–$3,850 and potentially a broader 2025–26 consolidation phase instead of immediate continuation higher.
🧭 Recommended Strategy – Short at Market Open
⚠️ Illustrative trade plan, not financial advice. Size and risk-manage according to your own rules.
1️⃣ Primary Short – Open + Fade the Rips
Short at/near market open around the $4,195–$4,210 zone if price opens below $4,220 and orderflow confirms rejection of higher bids.
Add / build zones:
Add 1: into $4,220–$4,250 (first SLI band / prior breakout zone).
Add 2 (only if spike): $4,300–$4,340 (second SLI; look for clear blow-off / stop-run behavior before loading the last clip).
Stops / invalidation:
Tactical stop: hard stop above $4,380.
More conservative: soft line at $4,340, hard stop $4,390–$4,400 to allow for intraday wicks.
Targets (aligned with buy-side liquidity):
TP1: $4,090–$4,075 → take partials and reduce risk.
TP2: $4,020–$4,000 → core target for the week if distribution plays out.
TP3: $3,960–$3,940 → full BSL sweep into structural demand; expect responsive buying attempts here.
XAG USD (Silver / US Dollar)
XAG/USD: Major Resistance Cleared, What Comes Next?🥈 XAG/USD — SILVER VS U.S. DOLLAR
Metals Market • Swing / Day Trade Opportunity Guide 🧭📈
⚙️ Market Outlook — Bullish Confirmation
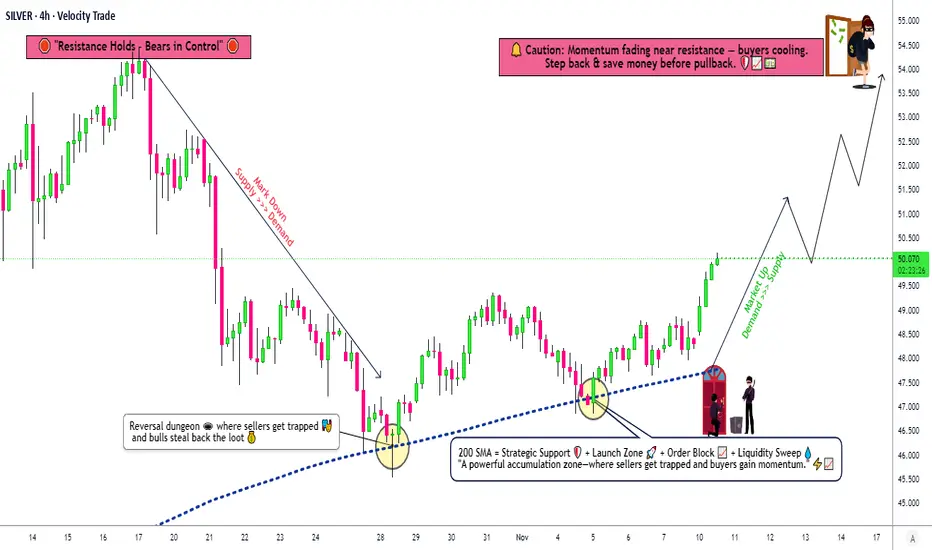
Silver has broken through a major resistance zone, shifting momentum firmly into bullish territory.
This breakout signals the presence of strong buyers stepping in, making the market attractive for both short-term and swing-trade setups.
🎯 Trade Plan
📌 Entry:
Enter at any available level after the confirmed breakout retest.
Bullish continuation patterns are forming, giving us a clean pathway to the upside.
🛡️ Stop Loss — Thief Style SL @ 57.000
Dear Ladies & Gentlemen (Thief OG’s), secure your capital wisely.
Adjust SL according to your personal system, risk appetite, and style.
I do not recommend copying my SL blindly — your strategy = your rules.
🎯 Target — Profit With Precision @ 62.000
We have:
🧱 Strong resistance zone
🔥 Overbought conditions expected
🎭 Potential bull-trap areas above
So escape with profits once the market hits our zone.
Dear Ladies & Gentlemen (Thief OG’s), your TP is also your choice — manage your profits with discipline.
🔗 Correlated & Related Pairs to Watch ($ Versions Included)
Tracking these helps confirm momentum, spot divergences, and follow overall metals sentiment.
1️⃣ XAU/USD (Gold vs USD) — TVC:GOLD
Why watch?
Gold and Silver often move together due to safe-haven demand.
When Gold surges strongly while Silver lags, Silver usually follows.
If Gold rejects from resistance, Silver may also cool off.
Key Point:
Gold strength = higher probability continuation in Silver’s bullish wave.
2️⃣ XAU/XAG (Gold-to-Silver Ratio) — $GoldSilverRatio
Why watch?
A falling ratio means Silver is gaining strength faster than Gold.
A rising ratio signals Silver weakness.
Key Point:
A drop in the ratio supports our bullish Silver narrative.
3️⃣ DXY (US Dollar Index) — TVC:DXY
Why watch?
Silver is priced in USD.
When DXY drops, metals typically rise due to USD weakening.
Key Point:
If TVC:DXY shows bearish momentum → Silver bullish continuation is more confident.
4️⃣ XAG/EUR (Silver vs Euro) — OANDA:XAGEUR
Why watch?
Useful to understand Silver’s global demand, not just USD-denominated.
If Silver is bullish across currencies, then the trend is fundamentally strong.
Key Point:
Multi-currency strength confirms genuine Silver demand.
5️⃣ Copper Futures (HG) — CAPITALCOM:COPPER
Why watch?
Silver has partial industrial demand.
When copper rises, it signals industrial activity strength → bullish for Silver.
Key Point:
Copper strength = supportive macro backdrop for Silver.
🧠 Final Outlook
A clean breakout, supportive cross-metal correlations, and favorable USD weakness give Silver an attractive path toward 62.000.
Trade smart, protect your capital, lock in profits, and execute like true Thief OG’s. 🥷📊

Silver Pauses After ATH RunLast week, silver printed a series of new ATHs.
However, after Monday’s one, each subsequent high was only marginal, and the market shifted into a consolidation box — very similar to gold’s recent price action.
The uptrend is still dominant, but for a new accelerated bullish leg, silver needs a clean break above 59.
If that happens, the measured move points toward a target near 61.
On the downside, if bulls lose control of the 57 zone, the most probable outcome becomes a drop toward 54.
For now, it’s a classic wait-and-see environment.

Part 2 - Analysis on Silver and trade setupThis is the second party of a previous video I did on XAGUSD (although accidentally called it UJ in the title of the last video).
I hope you find it insightful. All the analysis is included in the video. Also some teaching.
- R2F Trading

Natural Gas Stock Forecast | Oil | Dollar | Silver | GoldNatural Gas Stock Forecast | Oil | Dollar | Silver | Gold
NYMEX:NG1! NYMEX:CL1! COMEX:GC1! COMEX:SI1!

XAG/USD Key Zone Reaction – Are Bulls Ready to Take Control?🥈 XAGUSD: SILVER VS US DOLLAR 💰
Metals Market Opportunity Blueprint | Swing Trade Analysis
📊 MARKET STRUCTURE & SETUP
✅ Current Price Action: $48.34 | 52-Week Range: $28.16 - $54.50
✅ Technical Trend: Bullish Bias Confirmed
✅ Setup Type: Double Pullback Retest of 200 SMA
🎯 THE THIEF STRATEGY: LAYERED ENTRY APPROACH
This is NOT a single entry point strategy. We employ the THIEF LAYERING METHODOLOGY — multiple limit orders positioned at strategic support zones to maximize entry efficiency and reduce average entry price.
📍 ENTRY LAYERS (Buy Limit Orders):
Layer 1: $48.000 ⭐ (Immediate Support)
Layer 2: $48.500 ⭐ (Pullback Zone)
Layer 3: $49.000 ⭐ (Resistance Break)
Layer 4: $49.500 ⭐ (Extended Support)
💡 Pro Tip: You can increase/decrease layers based on your risk tolerance and position size. Accumulate, don't dump!
🛑 STOP LOSS MANAGEMENT
📌 Thief Original SL: $47.000
⚠️ This is MY suggested level based on technical structure
🔴 IMPORTANT: Dear Ladies & Gentlemen (Thief OG's) — Set YOUR OWN stop loss based on YOUR risk profile
💪 This is YOUR money, YOUR risk, YOUR decision
Adjust SL based on your strategy, account size, and risk/reward ratio
🚀 PROFIT TARGET STRATEGY
🎪 Target Zone: $54.000
📈 Technical Basis: 200 SMA acts as strong dynamic resistance
⚡ Market Structure: Overbought territory warning
🔔 Trap Alert: Potential sell-side liquidity trap at resistance
⚠️ Target Notes:
🔴 IMPORTANT: Dear Ladies & Gentlemen (Thief OG's) — Set YOUR OWN take profit target
📊 Don't just copy my TP blindly — analyze price action yourself
💼 You earn the profits, you manage the exit — YOUR choice, YOUR reward
Consider trailing stops or partial profit-taking strategy
🔗 CORRELATED PAIRS TO MONITOR (Key Dollar Pairs)
1️⃣ TVC:DXY (US Dollar Index)
Correlation: INVERSE ↔️ As DXY strengthens, XAG/USD weakens
Why Monitor: Strong dollar headwind for silver prices
Watch Level: DXY above 105.00 = bearish for silver
Strategy: If DXY rallies, reduce silver long positions
2️⃣ $XAU/USD (Gold vs Dollar)
Correlation: POSITIVE ✅ Silver follows gold's lead
Why Monitor: Gold is the "big brother" in precious metals
Watch Level: If gold breaks $2,100, silver likely follows
Strategy: Gold weakness = caution on silver longs
3️⃣ FX:EURUSD (Euro vs Dollar)
Correlation: INVERSE ↔️ Weak dollar = strong euro
Why Monitor: Dollar weakness supports precious metals
Watch Level: EURUSD above 1.1200 = bullish for silver
Strategy: Strong euro environment = tailwind for XAG
4️⃣ FX:USDJPY (Dollar vs Japanese Yen)
Correlation: INVERSE ↔️ Dollar weakness supports risk-on sentiment
Why Monitor: Risk appetite indicator (yen often "fear" currency)
Watch Level: USDJPY below 145.00 = risk-on (silver bullish)
Strategy: Lower USDJPY = better environment for commodities
5️⃣ SP:SPX / S&P 500 Index
Correlation: POSITIVE ✅ Risk-on markets support commodities
Why Monitor: Stock market rallies often lift precious metals
Watch Level: SPX new highs = bullish momentum for silver
Strategy: Market strength = broader bullish sentiment
📋 TRADE CHECKLIST BEFORE ENTRY
✅ Price action confirms double pullback on 200 SMA
✅ DXY showing weakness or neutral bias
✅ XAU/USD supporting bullish thesis
✅ No major macro events in next 4-6 hours
✅ Volume confirmation on breakout
✅ Risk/Reward ratio minimum 1:2
✅ Position size = % of account (YOUR decision)
⚡ KEY TRADING RULES
Layering ≠ Averaging Down Losers
Build positions at PRE-PLANNED levels only
Don't add to losing positions outside your strategy
Stop Loss is Sacred
NO moving stops to breakeven without reason
Protect capital first, chase profits second
Take Profits Strategically
Partial exits: Scale out at resistance zones
Don't go all-in, don't take all-out at once
Dollar Monitoring is Mandatory
Strong DXY = reconsider position
Weak DXY = stay long with conviction
Risk Management Over Everything
Your SL & TP = your rules
No trade is worth emotional decision-making
Silver Outlook Turning Stronger — Bullish Setup in Play!🥈 XAG/USD SILVER SURGE | Bullish Swing Trade Setup 📈
🎯 TRADE SUMMARY
Asset: XAG/USD (Silver vs US Dollar) | Metals Market 💰
Strategy: Swing Trade | Bias: BULLISH ⬆️
Risk/Reward: Professional Grade | Timeframe: Multi-Day Setup
📍 ENTRY STRATEGY - LAYERED APPROACH 🔄
Recommended Entry Zones (Multiple Buy Limit Orders)
1st Entry: $49.000 - Initial Position 20% 📌
2nd Entry: $49.500 - Add Position 30% 📌
3rd Entry: $50.000 - Final Entry 50% 📌
Strategy: Use limit orders at each level for better execution. Scale in progressively to optimize average entry price. This approach reduces risk and increases position efficiency.
🛑 STOP LOSS
Recommended SL Level: $48.000
⚠️ RISK DISCLAIMER: This is a suggested level based on technical structure. You must adjust your stop loss according to YOUR personal risk management, account size, and trading strategy. There is NO one-size-fits-all SL - ownership of risk is yours alone.
🎪 PROFIT TARGETS 🚀
Primary Target: $54.000
Confluence Factors:
Strong Resistance Zone Identified ✓
Overbought Condition Setup ✓
Potential Trap/Correction Reversal ✓
Bullish Breakout Extension ✓
⚠️ TP DISCLAIMER: This target is based on technical analysis. You control your profit-taking strategy. Consider taking partial profits at key resistance levels. Lock in gains at YOUR discretion - this is YOUR trading decision.
🔗 CORRELATED PAIRS TO MONITOR 📊
1️⃣ DXY (US Dollar Index) - INVERSE CORRELATION
Why: Silver prices move inversely to dollar strength
Watch For: If DXY weakens 📉, XAG typically strengthens 📈
Key Level: Monitor 103.50-105.00 zone
2️⃣ EURUSD - INDIRECT CORRELATION
Why: Euro strength correlates with silver strength (risk-on sentiment)
Watch For: EURUSD above 1.1000 supports silver bullish bias
Key Level: 1.0950-1.1050 range critical
3️⃣ GOLD/USD (XAU/USD) - POSITIVE CORRELATION
Why: Precious metals move together in risk-off/on scenarios
Watch For: Gold breaks above 2,700 = Silver momentum likely follows
Key Level: XAU/USD 2,650-2,750 zone
4️⃣ SPX500 (S&P 500) - RISK SENTIMENT
Why: Equities strength supports risk-on sentiment, bullish for silver
Watch For: SPX breaks 6,000+ supports precious metals outflow
Key Level: 5,850-6,050 pivot zone
5️⃣ COPPER/USD (HG) - INDUSTRIAL DEMAND
Why: Copper demand correlates with economic growth = Silver bullish signal
Watch For: HG above 4.30 = Risk-on sentiment confirmed
Key Level: 4.20-4.35 critical range
📈 KEY TECHNICAL POINTS
✅ Bullish Structure: Lower highs/lows pattern breaking
✅ Momentum: Building strength in watch zone
✅ Risk/Reward: Favorable 1:2+ setup
✅ Entry Precision: Multiple confirmation levels
✅ Exit Clarity: Clear profit target defined
⚡ QUICK TRADE CHECKLIST
Confirm DXY weakness before entry
Check Gold (XAU/USD) above 2,650
Verify EURUSD above 1.0950
Set all 3 limit orders at entry zones
Place SL at 48.000 (adjusted to YOUR risk)
Divide position into TP tranches
Monitor correlated pairs daily
🎓 TRADER'S NOTES
This analysis reflects current technical structure as of publication. Market conditions evolve. Adjust strategy based on:
Market news/data releases
Central bank decisions
Geopolitical events
Real-time price action
Remember: Past performance ≠ Future results. Trade with discipline. Manage risk first, profits follow.
💡 LIKE if helpful | 📌 SAVE for reference | ✅ FOLLOW for updates
Technical Analysis | Swing Trading | Metals Market | XAG/USD Strategy

Stop!Loss|Market View: GOLD🙌 Stop!Loss team welcomes you❗️
In this post, we're going to talk about the near-term outlook for GOLD ☝️
Potential trade setup:
🔔Entry level: 4167.192
💰TP: 3900.356
⛔️SL: 4370.061
"Market View" - a brief analysis of trading instruments, covering the most important aspects of the FOREX market.
👇 In the comments 👇 you can type the trading instrument you'd like to analyze, and we'll talk about it in our next posts.
💬 Description: After breaking out of the accumulation in a symmetrical triangle, gold prices formed an accumulation near the 4200 level, indicating the emergence of a potential limit seller who, after breaking out of the accumulation, will sell the instrument to those willing to buy at the breakout. Against this backdrop, a downward movement is likely expected, and given the potential volatility this week, two scenarios are being considered.
Thanks for your support 🚀
Profits for all ✅

Silver sideways consolidation, resistance retest The Silver remains in a bullish trend, with recent price action showing signs of a corrective pullback within the broader uptrend.
Support Zone: 5420 – a key level from previous consolidation. Price is currently testing or approaching this level.
A bullish rebound from 5420 would confirm ongoing upside momentum, with potential targets at:
5875 – initial resistance
6000 – psychological and structural level
6106 – extended resistance on the longer-term chart
Bearish Scenario:
A confirmed break and daily close below 5420 would weaken the bullish outlook and suggest deeper downside risk toward:
5350 – minor support
5275 – stronger support and potential demand zone
Outlook:
Bullish bias remains intact while the Silver holds above 5420. A sustained break below this level could shift momentum to the downside in the short term.
This communication is for informational purposes only and should not be viewed as any form of recommendation as to a particular course of action or as investment advice. It is not intended as an offer or solicitation for the purchase or sale of any financial instrument or as an official confirmation of any transaction. Opinions, estimates and assumptions expressed herein are made as of the date of this communication and are subject to change without notice. This communication has been prepared based upon information, including market prices, data and other information, believed to be reliable; however, Trade Nation does not warrant its completeness or accuracy. All market prices and market data contained in or attached to this communication are indicative and subject to change without notice.

Weekly Market Outlook (Week 50)🔘 EURUSD
The pair is currently likely testing a critical resistance zone around 1.1730. A rebound from this level would be consistent with the global bearish trend, but a sustained break above 1.1750 could trigger a reversal of the long-term structure.
🔘 GBPUSD
The price has reached resistance near 1.3330. The medium-term outlook remains bearish unless the bulls can achieve a close above the 1.3500 zone; failure here will target a reversal towards 1.3190.
🔘 AUDUSD
While the short-term momentum is bullish, the underlying trend suggests that selling pressure could resume at the 0.6700 resistance level, targeting the 0.6620 support.
🔘 USDJPY
Following a breakdown from a "Wedge" pattern, the pair is retesting the broken structure from below, signaling bearish continuation. The price remains capped by the descending trendline, with a likely target at the 154.00 support level if sellers defend this correction.
🔘 XAUUSD
Gold is compressing within a massive "Triangle" pattern near all-time highs, hovering around 4200. Traders should be cautious of a "False Breakout" above 4250.
🔘 XAGUSD
Silver is trading within a steep ascending channel but is currently reacting to strong resistance at 58.35 - 59.00. A technical correction towards the channel midline or the 56.00 support level is probable.
🔘 BTCUSD
Bitcoin is showing a local bullish signal. A successful flip of the 92,000 resistance into support would confirm a bullish breakout, opening the door for a retest of the highs near 96,000.
🌍 Fundamental Analysis: Investors are bracing for high volatility this week as the focus shifts entirely to the Federal Reserve's upcoming policy decision, with markets currently pricing in an 85-95% probability of an interest rate cut. The US Dollar has been under significant pressure following recent weak labor data, pushing major pairs like EURUSD into key resistance levels. However, technical resistance from DXY competitors calls for caution, especially if the Fed acts less dovish than expected.

The AI Boom's Unsung HeroThe rise of artificial intelligence isn’t just shaking up tech companies it’s quietly transforming the global silver market in a big way. As major players like NVIDIA, Google and others ramp up their AI infrastructure silver is becoming more critical than ever. Why? Because silver, thanks to its unmatched electrical conductivity, plays a key role in powering the hardware behind AI.
Silver is the most conductive metal on Earth. That makes it perfect for high-performance computing something AI needs a lot of. It’s especially important in data centers and advanced semiconductors, where both electrical and thermal performance are mission-critical.
What’s really interesting is that AI servers tend to use two to three times more silver than traditional data center servers. That’s because AI workloads are more power-hungry, generate more heat and require more complex cooling and electrical systems. Simply put, more AI means more silver.
If there’s one company at the heart of this trend it’s NVIDIA. Analysts at Morgan Stanley expect NVIDIA to consume a staggering 77% of all silicon wafers used for AI accelerators in 2025 up from 51% in 2024. That adds up to around 535,000 300-mm wafers a year each of which contains silver in key components.
All of this AI growth is showing up in the numbers. Industrial silver demand hit an all-time high of 680.5 million ounces in 2024. The electronics industry alone uses around 250 million ounces per year and AI is now the fastest-growing part of that.
Despite all this demand, silver supply just isn’t keeping up. The market’s been in deficit for four straight years, with a total shortfall of 678 million ounces between 2021 and 2024. That’s roughly ten months of global mine output gone missing from the balance sheet.
It’s no surprise, then, that silver prices have been climbing fast. As of July 2025 silver’s up nearly 30% for the year. Looking further ahead I see room for silver to keep climbing:
In the short term (2025): $36–$42 per ounce seems realistic
By 2026: Potential for $50+ as more AI growth stays strong
AI isn’t just changing how we work, communicate, or compute—it’s literally reshaping the commodities that make this technology possible. Silver, once thought of mainly in the context of jewelry or coins, is now a backbone material for the AI revolution.

SILVER My Opinion! SELL!
My dear followers,
I analysed this chart on SILVER and concluded the following:
The market is trading on 58.349 pivot level.
Bias - Bearish
Technical Indicators: Both Super Trend & Pivot HL indicate a highly probable Bearish continuation.
Target - 57.776
Safe Stop Loss - 58.724
About Used Indicators:
A super-trend indicator is plotted on either above or below the closing price to signal a buy or sell. The indicator changes color, based on whether or not you should be buying. If the super-trend indicator moves below the closing price, the indicator turns green, and it signals an entry point or points to buy.
Disclosure: I am part of Trade Nation's Influencer program and receive a monthly fee for using their TradingView charts in my analysis.
———————————
WISH YOU ALL LUCK

Silver Hits New ATH — Major Reversal Zone Ahead? Bearish SetupSilver( OANDA:XAGUSD ) managed to increase by more than +20% over the last 10 trading days, creating a new All-Time High(ATH) and attracting the attention of many traders in the financial markets.
Silver is currently near Potential Reversal Zone(PRZ) , Yearly Resistance(5), Monthly Resistance(1), and the round number $60.00.
Silver also managed to break the support line, which indicates weakness in the uptrend.
In terms of classic technical analysis, silver managed to rise with the help of the ascending triangle pattern, but we must keep in mind that this pattern is a weak continuation.
In terms of Elliott Wave theory, silver is completing the main wave 5, and this wave could complete at PRZ.
Additionally, we’re noticing a Regular bearish Divergence(RD-) between the price peaks, which adds to the bearish sentiment.
I expect silver to drop to at least $55.10 after breaking the support zone($56.83-$56.37).
First Target: $55.10
Second Target: $53.73
Stop Loss(SL): $61.63(Worst)/$60.54
Do you think silver can go above $60?
💡 Please respect each other's opinions and express agreement or disagreement politely.
📌 Silver/ U.S. Dollar Analyze (XAGUSD), 4-hour time frame.
🛑 Always set a Stop Loss(SL) for every position you open.
✅ This is just my idea; I’d love to see your thoughts too!
🔥 If you find it helpful, please BOOST this post and share it with your friends.

XAGUSD H1 | Bearish Reaction Off Pullback ResistanceMomentum: Bearish
Price is currently below the ichimoku cloud.
Sell entry: 57.933
- Strong pullback resistance
- 61.8% Fib retracement
- 100% Fib projection
- Fair Value Gap
Stop Loss: 58.903
- Swing high resistance
Take Profit: 56.729
- Swing low support
High Risk Investment Warning
Stratos Markets Limited (tradu.com/uk ), Stratos Europe Ltd (tradu.com/eu ):
CFDs are complex instruments and come with a high risk of losing money rapidly due to leverage. 70% of retail investor accounts lose money when trading CFDs with this provider. You should consider whether you understand how CFDs work and whether you can afford to take the high risk of losing your money.
Stratos Global LLC (tradu.com/en ): Losses can exceed deposits.
Please be advised that the information presented on TradingView is provided to Tradu (‘Company’, ‘we’) by a third-party provider (‘TFA Global Pte Ltd’). Please be reminded that you are solely responsible for the trading decisions on your account. Any information and/or content is intended entirely for research, educational and informational purposes only and does not constitute investment or consultation advice or investment strategy. The information is not tailored to the investment needs of any specific person and therefore does not involve a consideration of any of the investment objectives, financial situation or needs of any viewer that may receive it. Past performance is not a reliable indicator of future results. Actual results may differ materially from those anticipated in forward-looking or past performance statements. We assume no liability as to the accuracy or completeness of any of the information and/or content provided herein and the Company cannot be held responsible for any omission, mistake nor for any loss or damage including without limitation to any loss of profit which may arise from reliance on any information supplied by TFA Global Pte Ltd.

SILVER (XAGUSD): Consolidation & Trading Plan
Silver keep coiling within a narrow range on a daily.
Depending on the side of its breakout, I expect 2
potential scenarios.
If the market breaks and closes above 59.0 - the resistance
of the range, expect a bullish continuation to 60.0 level.
If the market breaks and closes below 56.2 - the support
of the range, expect a down movement to 54.5
Alternatively, keep trading the market within the range,
buying from the support and selling from the resistance.
❤️Please, support my work with like, thank you!❤️
I am part of Trade Nation's Influencer program and receive a monthly fee for using their TradingView charts in my analysis.

GBPUSD: bullish breakout🛠 Technical Analysis: On the 4-hour timeframe, GBPUSD has decisively broken out of a long-term descending channel, signaling a major trend reversal. The price has reclaimed the moving averages and is currently consolidating above the 1.3300 level, forming a bullish continuation structure. A successful breakout above the immediate resistance at 1.3350 confirms the bullish momentum, targeting the next liquidity zone around 1.3476.
———————————————
❗️ Trade Parameters (BUY)
———————————————
➡️ Entry Point: Buy on the confirmed breakout (approx. 1.3340 – 1.3350)
🎯 Take Profit: 1.3476 (key resistance)
🔴 Stop Loss: Below the recent consolidation and support zone (approx. 1.3249)
⚠️ Disclaimer: This is a potential trade idea based on current analysis; market conditions and price direction are subject to change based on news factors and volatility.

Silver Might Be Accumulating Strength for the Next Leg UpAfter the massive 24% run from the late-November dip, silver is now consolidating between 56.40 and 59. The bullish rally's 41-degree-sloped trend has now broken and is currently being retested. This is not necessarily a bearish signal given the very steep slope and the 24% surge, but if silver manages to break out of the retest and clear the 59 resistance together, there is a chance for another leg higher.
The breakout above 50 was massive because that level has acted as resistance since the 1980s, and every time silver approached it in the past, it triggered months-long selloffs. Given that this is a historically key moment combined with favorable fundamentals, silver still has potential for more upside. However, a retreat below 56.40 could alter the short- to medium-term trajectory.

SilverXAGUSD
- Completed " 12345 " Impulsive Waves and " A " Correction Waves
- RSI - Divergence
- Resistance Level
- Break of Structure
- Fibonacci Level - 100.00% / 121.70%

USDJPY: ascending channel continuation🛠 Technical Analysis: On the 4-hour timeframe, USDJPY is trending within a well-defined ascending channel, recently finding support at the confluence of the channel's lower boundary and the 200 SMA. Price action has formed a falling wedge pattern near this support zone, which is a classic bullish continuation setup suggesting the correction is over. A breakout above the wedge's upper trendline is currently in progress, signaling a potential rally toward the channel's upper resistance levels.
———————————————
❗️ Trade Parameters (BUY)
———————————————
➡️ Entry Point: Buy on the confirmed breakout of the wedge (approx. 154.90 – 155.10)
🎯 Take Profit: 158.08 (key resistance), extended target at 160.00 (channel top)
🔴 Stop Loss: Below the recent support structure and SMA cluster (approx. 153.50 – 153.70)
⚠️ Disclaimer: This is a potential trade idea based on current analysis; market conditions and price direction are subject to change based on news factors and volatility.

XAGUSD Short Setup — Rejection at Key Supply ZoneSilver (XAGUSD) has tapped into a higher-timeframe supply zone around the $58.50 – $58.80 area and showed clear signs of exhaustion. After sweeping the highs, price failed to continue upward and shifted into short-term bearish structure on the 15-minute chart.
📌 Entry: around $57.90 – $58.00
📌 Stop-loss: above the liquidity sweep / supply zone (~$58.70)
📌 Take-profit: toward $56.40 – $56.60 (previous demand + imbalance fill)
➕ Confluences
Liquidity grab above the previous high
Multiple rejection candles at supply
Loss of bullish momentum and break of structure (M15)
High risk-reward ratio on continuation to downside
⚠️ What invalidates the setup?
A decisive move above $58.70 with strong bullish volume would invalidate the short bias and open room for continuation toward $59.50+.

SILVER REBOUND AHEAD|LONG|
✅ SILVER price is reacting off the anchored demand block, with displacement showing early signs of bullish orderflow returning.
A liquidity sweep beneath intraday lows suggests engineered sell-side delivery before a corrective move higher into the target zone.Time Frame 1H.
LONG🚀
✅Like and subscribe to never miss a new idea!✅

SILVER Free Signal! Buy!
Hello,Traders!
SILVER shows price reacting inside a fresh demand block after a liquidity sweep, signaling potential bullish displacement as long as the demand floor holds.
--------------------
Stop Loss: 5,643$
Take Profit: 5,780$
Entry: 5,700$
Time Frame: 1H
--------------------
Buy!
Comment and subscribe to help us grow!
Check out other forecasts below too!
Disclosure: I am part of Trade Nation's Influencer program and receive a monthly fee for using their TradingView charts in my analysis.

Silver potential drop incoming?Silver came to within whiskers of reaching $59, before easing lower in the last couple of days, and it is now disapplying a potential H&S pattern on the hourly. If the pattern's neckline at 56.45-56.50 area breaks, then we could potentially see a quick drop to the next support which comes in between $53.90 to $54.48. Within this zone, $54.22 is an interesting H1 level to watch for a potential bounce should we get to it.
By Fawad Razaqzada, market analyst with FOREX.com
