XAGUSD – Silver Shining Brighter Than Gold?
At this moment, Silver looks technically stronger than Gold – and here’s why:
• Last Monday’s drop: Both Gold and Silver fell sharply, but what followed made the difference. While Gold moved sideways in consolidation, Silver bounced faster and even printed a new local high at 38.80, touching key resistance.
• Friday’s candles: Gold closed the day with a bearish pin bar, while Silver showed the opposite – a bullish pin bar, signaling demand at lower levels.
• Asian session behavior: Gold made a new low, but Silver instead printed a higher low, adding further strength to the bullish case.
📌 Conclusion:
As long as 37.50 holds, Silver’s structure remains constructive.
• A confirmed breakout above 38.80 resistance will open the way for a new leg higher.
• In that scenario, I expect the 40+ zone to be tested.
Silver is quietly building relative strength against Gold – a signal traders shouldn’t ignore. 🚀
Disclosure: I am part of TradeNation's Influencer program and receive a monthly fee for using their TradingView charts in my analyses and educational articles.
XAG USD (Silver / US Dollar)

Discovery Silver is now in Blue Sky Territory
The stock has broken into new all-time highs with no resistance ahead.
Momentum is strong, and the upside potential is wide open. very bullish
not financial advice

Gold | Oil | Dollar | Silver | Natural Gas Price ForecastGold | Oil | Dollar | Silver | Natural Gas Price Forecast
COMEX:GC1! COMEX:SI1! AMEX:UNG NYMEX:CL1!

Should we wait for gold to rise? Yes.
Hello everyone
as shown in the figure, 4 channels have been drawn, and in each of the previous 3 channels, the price of gold has successfully broken the channel and entered the next channel. I believe that in the coming years we should see an increase in the price of gold. If you are looking for a safe investment, gold can help you.
What do you think?

XAGUSDHello Traders! 👋
What are your thoughts on Silver?
As shown on the chart, silver has broken its ascending trendline and already completed a retest (pullback) to the broken level. Currently, the price is trading below the key resistance zone and a descending trendline, indicating possible weakness ahead.
We anticipate that after some consolidation in this area, silver will likely move lower toward the marked support levels.
Bias remains bearish unless the price breaks and closes above the resistance area.
💬 What’s your view on silver’s next move? Share it below! 👇
Don’t forget to like and share your thoughts in the comments! ❤️

Silver sideways consolidation supported at 3753The Silver remains in a bullish trend, with recent price action showing signs of a continuation breakout within the broader uptrend.
Support Zone: 3753 – a key level from previous consolidation. Price is currently testing or approaching this level.
A bullish rebound from 3753 would confirm ongoing upside momentum, with potential targets at:
3875 – initial resistance
3913 – psychological and structural level
3954 – extended resistance on the longer-term chart
Bearish Scenario:
A confirmed break and daily close below 3753 would weaken the bullish outlook and suggest deeper downside risk toward:
3720 – minor support
3676 – stronger support and potential demand zone
Outlook:
Bullish bias remains intact while the silver holds above 3753. A sustained break below this level could shift momentum to the downside in the short term.
This communication is for informational purposes only and should not be viewed as any form of recommendation as to a particular course of action or as investment advice. It is not intended as an offer or solicitation for the purchase or sale of any financial instrument or as an official confirmation of any transaction. Opinions, estimates and assumptions expressed herein are made as of the date of this communication and are subject to change without notice. This communication has been prepared based upon information, including market prices, data and other information, believed to be reliable; however, Trade Nation does not warrant its completeness or accuracy. All market prices and market data contained in or attached to this communication are indicative and subject to change without notice.

Could we see a breakout on the Silver?The price is falling towards the support level which is an overlap support that lines up with the 38.2% Fibonacci retracement, and a breakout off this level could lead the price to drop from this level to our take profit.
Entry: 37.67
Why we like it:
There is an overlap support that lines up with the 38.2% Fibonacci retracement.
Stop loss: 38.63
Why we like it:
There is a swing high resistance.
Take profit: 36.30
Why we like it:
There is a multi-swing low support.
Enjoying your TradingView experience? Review us!
Please be advised that the information presented on TradingView is provided to Vantage (‘Vantage Global Limited’, ‘we’) by a third-party provider (‘Everest Fortune Group’). Please be reminded that you are solely responsible for the trading decisions on your account. There is a very high degree of risk involved in trading. Any information and/or content is intended entirely for research, educational and informational purposes only and does not constitute investment or consultation advice or investment strategy. The information is not tailored to the investment needs of any specific person and therefore does not involve a consideration of any of the investment objectives, financial situation or needs of any viewer that may receive it. Kindly also note that past performance is not a reliable indicator of future results. Actual results may differ materially from those anticipated in forward-looking or past performance statements. We assume no liability as to the accuracy or completeness of any of the information and/or content provided herein and the Company cannot be held responsible for any omission, mistake nor for any loss or damage including without limitation to any loss of profit which may arise from reliance on any information supplied by Everest Fortune Group.

XAGUSD sustains its uptrend as the dollar weakened
Despite the risk-on mood, silver prices are holding their uptrend. Overall risk-appetite mood is widespread in the market as expectations for a September Fed rate cut surge. Reports that President Trump may appoint a dovish candidate as the next Fed chair have bolstered the risk-appetite sentiment, alongside Treasury Secretary Besant’s remarks that a 50bp cut at the September FOMC is highly likely. If today’s PPI comes in below market consensus, it could further strengthen the case for a Fed rate cut and add to the inflows to the risky assets.
XAGUSD continues to trend higher within its ascending channel, holding above EMA21 and signaling the potential extension of its bullish structure. If XAGUSD remains within the channel, the price may gain upside traction toward the 39.50 high. Conversely, if XAGUSD breaks below EMA21 and the channel’s lower bound, the price could retreat toward 37.00.

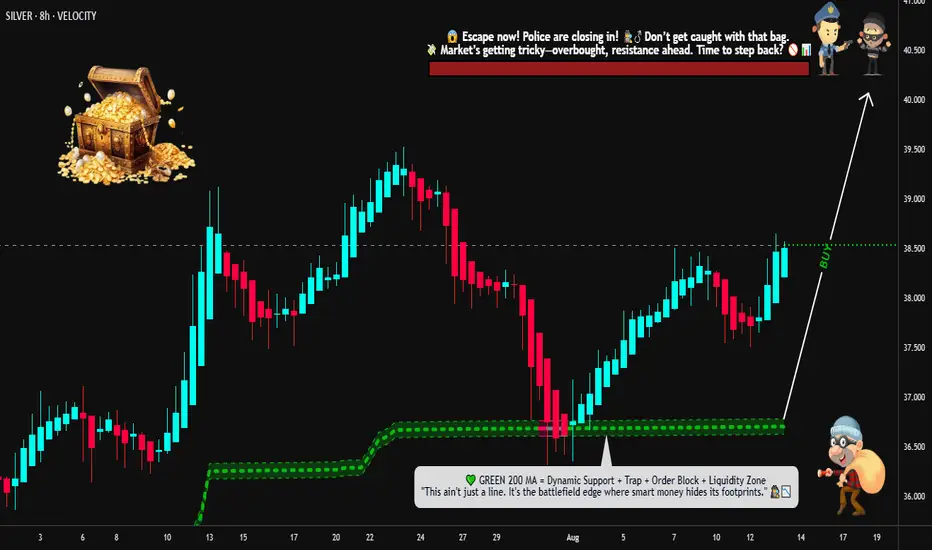
Silver (XAG/USD) ▲ Thief Strategy: Layer & Escape!🔥🦹♂️ THIEF TRADER’S SILVER HEIST PLAN! 🚨💰 (XAG/USD "The Silver")
🎯 MISSION: BULLISH LOOTING! 🐂💎
💣 ENTRY: ANY PRICE! But Thief OG’s use LAYERS! 🎯👇
(Multiple Limit Orders = More Stolen Profit!)
🔫 Buy Limit Layers: 38.500 | 38.300 | 38.000 | 37.800 | 37.700 (Add more if you’re greedy!)
🛑 STOP LOSS: Thief SL @ 37.000 (Adjust based on your risk, OG!)
🚨 TARGET: 40.500 (But escape at 40.300 before cops arrive!) 🚔💨
🔫 THIEF TRADER’S RULES:
✔ Scalpers: Only LONG side! Use Trailing SL to lock stolen cash! 💰
✔ Swing Traders: Layer up & hold till escape zone! 🏦
✔ News Alert! 🚨 Avoid new trades during high-impact news! Protect your loot with Trailing SL!
💎 WHY SILVER?
✅ Bullish Momentum! 🐂🔥
✅ Weak Bears = Easy Loot! �💀
✅ Fundamentals & COT Report BACKING US! 📊🔍 (Check links below!)
🚀 BOOST THIS PLAN!
💥 Hit LIKE & BOOST! Help us STEAL MORE MONEY! 💸🔥
🚨 Stay Tuned for the NEXT HEIST! 🦹♂️💣
🎯 REMEMBER: TAKE PROFIT & RUN BEFORE COPS ARRIVE! 🚔💨
🔥 THIEF TRADER OUT! 🤑 SEE YOU IN THE NEXT TRADE! 💣🚀
SHORT ON XAGUSD (SILVER)SILVER has completed its pullback to a major supply zone.
I will be selling silver to the next demand level.
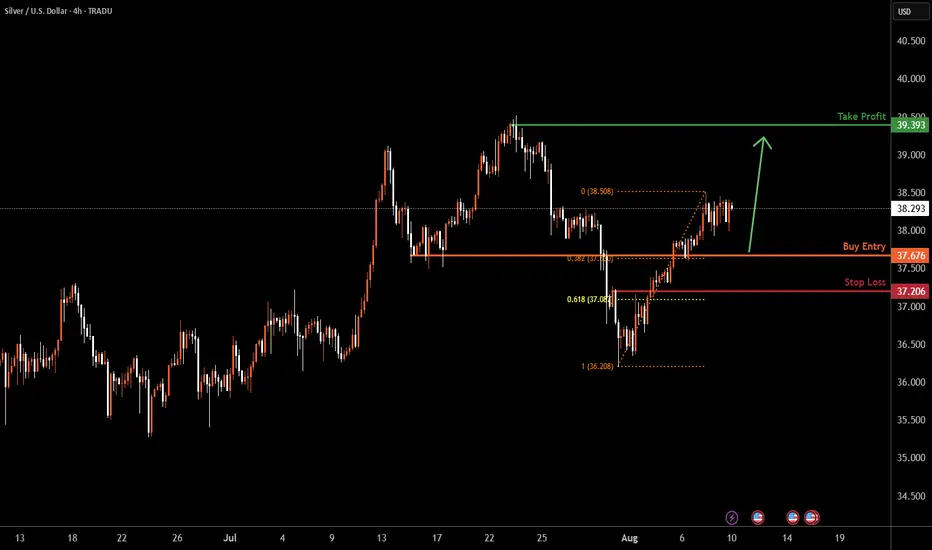
SILVER H4 | Bullish bounce offXAG/USD is reacting off the buy entry, which is a pullback support that aligns with the 38.2% Fibonacci retracement and could bounce from this level to the take profit.
Buy entry is at 37.67, which is a pullback support that lines up with the 38.2% Fibonacci retracement.
Stop loss is at 36.32, which is a multi-swing low support.
Take profit is at 39.39, which is a swing high resistance that lines up with the 78.6% Fibonacci projection.
High Risk Investment Warning
Trading Forex/CFDs on margin carries a high level of risk and may not be suitable for all investors. Leverage can work against you.
Stratos Markets Limited (tradu.com ):
CFDs are complex instruments and come with a high risk of losing money rapidly due to leverage. 65% of retail investor accounts lose money when trading CFDs with this provider. You should consider whether you understand how CFDs work and whether you can afford to take the high risk of losing your money.
Stratos Europe Ltd (tradu.com ):
CFDs are complex instruments and come with a high risk of losing money rapidly due to leverage. 66% of retail investor accounts lose money when trading CFDs with this provider. You should consider whether you understand how CFDs work and whether you can afford to take the high risk of losing your money.
Stratos Global LLC (tradu.com ):
Losses can exceed deposits.
Please be advised that the information presented on TradingView is provided to Tradu (‘Company’, ‘we’) by a third-party provider (‘TFA Global Pte Ltd’). Please be reminded that you are solely responsible for the trading decisions on your account. There is a very high degree of risk involved in trading. Any information and/or content is intended entirely for research, educational and informational purposes only and does not constitute investment or consultation advice or investment strategy. The information is not tailored to the investment needs of any specific person and therefore does not involve a consideration of any of the investment objectives, financial situation or needs of any viewer that may receive it. Kindly also note that past performance is not a reliable indicator of future results. Actual results may differ materially from those anticipated in forward-looking or past performance statements. We assume no liability as to the accuracy or completeness of any of the information and/or content provided herein and the Company cannot be held responsible for any omission, mistake nor for any loss or damage including without limitation to any loss of profit which may arise from reliance on any information supplied by TFA Global Pte Ltd.
The speaker(s) is neither an employee, agent nor representative of Tradu and is therefore acting independently. The opinions given are their own, constitute general market commentary, and do not constitute the opinion or advice of Tradu or any form of personal or investment advice. Tradu neither endorses nor guarantees offerings of third-party speakers, nor is Tradu responsible for the content, veracity or opinions of third-party speakers, presenters or participants.

SILVER Will Grow! Buy!
Hello,Traders!
SILVER made a retest
Of the horizontal support
Of 37.58$ and we are already
Seeing a bullish rebound
So we will be expecting
A further bullish continuation
Buy!
Comment and subscribe to help us grow!
Check out other forecasts below too!
Disclosure: I am part of Trade Nation's Influencer program and receive a monthly fee for using their TradingView charts in my analysis.

Silver consolidation supported at 3753The Silver remains in a bullish trend, with recent price action showing signs of a continuation breakout within the broader uptrend.
Support Zone: 3753 – a key level from previous consolidation. Price is currently testing or approaching this level.
A bullish rebound from 3753 would confirm ongoing upside momentum, with potential targets at:
3875 – initial resistance
3913 – psychological and structural level
3954 – extended resistance on the longer-term chart
Bearish Scenario:
A confirmed break and daily close below 3753 would weaken the bullish outlook and suggest deeper downside risk toward:
3720 – minor support
3676 – stronger support and potential demand zone
Outlook:
Bullish bias remains intact while the silver holds above 3753. A sustained break below this level could shift momentum to the downside in the short term.
This communication is for informational purposes only and should not be viewed as any form of recommendation as to a particular course of action or as investment advice. It is not intended as an offer or solicitation for the purchase or sale of any financial instrument or as an official confirmation of any transaction. Opinions, estimates and assumptions expressed herein are made as of the date of this communication and are subject to change without notice. This communication has been prepared based upon information, including market prices, data and other information, believed to be reliable; however, Trade Nation does not warrant its completeness or accuracy. All market prices and market data contained in or attached to this communication are indicative and subject to change without notice.

XAGUSD Sell
Sell based on Cot and Technical analysis
Technical indaticator : Below Alligator + Alligator Hungery'
Breakout of consilidation

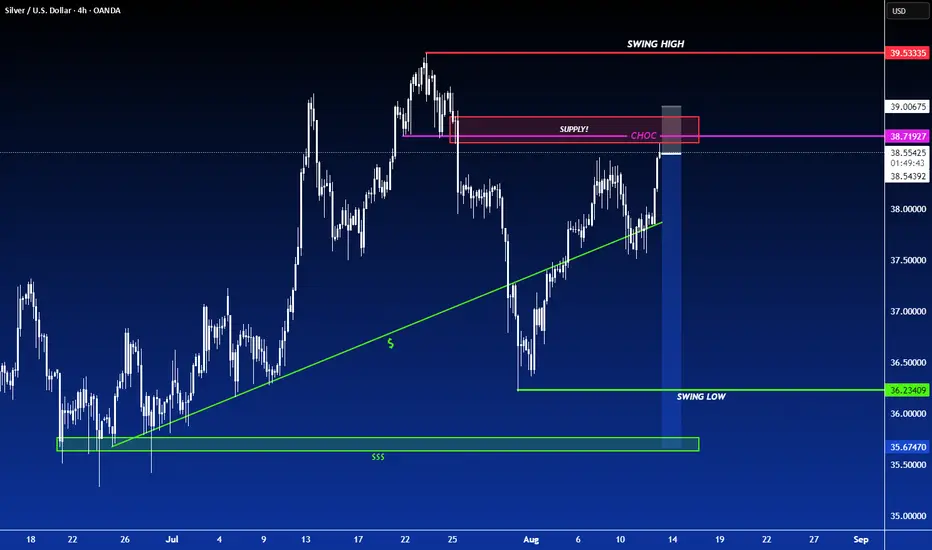
Silver at a Crossroads – 38.50 Break or 38.00 Collapse?Right now, Silver is worth keeping on the radar.
After falling from multi-year highs near 40 down to 36.20, the metal reversed and broke above both the falling trendline from the top and the 37.80 resistance.
Similar to Gold, the final sessions of last week were marked by range trading, with a clear top at 38.50 and bottom at 38.00.
Looking ahead:
• Bullish case: A break above 38.50 would be significant for buyers and could open the door for another test of the 40.00 zone.
• Bearish case: A daily close below 38.00 would be very negative, confirming a lower high at 38.50 and raising the probability of an ABC-type correction. In this scenario, 35.50 support becomes a likely target, with potential for a 2,500-pip drop.
Disclosure: I am part of TradeNation's Influencer program and receive a monthly fee for using their TradingView charts in my analyses and educational articles.

SILVER Will Go UP! Buy!
Hello,Traders!
SILVER keeps trading in an
Uptrend and the pair already
Made a rebound from the
Horizontal support of 38.10$
So we are bullish biased and
We will be expecting a
Further bullish continuation
Buy!
Comment and subscribe to help us grow!
Check out other forecasts below too!
Disclosure: I am part of Trade Nation's Influencer program and receive a monthly fee for using their TradingView charts in my analysis.

SILVER H4 | Bullish bounce off 38.2% Fibonacci supportXAG/USD is falling towards the buy entry which is a pullback support that lines up with the 38.2% Fibonacci retracement and could bounce to the take profit.
Buy entry is at 37.67, which is a pullback support that lines up with the 38.2% Fibonacci retracement.
Stop loss is at 37.20, which is a pullback support that is slightly above the 61.8% Fibonacci retracement.
Take profit is at 39.393, which is a swing high resistance.
High Risk Investment Warning
Trading Forex/CFDs on margin carries a high level of risk and may not be suitable for all investors. Leverage can work against you.
Stratos Markets Limited (tradu.com ):
CFDs are complex instruments and come with a high risk of losing money rapidly due to leverage. 65% of retail investor accounts lose money when trading CFDs with this provider. You should consider whether you understand how CFDs work and whether you can afford to take the high risk of losing your money.
Stratos Europe Ltd (tradu.com ):
CFDs are complex instruments and come with a high risk of losing money rapidly due to leverage. 66% of retail investor accounts lose money when trading CFDs with this provider. You should consider whether you understand how CFDs work and whether you can afford to take the high risk of losing your money.
Stratos Global LLC (tradu.com ):
Losses can exceed deposits.
Please be advised that the information presented on TradingView is provided to Tradu (‘Company’, ‘we’) by a third-party provider (‘TFA Global Pte Ltd’). Please be reminded that you are solely responsible for the trading decisions on your account. There is a very high degree of risk involved in trading. Any information and/or content is intended entirely for research, educational and informational purposes only and does not constitute investment or consultation advice or investment strategy. The information is not tailored to the investment needs of any specific person and therefore does not involve a consideration of any of the investment objectives, financial situation or needs of any viewer that may receive it. Kindly also note that past performance is not a reliable indicator of future results. Actual results may differ materially from those anticipated in forward-looking or past performance statements. We assume no liability as to the accuracy or completeness of any of the information and/or content provided herein and the Company cannot be held responsible for any omission, mistake nor for any loss or damage including without limitation to any loss of profit which may arise from reliance on any information supplied by TFA Global Pte Ltd.
The speaker(s) is neither an employee, agent nor representative of Tradu and is therefore acting independently. The opinions given are their own, constitute general market commentary, and do not constitute the opinion or advice of Tradu or any form of personal or investment advice. Tradu neither endorses nor guarantees offerings of third-party speakers, nor is Tradu responsible for the content, veracity or opinions of third-party speakers, presenters or participants.
Gold | Oil | Dollar | Silver | Natural Gas Price ForecastGold | Oil | Dollar | Silver | Natural Gas Price Forecast
NYMEX:NG1! NYMEX:CL1! COMEX:GC1! COMEX:SI1!

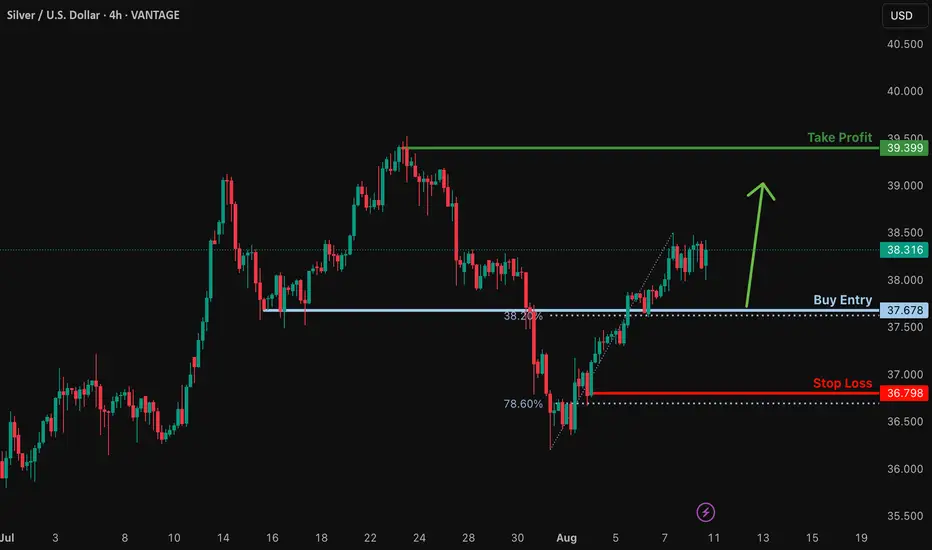
Bullih bounce off pullback support?XAG/USD is falling towards the support level, which is a pullback support that aligns with the 38.2% Fibonacci retracement and could bounce from this level to our take profit.
Entry: 37.67
Why we like it:
There is a pullback support that lines up with the 38.2% Fibonacci retracement.
Stop loss: 36.79
Why we like it:
There is a pullback support level that is slightly above the 78.6% Fibonacci retracement.
Take profit: 39.39
Why we like it:
There is a swing high resistance.
Enjoying your TradingView experience? Review us!
Please be advised that the information presented on TradingView is provided to Vantage (‘Vantage Global Limited’, ‘we’) by a third-party provider (‘Everest Fortune Group’). Please be reminded that you are solely responsible for the trading decisions on your account. There is a very high degree of risk involved in trading. Any information and/or content is intended entirely for research, educational and informational purposes only and does not constitute investment or consultation advice or investment strategy. The information is not tailored to the investment needs of any specific person and therefore does not involve a consideration of any of the investment objectives, financial situation or needs of any viewer that may receive it. Kindly also note that past performance is not a reliable indicator of future results. Actual results may differ materially from those anticipated in forward-looking or past performance statements. We assume no liability as to the accuracy or completeness of any of the information and/or content provided herein and the Company cannot be held responsible for any omission, mistake nor for any loss or damage including without limitation to any loss of profit which may arise from reliance on any information supplied by Everest Fortune Group.
SILVER A Fall Expected! SELL!
My dear friends,
SILVER looks like it will make a good move, and here are the details:
The market is trading on 38.352 pivot level.
Bias - Bearish
Technical Indicators: Supper Trend generates a clear short signal while Pivot Point HL is currently determining the overall Bearish trend of the market.
Goal - 37.909
About Used Indicators:
Pivot points are a great way to identify areas of support and resistance, but they work best when combined with other kinds of technical analysis
Disclosure: I am part of Trade Nation's Influencer program and receive a monthly fee for using their TradingView charts in my analysis.
———————————
WISH YOU ALL LUCK

SILVER WILL GO UP|LONG|
✅SILVER is already making
A bullish rebound from the
Horizontal support of 38.10$
While trading in an uptrend
So we are bullish biased and
We will be expecting a
Further bullish move up
LONG🚀
✅Like and subscribe to never miss a new idea!✅

Gold. Weekly Walkthrough. 10.08.2025,SundayCOMEX:GC1!
One-sided bullish expansion on Gold. Already outlined in the previous video

Watching July 31 High and August 1 Low - Key LevelsUS Inflation Next Week (CPI and PPI)
Will August re-test highs with momentum? Or test and fade?
MAGS back to highs.
AAPL has one of the best weeks since 2020's post covid crash recovery (WILD).
I still like long assets, but playing the game with discipline and patience.
Enjoy the weekend. Looking forward to the grind next week.
Thanks for watching!!!
-Chris
