XAI/USDT — Accumulation at Key Zone & Potential Reversal?Summary
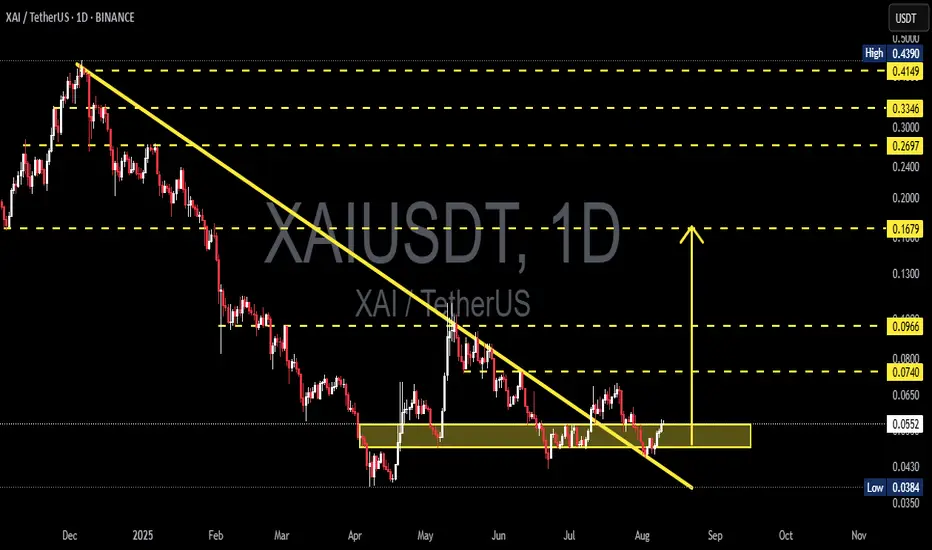
The daily chart shows XAI in a consolidation/accumulation phase within a key support zone (yellow box) after a prolonged downtrend. The long-term descending trendline (yellow) has recently been broken, signaling early signs that the downtrend may be losing momentum. However, confirmation is still needed (daily close and volume validation).
Key Levels (from the chart)
Major resistances: 0.0740, then 0.0966, 0.1679, 0.2697, (historical high ~0.4149–0.4390).
Current price: ~0.0551
Strong support/accumulation zone: around 0.043 – 0.056 (yellow box)
Breakdown low: ~0.0384
Potential moves from ~0.0551:
To 0.0740 ≈ +34.3%
To 0.0966 ≈ +75.3%
To 0.1679 ≈ +204.7%
Downside to 0.0384 ≈ -30.3%
Pattern Analysis (detailed & relevant)
Medium-term downtrend: price has been trending lower since the late 2024 peak, following a descending trendline. Recently, there was a breakout above this trendline, an early sign of trend weakening.
Accumulation zone (yellow box): price has tested and bounced from this area multiple times (April — Aug), indicating strong demand.
Possible double bottom/base formation: lows in early April and July/August at similar levels hint at a potential base-building phase. Needs confirmation with a breakout.
Key watch: A daily close above 0.0740 with strong volume would confirm bullish momentum. A breakdown below 0.0384 would confirm bearish continuation.
Bullish Scenario
1. Breakout confirmation — daily close above 0.0740 with strong volume → first target 0.0966, followed by 0.1679 and 0.2697.
2. Support retest & continuation — price may retest the accumulation box before bouncing, confirming the zone as a base for further gains.
3. Bullish signs: strong-bodied candles, successful retests, and increasing volume on breakout days.
Bearish Scenario
1. False breakout — price breaks the trendline but fails to surpass 0.0740, falling back into the range.
2. Accumulation breakdown — daily close below the yellow box (especially under 0.0384) → opens downside continuation risk.
3. Lower highs persist — continued inability to make higher highs keeps sellers in control.
Risk Management Checklist (Not financial advice)
Wait for daily close confirmation, not just intraday spikes.
Watch volume for breakout validation.
Conservative stop-loss: below the support box or 0.0384.
Take partial profits at key resistances (0.0740–0.0966), let the rest run if momentum continues.
Adjust position size according to risk per trade (e.g., 1–2% of capital).
#XAI #XAIUSDT #Crypto #TechnicalAnalysis #Breakout #SupportResistance #Accumulation #CryptoTrading
Xaiusdttrade
XAI/USDT Breakout from Long-Term Downtrend — Is a Major Trend?🔍 Complete Technical Analysis & Market Insight
After months of downward pressure, XAI/USDT is finally showing significant signs of life. The pair has successfully broken out of a long-standing descending trendline that has capped price action since November 2024 — potentially marking the beginning of a new bullish phase.
📐 1. Pattern & Technical Structure:
🔸 Descending Trendline Breakout:
Price has broken above the descending trendline, ending a multi-month bearish phase.
The breakout is supported by bullish candles and an uptick in volume, suggesting momentum shift in favor of the bulls.
🔸 Strong Accumulation Zone (Demand Area):
The area between $0.0550 – $0.0740 has acted as a solid accumulation/support zone.
Multiple rejections and consolidations around this zone suggest aggressive buyer interest.
🔸 Higher Low Formation & Potential Reversal Structure:
A series of higher lows is forming, indicating a potential bullish trend reversal.
The price structure hints at the possible development of a larger bullish pattern, such as an inverse head and shoulders or base formation.
📈 Bullish Scenario:
If the breakout holds and the price sustains above the key support:
Short-term target:
$0.0966 – initial resistance and psychological level.
Mid-term targets:
$0.1679 – strong historical resistance.
$0.2697 – a major reaction zone from previous breakdowns.
Long-term target if momentum continues:
$0.3418 – $0.4390
⚠️ Confirmation with volume and follow-through candles is crucial to validate a sustained bullish move.
📉 Bearish Scenario:
If the price fails to maintain above the breakout zone:
It may retest the accumulation zone between $0.0740 – $0.0624.
A breakdown below $0.0550 would invalidate the bullish thesis and could lead back to the previous low at $0.0384.
Breaching below $0.0384 could trigger a renewed bearish continuation.
📊 Market Sentiment & Context:
XAI is at a technically significant point. With selling pressure weakening and early bullish structures emerging, XAI could be positioning for a strong upside move — especially if broader market conditions improve.
However, given the speculative nature of the current breakout, risk management remains essential. False breakouts are not uncommon, especially in altcoins.
🧭 Strategic Summary:
Potential Buy Zone (on retest): $0.0624 – $0.0740
Stop Loss (conservative): Below $0.0550
Take Profit targets:
Short-Term: $0.0966
Mid-Term: $0.1679 – $0.2697
Long-Term: $0.3418 – $0.4390
Big breakouts often begin with subtle but critical structural shifts. XAI is showing early signs of such a shift — it could be the calm before a bullish storm, or just a trap. Either way, it deserves your close attention.
#XAIUSDT #XAI #AltcoinBreakout #CryptoBreakout #TrendReversal #CryptoAnalysis
#TechnicalAnalysis #SupportResistance #BullishBreakout

XAIUSDT 2DXAI ~ 2D
#XAI If you still have Conviction on this coin. This is very good support to start buying back with a target of at least 20%+

XAIUSDT 2DXAI Update ~ 2D
#XAI Again rejected from this resistance line. the best way for now, buy gradually after breaking through this resistance line. with a minimum target of 20%+

XAIUSDT Is a Breakout on the Horizon or a Pullback Imminent?Yello, Paradisers! Could #XAIUSDT be gearing up for a significant breakout, or is it poised for a pullback? Here's what we're seeing:
💎#XAI is displaying bullish potential after rebounding from the demand zone and forming a strong rejection candle. If the daily candle closes similarly, there is a real chance for the price to push toward the $0.228 supply zone. A successful breakout could lead to further upward movement, potentially crossing the resistance trendline and reaching the major resistance area we’re monitoring.
💎If XAI fails to hold above the demand zone and breaks down, a retest of the $0.18 - $0.166 area is likely. This zone has proven resilient in the past, often triggering rebounds and significant upward trends.
💎A daily close below the $0.166 major support would invalidate the bullish outlook, suggesting a potential deeper dip.
Stay disciplined and strategic, traders. Success in this market comes to those who trade with patience and precision.
MyCryptoParadise
iFeel the success🌴

XAIUSDTXAI ~ 3D
#XAI This looks like a Whale accumulation zone. if you have Conviction on this coin,. Maybe this support block will be a good buy for now.

#XAI Trendline Traders ( XAI going to breakout so soon)(((( Announcement for Trendline Traders ))))
*** #XAI going to breakout so soon***
#XAI
#XAIUSDT
#XAIUSD
BINANCE:XAIUSDT
#swingtrade
#shortterminvestment
#ALTCOIN
#Cryptotading
#cryptoinvesting
#investment
##trading
#cryptocurrencytrading
#bitcoininvestments
#Investing_Coins
#Investingcoins
#Crypto_investing
#Cryptoinvesting
**** #Manta ,#OMNI, #DYM, #AI, #IO, #XAI , #ACE #NFP #RAD #WLD #ORDI #BLUR #SUI #Voxel #AEVO #VITE #APE #RDNT #FLUX ****
#bitcoin
#BTC
#BTCUSDT

XAIUSDT Chart Idea - Swing Long SetupXAIUSDT broke the falling wedge on daily TF in May and retested today on Friday 6/21. A little bullish BTC momentum can send this chart to the moon since it's a AI play as well. Taking a swing long for next few weeks from current price on the following confirmations.
Confirmations:
- Successfully retested the falling wedge breakout on daily TF
- Daily RSI is in oversold area
Swing Long Setup:
-- Entry: 0.5021
-- TP: 1.18 (0.618 Fib)
-- SL: 0.44
