Gold is sideways. Will it fall under pressure?After sideways trading in the Asian morning on Wednesday, gold began to gain momentum in the European session. It broke out in the US market, reaching a high near 3352, completely erasing the previous day's losses and ushering in another turning point for bulls and bears. Things are often unexpected, and so are the markets.
Amidst a series of negative factors, bulls staged a comeback on Wednesday, refreshing Wednesday's market outlook and casting the market into renewed confusion. At present, the upper pressure is still maintained in the 3350-3360 range, while the lower support continues to be maintained around 3330. Wednesday's bullish rebound has once again left the market shrouded in uncertainty. Whether this is a bullish reversal or a bearish rebound remains uncertain, so we can only continue to try to trade within the range. In the short term, it is likely to remain in a range between 3360 and 3330, awaiting a potential breakthrough later in the day.
Trading strategy:
Go long near 3330, stop loss at 3320, profit range 3345-3355.
Xauusd1h

Gold is rising slowly. Should we trade within a range?Gold hit the strong resistance of 3350 on Wednesday and then fluctuated at a high level. The slow rise on Wednesday broke the fixed trend of the previous few days, that is, the trend of rising first and then falling. So under the current trend, will there be any different changes today? A surge and then a fall cannot be ruled out on the hourly chart, but for now, the overall trend remains within a range, with upper resistance remaining within the 3350-3360 range seen at the beginning of the week.
Gold's short-term support remains near 3330, the second rally point on Wednesday. With no new events impacting gold's trend in the short term, trading within this range is recommended. Market fluctuations have been irregular these past few days, and aggressive trading can easily lead to losses. Most of the time, it's best to adapt to market conditions.
Trading strategy:
Go long near 3330, stop loss at 3320, profit range 3350-3360.
Short sell near 3355, stop loss at 3365, profit range is 3340-3330.

The downtrend hasn't bottomed out. Will it follow the breakout?Gold experienced a breakout on Tuesday, rebounding to a peak near 3345 before retreating under pressure. It fell to 3314 in the US session before stalling, a 41-point drop.
Overall, while the decline isn't significant, key support levels have been broken one after another, suggesting the possibility of continued breakdowns and further downside potential. The 1-hour chart also shows a relatively strong bearish trend. The slight rebound in the early Asian session could well trigger a short-term correction. Support has also shifted down to the 3300 mark, a key resistance level for a top-to-bottom reversal.
At present, the main upward pressure remains near the previous support level of 3325-3330. If the price rebounds near this position today, you can still choose to short and wait. The first target below is 3310. If the resistance in the European session is strong, then it may be necessary to adjust the short selling point. Judging from the current market situation, the bears are in a strong advantage.
Trading strategy:
Short around 3325-3330, stop loss at 3340, profit range 3310-3300.
If you're looking for a safe trade, wait for the price to stabilize above 3330 before implementing a short position strategy.
Gold's rebound is weak. Will it continue to fall?Gold prices were stable in early Asian trading on Wednesday, currently fluctuating around 3315. Gold prices experienced a surge and then decline in both of the first two trading days of this week, but the upward momentum was insufficient, preventing it from breaking through the upward pressure. This decline was driven by the combined influence of a stronger US dollar, geopolitical uncertainty, and expectations for Federal Reserve policy.
Gold prices fluctuated downward, breaking through the weekly low to set a new low. The daily chart shows a bearish trend, with the moving averages forming a downward crossover, and the Bollinger Bands opening downward in the short term.
From the 4-hour chart, the upper short-term resistance has moved downward and is currently around 3330-3335. The lower support is around 3300. The overall main tone of high-altitude participation is maintained.
Gold's 1-hour moving average is also continuing its bearish divergence, indicating that bears still have downward momentum in gold, and the rebound is beginning to weaken. If the Asian market rebound fails to break above 3330, it will be extremely weak, and any small rebound in gold will continue to be dominated by bears.
Trading Strategy:
Long around 3290, stop loss at 3280, profit range 3320-3340;
Short around 3330, stop loss at 3340, profit range 3300-3280;
Key Points:
First Support Level: 3300, Second Support Level: 3295, Third Support Level: 3285
First Resistance Level: 3325, Second Resistance Level: 3330, Third Resistance Level: 3340

The bulls are powerless. Continued decline?Gold hit a low near 3326 in early Asian trading. Despite repeated downward pressure to build upward momentum, it hasn't broken through. Bullish attacks have been fruitless, and the pressure from the highs has shifted downward. While it has once again bottomed out and rebounded, it still hasn't broken through the upward pressure zone. The current resistance level is around 3345, the site of Monday's rapid decline, which also represents a previous top-bottom reversal.
Analysis of the 1-hour chart shows that gold prices have fallen to the key support level of 3330-3320. The moving averages are crossing downward, with upper resistance at 3345 near the MA100. A breakout could see the second resistance level of 3350-3360. The current range is oscillating between 3320-3360. We recommend caution in chasing orders within this range and patiently wait for key entry points.
Trading strategy:
Short around 3350, cover shorts at 3360, set a stop-loss at 3370, and profit range between 3330-3320. Below this level, target 3300.
If gold falls below 3320, try a light long position around 3315, with profit range between 3340-3350.

Has gold bottomed out? A strong upward trend?Last Friday, gold prices fluctuated and consolidated below 3350, remaining range-bound near 3340 at the close of the US session. On Monday morning, gold prices quickly retreated to test support near 3325. The hourly chart then rebounded, breaking through and stabilizing above 3345, forming a V-shaped rebound. Looking at the 1-hour chart, gold prices rebounded quickly after falling in the early Asian session, and the moving average system continued to cross upward, indicating that there is upward momentum in the short term; however, after the current price broke through the suppression position of 3350, it continued to fluctuate at this position. If the price cannot break through the range of 3350-3360 for a long time, then there is a high probability that it will technically retreat and accumulate momentum to impact upward again. In the short term, focus on the upward resistance level of 3350-3360, with support near 3330.
Trading strategy:
Short around 3355-3360, stop loss at 3370, profit range 3330-3320-3310.
Long around 3320, stop loss at 3310, profit range 3340-3350-3360.

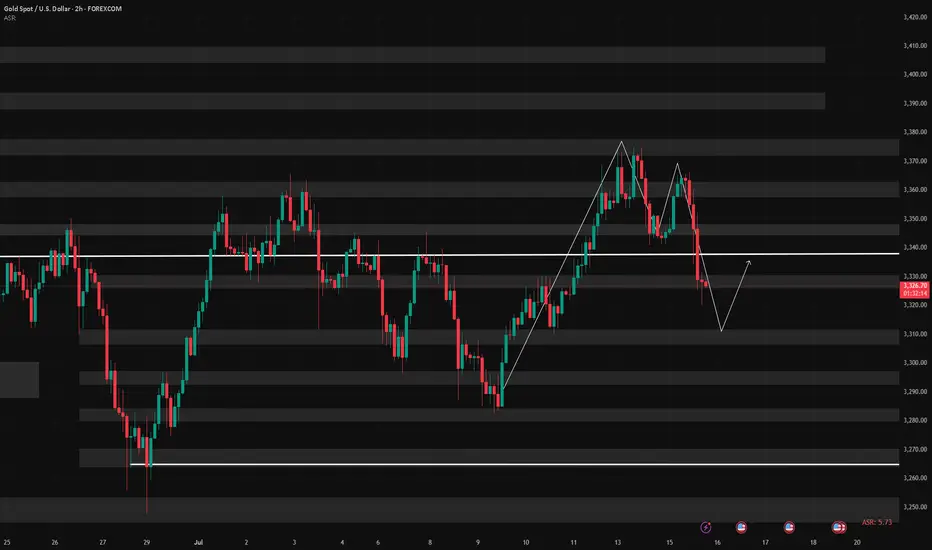
Next Week's Analysis: Will the Price Continue to Fall?Gold has been trending downward throughout this week. While it has generally remained within a broad range, with minor rebounds at lows, there's still a chance it will continue its decline and find strong support. The current strong support level is 3330, and the second support level is around 3300. The upper pressure is maintained at 3350-3360. After touching this position on Friday, it was under pressure again.
From the 1-hour chart, the moving averages are currently crossing downward, and this trend is likely to continue. After hitting a high near 3375 on Thursday, the price has been fluctuating downward, trading mostly below the middle Bollinger Band. Although it rebounded slightly after hitting a low at 3329, it failed to break through the resistance level of 3350, and after coming under pressure there, it has continued its downward trend. Overall, gold bears still have momentum, and there are currently no signs of a reversal.
Therefore, we can continue our bearish trend position at the beginning of next week.
The Asian gold market is about to open. Good luck to all traders.
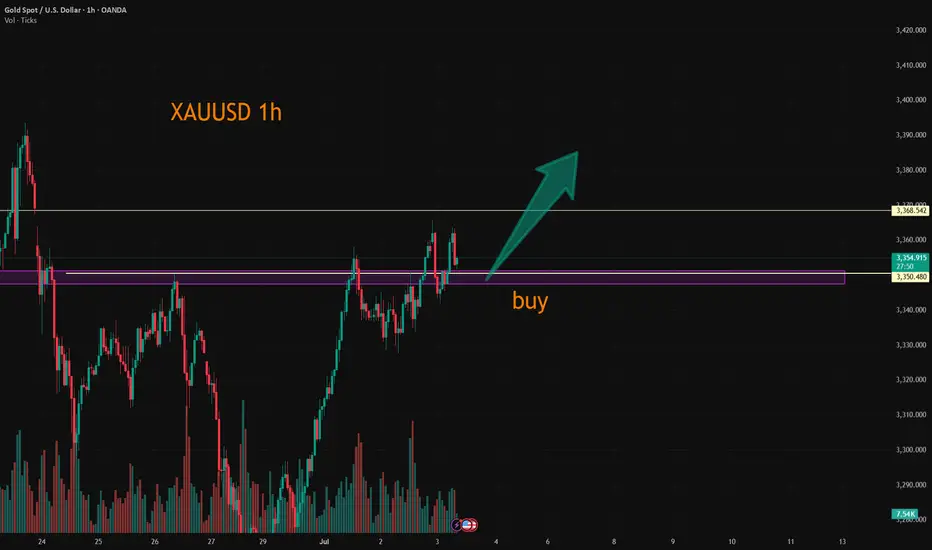
Gold support has been confirmed, buy with confidenceThe most anticipated outcome for the gold market this week is tomorrow's CPI data. After today's pullback during the Asian and European trading sessions, the current price has reached support levels. Before the CPI release, I believe volatility will be minimal, with a high probability of limited fluctuations.
The chart shows that 3350 is a key support level. After several hours of testing, 3350 has stabilized, so we can buy at this level, with the initial target being 3360, followed by 3380.
XAU/USD Intraday Plan | Support & Resistance to WatchGold broke above the 3,362 resistance and extended its rally into the 3,400 resistance zone, currently trading around 3,386. Price remains comfortably above both the 50MA and 200MA, which are sloping upward and acting as dynamic support—keeping short‑term structure bullish.
A confirmed break and hold above 3,400 would open the path toward the next upside targets at 3,416 and 3,440, with 3,458 as a higher‑timeframe extension if momentum continues.
If price fails to sustain above 3,383–3,400 and begins to fade, watch the initial pullback toward 3,362.
A deeper move below that would shift focus to the Pullback Support Zone.
Failure to hold there could expose price to the Support Zone and potentially the HTF Support Zone if bearish pressure builds.
📌 Key Levels to Watch
Resistance:
3,383 ‣ 3,400 ‣ 3,416 ‣ 3,440
Support:
3,362 ‣ 3,336 ‣ 3,317 ‣ 3,302 ‣ 3,289
🔎 Fundamental Focus –
📌 Fed Chair Powell Speaks – key event that can move USD and gold sharply.

7/16: Will Gold Reclaim 3350 or Fall to 3250?During today’s session, gold briefly broke through the 3352–3358 resistance zone, but due to news-driven pressure during the pullback, bullish momentum weakened, and the price retreated to the MA60 support level on the daily chart.
Given the significant retracement, there is a possibility that a short-term bottom may form during the upcoming Asian session, potentially leading to a retest of the 3337-3343/3352-3358 resistance area:
If the price breaks above this zone and holds above it after a pullback, the bullish trend could resume;
However, if it fails to break through or is rejected again, caution is warranted, as this could signal a larger-scale downtrend on the weekly chart, possibly targeting the 3250 area.
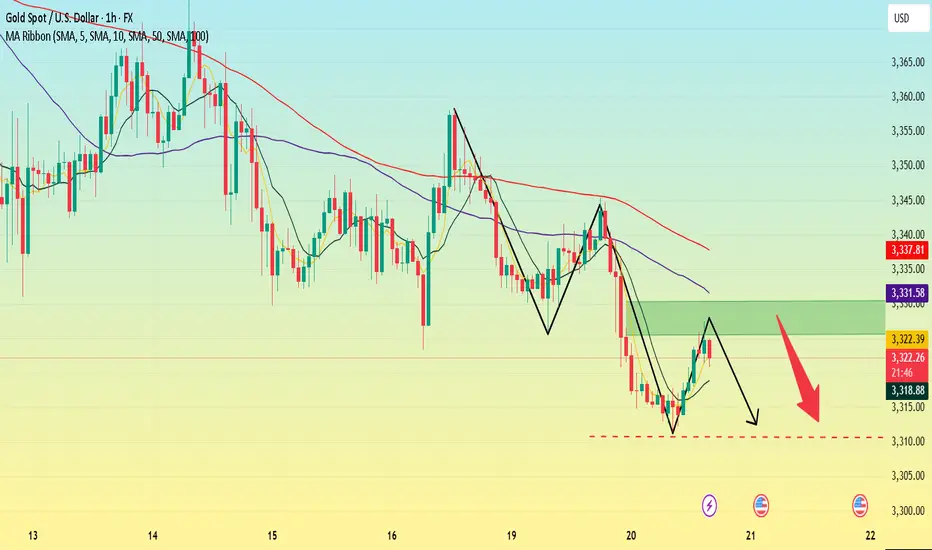
7/15: Watch for Long Opportunities Around 3343 / 3332–3326Good morning, everyone!
Yesterday, gold rose into the resistance zone before pulling back, testing support around 3343. After today’s open, the price continues to consolidate near this support level.
On the 30-minute chart, there is a visible need for a technical rebound, while the 2-hour chart suggests that the broader downward movement may not be fully completed. The MA60 support area remains a key level to watch.
If support holds firm, the price may form a double bottom or a multi-bottom structure, potentially leading to a stronger rebound.
As such, the primary trading strategy for today is to look for long opportunities on pullbacks, with key levels as follows:
🔽 Support: 3343, and 3332–3326 zone
🔼 Resistance: 3352–3358, followed by the 3372–3378 upper resistance band

Market Analysis: Gold Climbs Higher Amid Market OptimismMarket Analysis: Gold Climbs Higher Amid Market Optimism
Gold price started a fresh increase above the $3,350 resistance level.
Important Takeaways for Gold Price Analysis Today
- The gold price started a fresh surge and traded above $3,330.
- A key bullish trend line is forming with support at $3,350 on the hourly chart of gold at FXOpen.
Gold Price Technical Analysis
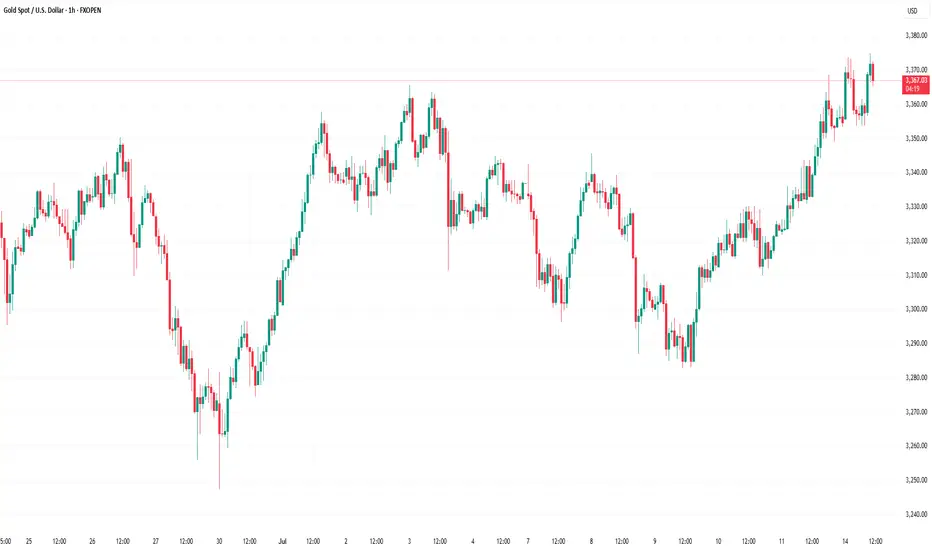
On the hourly chart of Gold at FXOpen, the price formed a base near the $3,280 zone. The price started a steady increase above the $3,330 and $3,350 resistance levels.
There was a decent move above the 50-hour simple moving average and $3,360. The bulls pushed the price above the $3,365 resistance zone. A high was formed near $3,373 and the price is now consolidating.
On the downside, immediate support is near the $3,350 level and the 23.6% Fib retracement level of the upward move from the $3,282 swing low to the $3,373 high.
Besides, there is a key bullish trend line forming with support at $3,350. The next major support sits at $3,330 and the 50% Fib retracement level.
A downside break below the $3,330 support might send the price toward $3,300. Any more losses might send the price toward the $3,280 support zone.
Immediate resistance is near the $3,370 level. The next major resistance is near $3,380. An upside break above $3,380 could send Gold price toward $3,400. Any more gains may perhaps set the pace for an increase toward the $3,420 level.
This article represents the opinion of the Companies operating under the FXOpen brand only. It is not to be construed as an offer, solicitation, or recommendation with respect to products and services provided by the Companies operating under the FXOpen brand, nor is it to be considered financial advice.
Trump's tariff news stimulates gold to explode!
📌 Driving Events
Gold prices rose for the third consecutive day and are expected to close higher this week. The trend turned in favor of gold buyers as tariff tensions intensified. US President Trump announced new tariffs, exacerbating concerns about a trade war.
📊Personal Comments:
Signs of instability in Trump's trade policy have once again hit investor confidence, reviving safe-haven demand for gold. In the absence of any top US economic data, the market will continue to focus on trade headlines. Weekend fund flows may also drive gold price movements.
⭐️Set Gold Price:
🔥Sell Gold Area: 3360-3369 SL 3374
TP1: $3355
TP2: $3342
TP3: $3325
⭐️ Note: Labaron hopes that traders can properly manage their funds
- Choose a lot size that matches your funds
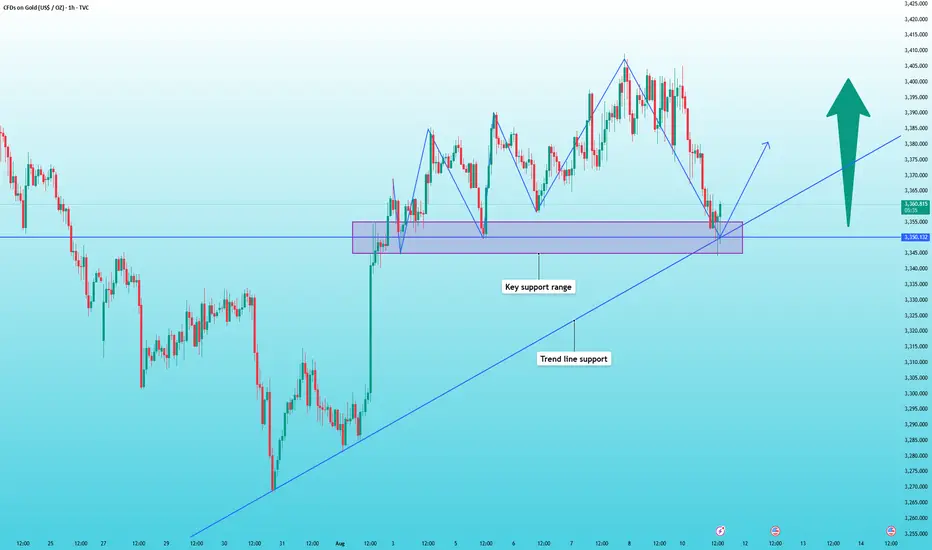
The weekend closed higher to around 3360
📌 Driving Events
Gold prices (XAU/USD) were on track to rise for the third consecutive day on Friday, climbing to the upper limit of this week's trading range as escalating trade tensions fueled safe-haven demand. Amid a significant intensification of global trade disputes, U.S. President Donald Trump this week sent formal notices to multiple trading partners detailing individual tariff rates that will take effect on August 1 if no agreement is reached. This has disrupted investor sentiment, weighed on risk assets, and provided solid support for gold.
Meanwhile, expectations of an imminent rate cut by the Federal Reserve (Fed) have cooled after last week's strong U.S. jobs data. As a result, the U.S. dollar (USD) remained firm, holding near more than two-week highs set on Thursday. A stronger dollar could limit upside for the non-yielding gold in the short term. Therefore, traders could look for a sustained breakout before going further bullish on the XAU/USD pair.
📊Personal comments:
Gold price broke through 3330, maintained good buying pressure, and rebounded over the weekend
⭐️Set gold price:
🔥Sell gold area: 3367-3369 SL 3374
TP1: $3355
TP2: $3342
TP3: $3325
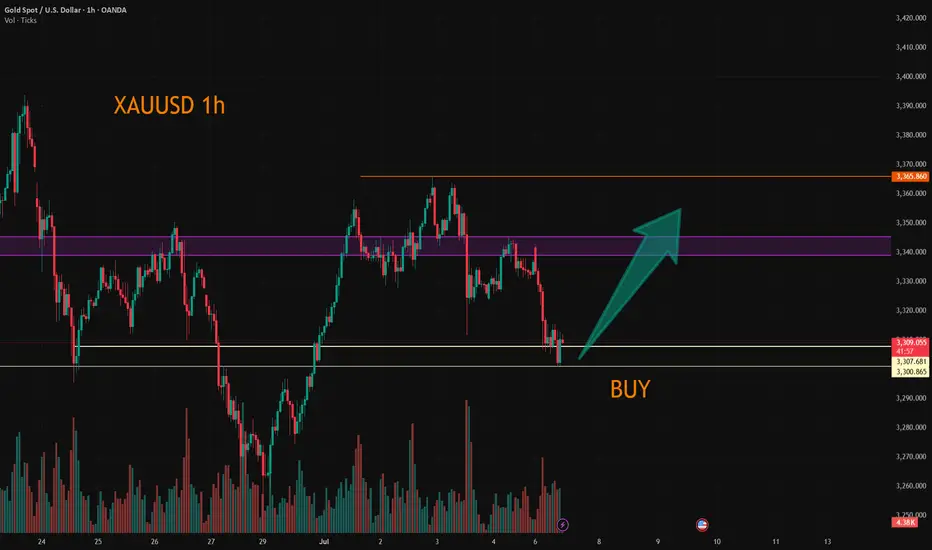
🔥Buy gold area: $3306-$3308 SL $3301
TP1: $3315
TP2: $3325
TP3: $3338
⭐️ Note: Labaron hopes that traders can properly manage their funds
- Choose a lot size that matches your funds
XAUUSD:Stay long
Today's Shock Trading strategy:
Day traders can buy long positions at 3318-23 with a target range of 3340-45
Median traders please refer to the previous thinking unchanged.
More detailed strategies and trading will be notified here ↗↗↗
Keep updated, come to "get" ↗↗↗

XAUUSD:Go long
Gold prices fell back in Asian trading on Monday, as they digested Friday's negative data. The short term may be partial shock, but the medium and long term news surface uncertainty or to provide support for gold prices, so trading ideas, retracement to do long can.
Trading Strategy:
Both 3300 and 3308 can be used to enter the long position, short-term traders can look at 3325-30, followed by 50 around.
For intermediate traders, the target sees 3365-70 unchanged, and the retracting of 3300/3310/3330 is an opportunity to go long.
More detailed strategies and trading will be notified here ↗↗↗
Keep updated, come to "get" ↗↗↗
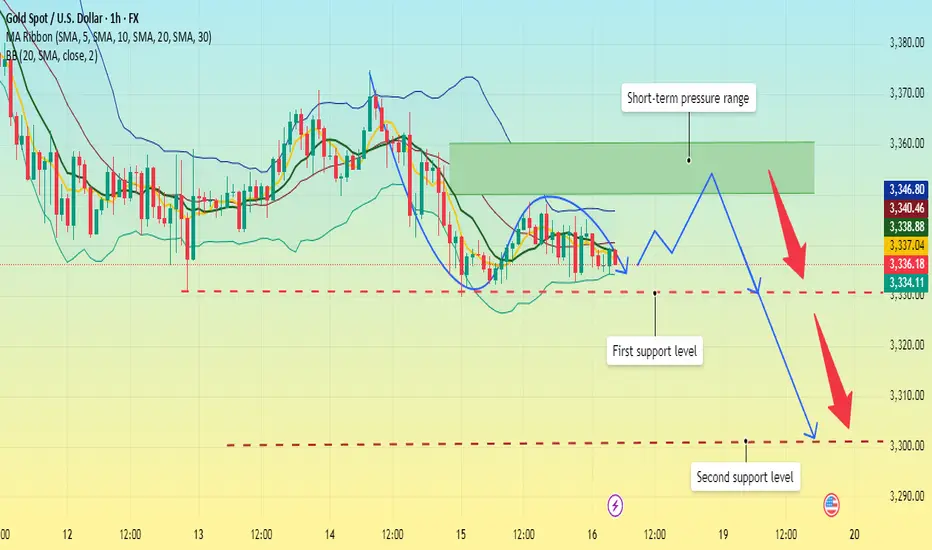
Bearish pressure below 3,300 at the start of the week
📌 Driving Events
Gold prices (XAU/USD) faced renewed selling pressure in early Asian trading on Monday, falling to the $3,320 level. Gold's pullback came as stronger-than-expected U.S. nonfarm payrolls data for June reshaped market expectations for the Federal Reserve's (Fed) policy path. Investors are now turning their attention to the Federal Open Market Committee minutes, which will be released on Wednesday, for further guidance.
The U.S. added 147,000 jobs in June, better than expected and slightly higher than the revised 144,000 in May. Meanwhile, the unemployment rate remained stable at 4.1%. These data reinforce the view that the labor market remains resilient, reducing the likelihood of an imminent rate cut by the Federal Reserve. As a result, the U.S. dollar strengthened, weighing on non-yielding assets such as gold.
📊Comment Analysis
The decline at the beginning of the week, gold prices give up accumulation below 3300
💰Strategy Package
⭐️Set gold price:
🔥Sell gold area: 3337-3339 SL 3344
TP1: $3328
TP2: $3312
TP3: $3300
🔥Buy gold area: $3297-$3295 SL $3290
TP1: $3308
TP2: $3320
TP3: $3330
⭐️ Note: Labaron hopes that traders can properly manage their funds
- Choose the number of lots that matches your funds
- Profit is 4-7% of the fund account
- Stop loss is 1-3% of the fund account
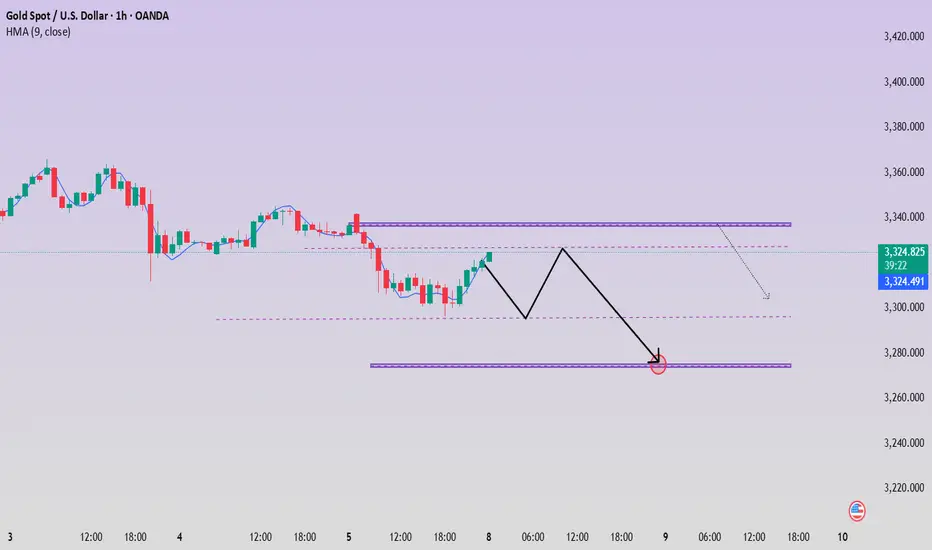
The bill was introduced; the price did not rise but fell.Due to the implementation of the US bill, most traders in the market are bullish on gold and believe that gold will soar on Monday. As a result, it jumped up and fell sharply this morning. This is the uncertainty of the market. Although the short position given near 3340 last Friday was late, it fell to the low point of 3306 at the opening of the Asian market today.
In addition, the key to this sharp drop is the high point before the rebound, that is, the starting point or the position of the top and bottom conversion. Once it is broken, you have to change your mindset. The volatile market is like this, just get used to it. The turmoil caused by Trump's bill will not appear for a while. It takes a process and cannot be unilaterally considered as bullish or bearish.
In the early Asian market, the price fell all the way from 3342 US dollars to 3306. How to judge the end of the decline? It is to stare at the high point of the rebound before the last decline of 3320 US dollars. The loss of 3300 US dollars in the early trading indicates that the gap-up opening is a lure for more.
Today, I think that 3325 above 3320 can be used as the dividing point between long and short positions. You can short with a light position near 3315, and pay attention to the 3295-3290 line below. After the upward breakthrough is confirmed, consider adjusting the position and making other arrangements. For the time being, we will look at the weak adjustment during the day.

Gold fluctuates during the day, short-term profits will be left
📌Main driving events of gold
The big non-agricultural data in the United States caused the gold price to fall by almost 40 US dollars in one breath, but after a short emotional storm, the market returned to calm. Today's market began to bottom out and rise. As of now, the non-agricultural market has been backed by 50%, and the energy of the shorts has been basically digested. Next, the bulls will start to exert their strength! Today's direction is still the same and continue to be bullish!
📊Comment analysis
In the US market, the gold price rebounded after the decline and the bottom of the second retracement appeared. The support level is 3322. After a night of fluctuations, gold has begun to rise, and the low point has begun to rise. The key point of the day is still 3323. In the morning, we wait for the gold price to fall back to around 3323 and we will buy the bottom and go long. We don’t expect to surpass yesterday’s high point during the day, but at least it will go to 3350!
💰Strategy Package
Long position:
Gold long at 3322-3327, stop loss 3315, target 3350-3360
⭐️ Note: Labaron hopes that traders can properly manage their funds
- Choose the number of lots that matches your funds

7/4: Trade Within the 3313–3346 RangeGood morning, everyone!
Yesterday’s intraday trades delivered solid profits. Since the U.S. market will be closed today, news-driven volatility is expected to be limited. Therefore, today’s trading focus will primarily revolve around technical setups.
Current structure:
Key support: 3321–3316
Immediate resistance: 3337–3342, followed by 3360
If support holds and resistance breaks, a potential inverse head-and-shoulders pattern may form on the 4H chart, with the next target near 3380
If support breaks, focus shifts to the 3303–3289 support zone
Given the likelihood of range-bound price action today, the suggested intraday range is 3313–3346, with a preference for selling near resistance and buying near support.
If an upside breakout occurs, consider using the MA20 on the 30-minute chart as a guide for pullback entries.

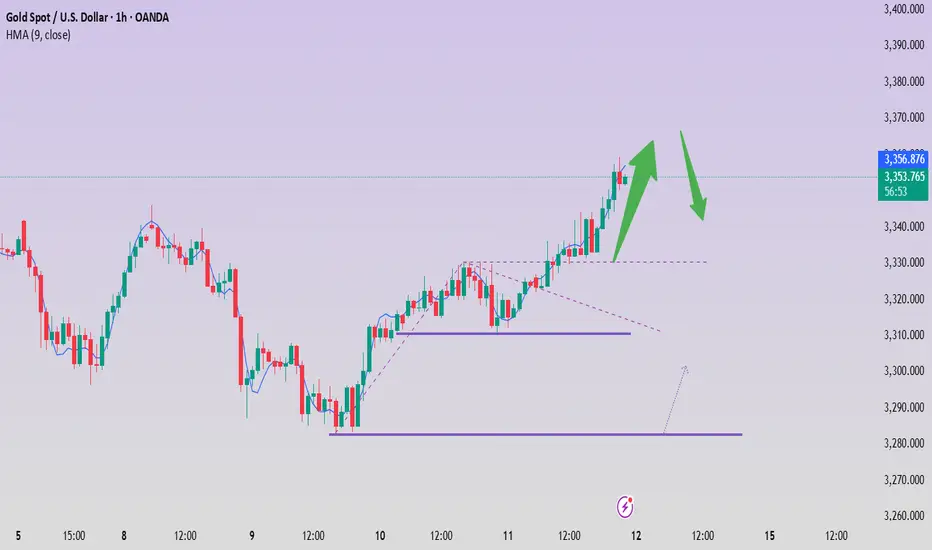
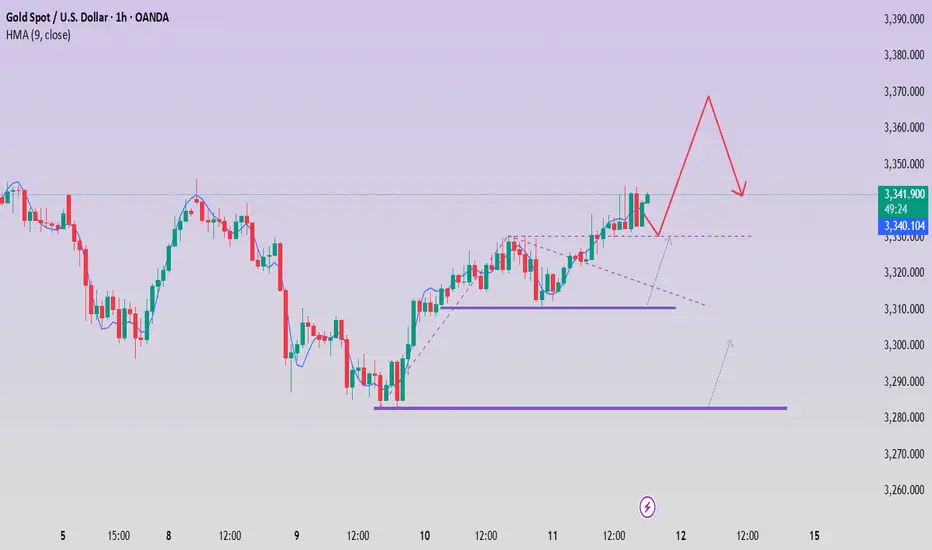
7/3: Focus on Short Positions, Watch Support Near 3320Good morning, everyone!
Yesterday, gold tested support near 3328 but failed to break below it effectively. The price then rebounded toward the 3350 level. At today’s open, gold briefly extended to around 3365 before pulling back.
Technically:
On the daily (1D) chart, the price remains capped by the MA20, with no confirmed breakout yet.
Support levels below are relatively dense, and moving averages are increasingly converging, suggesting a breakout in either direction is approaching.
Key intraday support lies in the 3321–3316 zone.
On the 2-hour chart, we are seeing the first signs of a bearish divergence, indicating a need for technical correction. Much like Tuesday’s setup, there are two possible scenarios:
If 3342–3334 holds, the price may extend slightly higher, intensifying divergence before pulling back;
If 3337 breaks, we could see a drop toward 3320, where correction would occur through a direct decline.
From a fundamental perspective, several high-impact U.S. data releases are scheduled for the New York session, which may increase volatility and make trading more challenging.
Trading suggestion:
For most traders, the safest approach is to wait for data to be released, then look for oversold rebounds or overbought corrections following sharp market reactions.
This style requires patience and strong risk control—avoid being overly aggressive or greedy, as such behavior can easily lead to trapped positions or even liquidation.

Gold grows, recovers near 3390
📣Gold News
Gold prices edged higher during the North American trading session as investors turned their attention to the upcoming U.S. non-farm payrolls report (NFP), which could influence the Fed's next policy move.
The latest labor data showed that companies are pausing hiring rather than laying off employees, reflecting caution in an uncertain economic environment. Meanwhile, Microsoft's decision to lay off 9,000 employees has heightened concerns about a weak labor market.
Traders are currently awaiting the official employment report from the U.S. Bureau of Labor Statistics on Thursday, which is expected to show 110,000 new jobs in June, down from 139,000 in May. The unemployment rate is expected to rise slightly to 4.3%, still within the 4.4% range of its forecast according to the Fed's latest summary of economic projections.
📣 Technical Analysis
NF is worth buying before the news release, holding. The dollar continues to be under selling pressure from investors worried about the Trump administration's erratic tariff policy.
💰Set Gold Price:
💰Sell Gold Zone: 3390-3398 SL 3405
TP1: 3380 USD
TP2: 3363 USD
TP3: 3350 USD
💰Buy Gold Zone: 3296-3294 USD SL 3289 USD
TP1: 3308 USD
TP2: 3318 USD
TP3: 3330 USD
⭐️Technical Analysis:
Set reasonable buy orders based on technical indicators EMA 34, EMA89 and support and resistance areas.
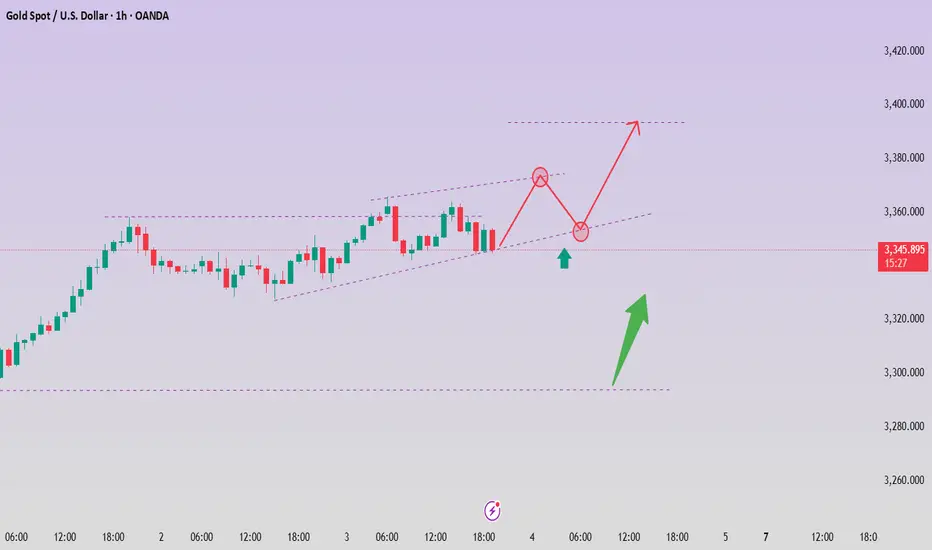
XAUUSD:A long trading strategy
The highest gold price in the Asian session reached 3365.4, which is already our mid-line target range. If you have completed and left the market, congratulations, because I personally set the TP point of 3368, so it did not touch, the trend of the past two days is appropriate rewithdrawal after strengthening, the high is also gradually rising, the overall long trend has not changed. For today's data, the probability will make gold prices continue to rise, trading ideas or to do the main.
Trading Strategy:
BUY@3347-51
TP:3365-70
This TP range is also the target range of the median trader, for friends who do not have automatic stop profit, you can take a profit manually at that time.
More detailed strategies and trading will be notified here ↗↗↗
Keep updated, come to "get" ↗↗↗