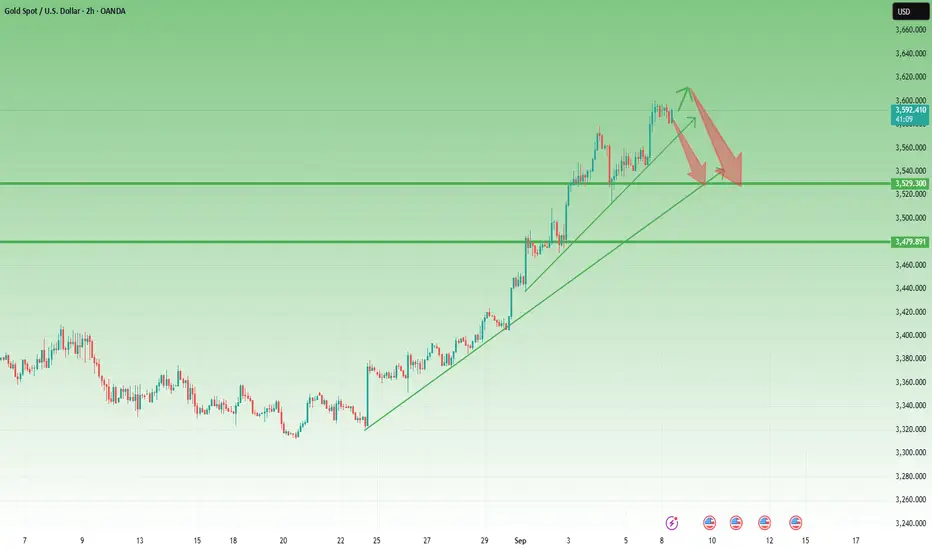
Fearless Bulls, Straight-Line Rise – But Mean Reversion CallsLast week Gold bulls were fearless – we witnessed three all-time highs within a single trading week. The market closed on Friday just below 3600, locking in an impressive 1,500 pips weekly gain. There is no doubt: the trend remains firmly bullish.
But let’s add some perspective. Even if XAUUSD were to drop 1,000 pips from current levels, that move would count as a minor correction within the dominant bullish trend. That’s how extended this rally has become.
📌 Another element supporting the correction scenario is the parabolic nature of the latest move. From the 3300 zone, the rally has been almost a straight vertical line, leaving gold strongly overextended and far away from the mean. Markets rarely sustain such deviation without at least a temporary pullback.
🔑 Trading Plan: While acknowledging the risks of counter-trend setups, I will look for short opportunities. In my view, there is more room to the downside than upside in the short term.
Target for correction: 3530 confluence support zone.
As always, the trend is still bullish, but corrections are part of the game. A disciplined trader must know when to step aside – and when to take the contrarian shot. 🚀
Xauusdanalysis
Gold Tests Key Reversal Zone – Bears on WatchGold ( OANDA:XAUUSD ) completed the move as I expected in my previous idea , both the down and up moves I expected.
Gold is currently moving in the Potential Reversal Zone(PRZ) .
Also, we can see the Regular Divergence(RD-) between Consecutive Peaks .
In terms of Elliott wave theory , it looks like Gold is completing the 5th microwaves of the main wave 3 .
I expect Gold to start correcting in the coming hours and drop to at least $3,593(First Target) .
Second Target: $3,583
Stop Loss(SL): $3,634
Gold Analyze (XAUUSD), 1-hour time frame.
Be sure to follow the updated ideas.
Do not forget to put a Stop loss for your positions (For every position you want to open).
Please follow your strategy; this is just my idea, and I will gladly see your ideas in this post.
Please do not forget the ✅ ' like ' ✅ button 🙏😊 & Share it with your friends; thanks, and Trade safe.

EUR/USD breakout buy alert EUR/USD Buy Opportunity
Current Price: 1.17500
📈 Buy Entry Active — Targeting higher levels
✨ Euro showing bullish momentum against USD.
✨ Buyers are holding strong support at 1.17500.
✨ Upside pressure is building for a breakout.
✨ Trend indicates further gains ahead toward key resistance.
✨ Market sentiment favors the Euro as strength continues.
⚡ Stay with the buyers — momentum is on your side!
---
Do you want me to add specific target levels (like TP1, TP2, SL) to make it look more like a professional signal?

Gold (XAU/USD) –> Two Scenarios Hello guys!
Gold has been moving strongly inside an ascending channel on the 1H chart, showing consistent bullish momentum. Price is currently testing a key resistance area around $3,585 – $3,590. From here, one of two scenarios is most likely to play out:
Scenario 1: A short-term pullback toward $3,563 support, followed by a bounce that could fuel another leg higher. target will be near $3,630 – $3,650.
Scenario 2: A short-term pullback toward $3,580 support, pushing price toward the upper channel resistance near $3,630 – $3,650.
Both scenarios remain bullish as long as gold trades above $3,560. Only a clean break below this level would weaken the structure.
Overall, gold is set for further upside; the path depends on whether we see a retest first or an immediate breakout.
Disclaimer: As part of ThinkMarkets’ Influencer Program, I am sponsored to share and publish their charts in my analysis.

Another bullish move goldThis is a Gold Spot vs U.S. Dollar (XAU/USD) chart on the 1-hour timeframe from OANDA. At the current moment, the gold price is trading around $3,657.19, showing a gain of +21.345 points (+0.59%).
The chart highlights a bullish momentum, with the price consistently forming higher highs and higher lows since September 7th. Buyers are dominating, pushing the market upward after breaking through consolidation zones.
Key support levels can be seen around:
$3,655.97
$3,646.27
$3,628.16
$3,578.10
These levels serve as potential zones where buyers may step in again if the price pulls back.
The projection on the chart shows a bullish continuation setup. After a short retracement, the market is expected to resume its upward movement, aiming toward the new high zone at $3,708. This suggests traders are anticipating further upside momentum if gold maintains its current bullish strength.

A Healthy Market Breathes. Gold Hasn’t Exhaled Yet.I remain bullish on Gold overall — that’s not in question.
On 24 August, I even shared a complete cross-market outlook arguing that acceleration to the upside could be the next big move. And indeed, we got it.
But here’s the paradox of markets: sometimes, the stronger the rally, the more fragile it becomes.
________________________________________
Why I Warned About a Steep Correction
• Yesterday, I flagged the risk of a sharp pullback. My stop loss was triggered, yes, but my conviction hasn’t changed. If anything, the higher Gold pushes, the more probable and violent the correction could be.
• The daily chart says it all: since the local bottom around 3300, Gold has moved almost vertically higher.
• From 26 August onward, with the sole exception of the 4 September red candle, every single day closed green — and not just small gains, but +1% or more.
This type of move is powerful, but also unsustainable.
________________________________________
Market Psychology at Work
Markets move in cycles of fear and greed, tension and release. A one-sided move — especially a vertical one — compresses tension like a coiled spring. Traders get trapped:
• Late buyers rush in from FOMO, convinced “it will never stop going up.”
• Sellers get squeezed, forced to cover, adding fuel to the fire.
• But eventually, when there’s no one left to buy at higher prices, even a small wave of selling can cascade into a steep correction.
This is why not even Bitcoin, in its glory days, could sustain vertical rises for long. The pattern was always the same: euphoric rise → brutal drop . Gold is no different.
________________________________________
Where We Stand Now
• At the time of writing, Gold trades at 3647, after touching 3660 and marking a new ATH.
• Is this the local top? Hard to say with certainty. But in my book, until we see a strong correction, there is no valid buy trade here.
________________________________________
My Trading Plan
Today, I will look to sell again. Not because I doubt the long-term bullish trend, but because the short-term imbalance is glaring.
A healthy market breathes, and Gold hasn’t exhaled yet.
🚀 Long term: bullish.
⚠️ Short term: vulnerable.
🎯 Until a correction resets the board, my play is on the short side.

Gold 1H – Buy the Dip, Watch 3,687 Premium SupplyGold on the 1H timeframe is trading above 3,650 after a clean break of structure. Price has left demand footprints around 3,636 and deeper at 3,594, while resistance stands near 3,670 and premium supply sits at 3,687–3,689. This suggests a possible engineered retracement into discount zones before a push toward liquidity at 3,688+.
________________________________________
📌 Key Structure & Liquidity Zones (1H):
• 🔼 Buy Zone 3,636 – 3,634 (SL 3,630): Fresh demand block, aligned with bullish order flow.
• 🔼 Buy Zone 3,594 – 3,592 (SL 3,587): Deeper discount demand, strong structural base.
• 🔽 Sell Zone 3,687 – 3,689 (SL 3,694): Premium supply zone, potential liquidity sweep.
________________________________________
📊 Trading Ideas (Scenario-Based):
🔺 Buy Setup – Demand Block Reaction
• Entry: 3,636 – 3,634
• Stop Loss: 3,630
• Take Profits:
• TP1: 3,650
• TP2: 3,665
• TP3: 3,680+
👉 Expect retracement into discount demand before resuming bullish move.
🔺 Buy Setup – Deeper Demand Test
• Entry: 3,594 – 3,592
• Stop Loss: 3,587
• Take Profits:
• TP1: 3,610
• TP2: 3,625
• TP3: 3,640+
👉 Ideal for swing buyers looking for higher R:R at deeper liquidity sweep.
🔻 Sell Setup – Premium Rejection
• Entry: 3,687 – 3,689
• Stop Loss: 3,694
• Take Profits:
• TP1: 3,670
• TP2: 3,655
• TP3: 3,640
👉 Short-term liquidity grab at premium levels before rotating lower.
________________________________________
🔑 Strategy Note
Bias remains bullish, but smart money may engineer a sweep into 3,636 or even 3,594 demand before expansion. Cleaner setups are buying dips; sells at 3,687 are only scalp plays with tight risk.

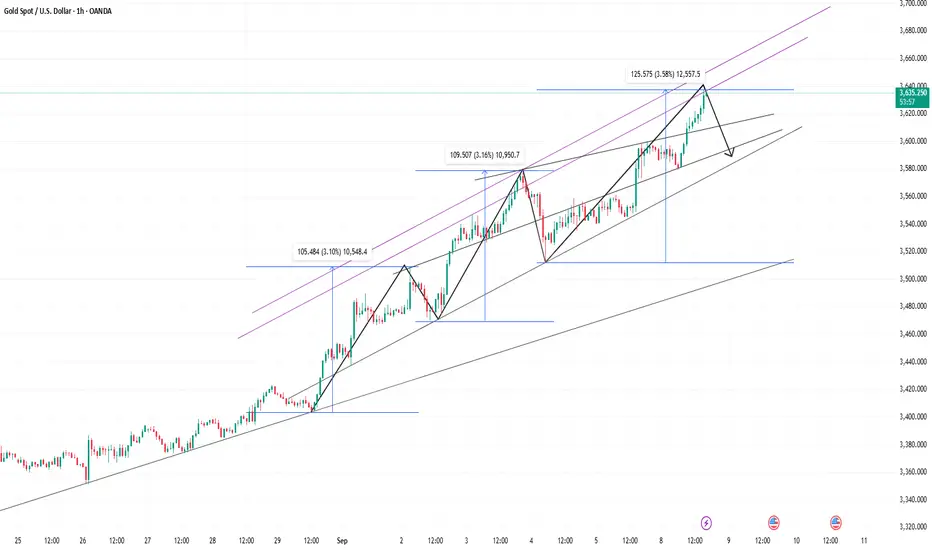
Turning the Tables: Bears’ Guide to Profit in GoldDriven by the dual influence of interest rate cut expectations and the job market, gold prices continue to rise and reach new highs. This is entirely a game played by big money at this stage. Buying sentiment in the gold market is currently so high that most of the time, there's no opportunity to even enter a long position. Therefore, after considering the possible phenomenon of "buying expectations and selling facts", while controlling risks, I carefully tried to short gold. Although I suffered losses frequently, I also made a good profit overall because I successfully captured the volatility.
Currently, gold continues to rise and has reached a high of around 3637. In fact, according to its wave pattern, gold may experience a pullback at any time. This is why I insist on shorting gold today.
The 1st wave: Gold rose from around 3405 to around 3508, a 3.1% increase with a fluctuation of $105.
The 2nd wave: Gold rose from around 3470 to around 3578, a 3.16% increase with a fluctuation of $108.
The current wave: Gold rose from around 3512 to its target of around 3637, a 3.5% increase with a fluctuation of $124.
According to the trend of price fluctuations, gold has reached and, to a certain extent, exceeded the previous two waves, so a pullback is possible at any time.
Furthermore, given that intraday fluctuations have been between $30 and $50 in recent days, and the intraday fluctuation of gold from around 3580 to around 3637 reached $57, a short-term pullback is highly likely.
However, because the bullish momentum of gold is strong, I will continue to try to short gold before a clear peak signal appears, but I may appropriately lower my expectations for gold's pullback, that is, appropriately lower my expectations for profit margins. My current short position entry prices are: 3612, 3621 and 3636. Basically, I add positions every time the fluctuation is 100-150pips. I currently hope that gold can retreat to the area around 3610-3600.
Please follow the latest accurate buy and sell signals for XAUUSSignal Recommendations:
1. Sell short at $3648-3654, target $3636-3630.
2. Buy at $3625-3617, target $3636-36.
Trading involves risk; control your own profits and losses.
I hope that every accurate signal can help every independent trader and make trading profitable easier.
TVC:GOLD PYTH:XAUUSD EIGHTCAP:XAUUSD FOREXCOM:XAUUSD OANDA:XAUUSD VANTAGE:XAUUSD

Gold→ Between Glory and CollapseGold has climbed without mercy, each retrace shallow, each rally sharper than the last.
Now the metal stands suspended between glory above 3700 and collapse into the 3579 support shelf.
Above, the 3687–3700 premium zone glows like bait. Breakouts here could unleash a frenzy, pulling in late buyers and forcing shorts into a brutal squeeze. But every step higher walks deeper into thin air, where reversals strike hardest.
Below, the 3579–3540 demand base waits patiently. It’s the foundation of this whole move — the line that must hold if bulls want to defend the uptrend. If price ever cuts back to this shelf, it won’t just test support; it will test conviction.
This is no ordinary range. It’s a battlefield stretched to extremes:
⚔️ Above 3700 → euphoria and chase.
⚔️ Below 3579 → panic and liquidation.
Gold doesn’t move aimlessly — it hunts. And right now, it’s hunting those who believe it can only go one way.
Gold is writing history between 3700 glory and 3579 collapse.
If this map sharpened your view, show some love: smash that like, hit follow, and support the idea so we keep bringing you daily precision charts.
— GoldFxMinds 🚀✨

XAU/USD Analysis: 3 Reasons Why Gold’s Rally Might PauseXAU/USD Analysis: 3 Reasons Why Gold’s Rally Might Pause
Today’s XAU/USD chart shows that gold continues to set records in September. The price has risen above $3,650 per ounce for the first time in history – one of the main drivers being expectations of a Federal Reserve rate cut on Wednesday, 17 September.
Easier monetary policy is generally seen as boosting gold’s appeal – this has pushed XAU/USD nearly 6% higher since the start of September. However, the chart highlights three reasons why further upside may be limited.
Technical Analysis of the XAU/USD Chart
1. Long-term channel:
Over the course of 2025, gold price movements have formed an ascending channel (shown in blue), and today XAU/USD is trading close to its median line. This is where supply and demand typically balance out. Buyers may consider the post-September rally overstretched, while sellers could view the all-time high as an opportunity to take profits.
2. Rectangle pattern target reached:
The range between $3,250 and $3,440 that developed mid-year can be interpreted as a rectangle pattern. Following the bullish breakout, the implied target of $3,630 has already been achieved.
3. RSI signals risk:
The RSI indicator is close to forming a bearish divergence.
Given the steep angle of the orange support line, a correction – for example, towards the psychological level of $3,550 – might occur.
In summary, gold’s upward momentum may start to slow. At the same time, given the market’s inertia, traders may have little reason to expect a decisive shift away from bullish dominance. Still, next Wednesday could bring surprises.
This article represents the opinion of the Companies operating under the FXOpen brand only. It is not to be construed as an offer, solicitation, or recommendation with respect to products and services provided by the Companies operating under the FXOpen brand, nor is it to be considered financial advice.

Short sellers' exit strategy and outlook for the marketGold has been rising recently and has deviated from technical analysis in the short term. Out of fear of heights and to avoid the potential risks brought about by chasing high prices, I have been trying to short gold at the top recently.
Unfortunately, it is difficult for gold to get an effective pullback in the short term. Even if the account has a certain amount of funds to resist risks, the short orders held in the short term are still facing great pressure. After increasing our short positions near 3620 yesterday, we originally expected gold to at least retreat to 3605-3595, so that we can turn losses into profits in one fell swoop, reverse the temporary losses in our hands, and realize profits completely. However, gold did not give an ideal opportunity in the evening, and even rose to around 3645 at one point, which forced us to try to short gold again by touching the top. However, the pullback last night was limited and failed to effectively fall below 3633, so we can only hold positions again and wait for trading opportunities in the Asian session.
After the opening of the Asian session in the morning, there was only a slight pullback. As the gold price continued to rise, the short-term support moved up. In addition, considering that gold had difficulty falling below 3633 last night, the buying funds below were too strong. In order to better protect the safety of account funds, I had to close all short orders in my hands near 3630 and start creating long orders to execute hedging transactions.
Since we managed the number of trading lots in our account relatively properly and the number of low-level trading lots was small, it did not cause too much loss to my account. But this doesn't mean I have lost confidence in future shorts. As I said before, as long as the market remains stuck in the sentiment of buying expectations and selling facts, gold is bound to fall sharply. Just now I closed my long orders and am ready to short gold again.
The preliminary value of the benchmark change in non-farm employment in the United States in 2025 will be announced tonight. If it falls short of expectations, gold may still fall back. Although there is no good reference point for the weekly and daily lines, the monthly line is suppressed near the 3700 line. As long as it fails to break through effectively, gold will definitely fall. Therefore, in the short term, I am still optimistic about shorting gold, and I am determined to short at 3660-3700.

GOLD New High Record Break Gold New High on the Way! 🔥
Current Price: 3635
📈 Buy Entry Active — Target 3690
✨ Gold is in full bullish control.
✨ Buyers pushing strongly toward new record highs.
✨ Market confidence remains unshaken.
✨ Every dip is being bought instantly.
✨ Strong fundamentals + technicals support upside.
✨ Next resistance is ready to be tested soon.
✨ A breakout above 3690 can open doors for even higher levels.
✨ This could be the start of another major rally.
⚡ Don’t wait — secure your position now before the breakout run begins!

Gold Technical Analysis – Is a Pullback Coming?Hello everyone, Ken here!
Looking at the chart, gold is still trading within a clear rising channel, but the price has now moved up to the upper boundary. This is an area where profit-taking pressure often appears and can act as dynamic resistance.
If buying momentum weakens, the market is likely to see a short-term correction toward the support zone around 3,630 USD. If buyers defend this level, the bullish trend can continue. On the other hand, if support is broken, gold may retreat further toward the lower boundary of the channel.
The key is to watch candlestick signals and volume at these critical levels. Careful risk management should always be the top priority before making decisions. Trade safe!
XAUUSD – M30 Intraday Trading Plan | MMFLOW TRADINGMarket Pulse:
The US jobs report confirmed a clear slowdown in labour market growth. According to CME FedWatch, there is now an 88% probability the Fed cuts rates by 0.25% in September, and 12% for a 0.5% cut. Lower rates reduce the opportunity cost of holding gold – fuelling demand further.
Gold has already gained 38% YTD, after rising 27% in 2024. A weaker USD, aggressive central bank accumulation (led by China, which extended purchases for the 10th consecutive month in August), loose monetary policy, and rising global uncertainty continue to build a solid base for this bullish trend.
👉 Bottom line: Macro flows + liquidity both favour the BUY side.
Technical View (M30):
Price is respecting the ascending channel, printing higher lows.
3616–3596 is the structural support; only a breakdown here shifts the trend.
Liquidity clusters sit at 3653–3655 and 3675–3677, likely to trigger short-term SELL reactions before the broader uptrend resumes.
Execution Plan (Today):
🔵 BUY ZONE: 3618 – 3616
SL: 3610
TP: 3624 → 3630 → 3635 → 3640 → 3650 → 3660 → 3670+
🔵 BUY ZONE: 3598 – 3596
SL: 3590
TP: 3602 → 3606 → 3610 → 3615 → 3620 → 3630 → 3640 → 3650+
🔴 SELL ZONE: 3653 – 3655
SL: 3660
TP: 3648 → 3644 → 3640 → 3635 → 3630 → 3620
🔴 SELL ZONE: 3675 – 3677
SL: 3681
TP: 3670 → 3665 → 3660 → 3650 → 3640
Summary:
✅ Bigger picture: Bullish trend intact – look for buys off liquidity support zones.
⚡ Short-term: take quick SELLs around liquidity resistance for intraday setups.
👉 Follow MMFLOW TRADING for precision plans: BUY with structure, SELL with liquidity.

GOLD Current support ? Holds or not??#GOLD... After na fantastic ride and now market immediate support is 3627-28
Keep close and holding of that area will leads us towards upside areas otherwise not..
NOTE: we will go for cut n reverse below 3628 on confirmation.
Good luck
Trade wisley

ZGM | CAN GOLD HIT 3755 ? We Are Seeing The Bull Run Month In Gold
So The H1 Timeframe Gold Telling A Very Bullish Market Move Coming In History That Gold Have Create A High Strong Bullish Channel That We Are Expecting Gold That The Gold Are Continuously Bullish

Gold in Focus: Pullback Sets Stage for Next MoveGOLD has been moving within a rising parallel channel. And recently price just pulled back sharply from the channel’s top and touched the lower boundary, where it was strongly rejected. That rejection wick indicates that buyers stepped in already.
If momentum picks up again, the channel top could even break and extend the rally further. I would target the top of the channel, taking into account the market context, it's achievable.
The risk, however, comes if price closes strongly below the channel’s lower boundary. In that case, the bullish structure breaks and the move could start downwards short term.

Gold’s Power Play: Bubble or Break?After gold touched around 3659 during the day, it retreated to our primary target area as expected: 3640-3630 area. In this short transaction, we actually made a profit of 200pips, which is a relatively good trade.
There is no doubt that gold is still in a unilateral upward trend and may continue to around 3670 in the short term, but at the current stage, I would rather wait and see on the sidelines than rush to chase the rise in gold, because I really don’t want to be hanging on a tree and swinging.
What is unstoppable is that I will still try to short gold by touching the top in the high area along the current trend line. Judging from the recent fluctuations, since I don’t have the courage to chase the rise of gold, in order to participate in market transactions, I will try to short gold based on the principle of touching the high point of the trend line. It is not too difficult to earn a profit margin of 100-200 pips in short trading. According to the current trend line constructed, the current upward extension space is around 3670, while the intraday high is around 3660.
Therefore, in short-term trading, we can still continue to try to short gold by using the short-term high point area of 3660-3670 as resistance. The primary short-term target is still the 3640-3630 area. Once gold falls below this area, the target area will be moved to the 3610-3600 area.

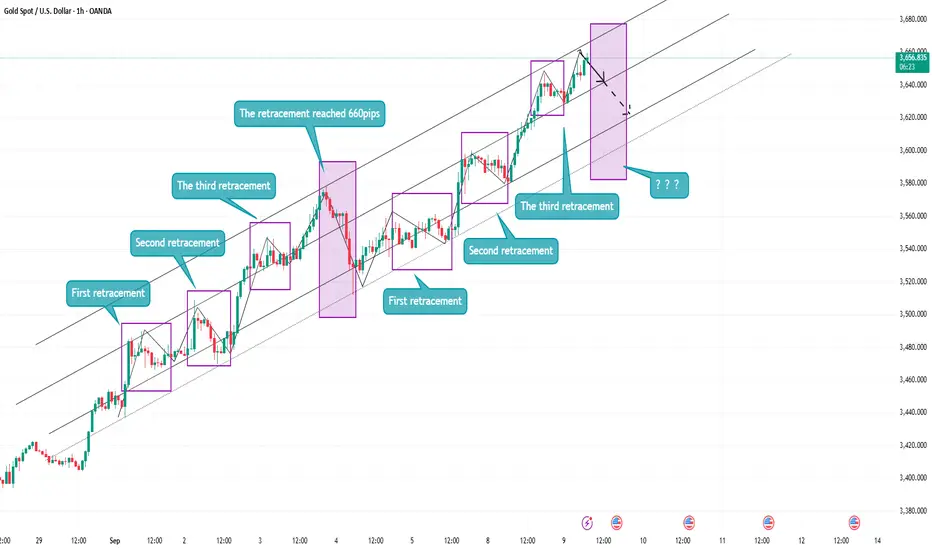
Cyclic Patterns Point to 600-Pip Downside in GoldUnfortunately, gold failed to reach the expected 3620 target area during the pullback. It only touched around 3628 in the early morning hours before rebounding again. During this period, because I saw that gold could not fall below 3628, and even could not fall below 3630 at one point, I promptly closed all short positions near 3630. Although the two transactions suffered losses due to the slightly lower entry price, because we added short positions near 3636 and 3646, the overall profit was still $10K.
Gold has now rebounded again and continued its upward trend to around 3657, continuing its upward trend. However, aside from opportunities to enter the long position in the 3630-3628 area, there are virtually no other good long entry opportunities. Judging from the current trend, gold still has the potential to continue to rise to around 3665, but since I missed the opportunity to enter the long position at 3630-3628, I will never choose to chase the rise of gold now.
Although the current uptrend is strong, even if you short gold, there are always opportunities to exit safely and profit during the day. Therefore, I still plan to try to short gold in the 3655-3665 area. Of course, keep my tips from yesterday in mind when shorting. When you first try shorting gold today, try to use a small lot size. When adding positions, you can appropriately increase the number of trading lots to increase the average price and increase profit margins. From a shorting perspective, it is relatively safer!
At present, I will pay close attention to the short-term support area of 3640-3630, followed by the area of 3610-3600. Don’t subjectively think that gold will not pull back to the 3610-3600 area, because in the previous band, after gold experienced three 200pips fluctuation retracements, the fourth retracement reached 660pips; and now gold has experienced three 200pips fluctuation retracements again. If it follows the cycle, gold may usher in another retracement of about 600pips, that is, reaching the 3610-3600 area.
Breaking Free: How Bears Can Win Back in GoldAfter touching the trend line resistance area of 3640-3650, gold fell back as expected, showing a high "doji" in the hourly candle chart and signs of stagflation. It is expected to become a market turning point in the short term. The gold market may usher in a good correction in the short term due to this technical turning point. However, we need to note that as long as gold remains above 3580, the current situation is still a strong bullish pattern, so we must pay attention to the extent of the retracement.
As gold continues to rise, the current short-term support is at 3620-3610, so I think it is necessary for gold to retrace its support in this area. Once gold is supported in this area, it may rebound again and retest the high area of 3640-3650. If gold falls below the short-term support area of 3620-3610, then gold will further retrace its steps to 3590-3580, which is the lifeline of bulls and the dividing line between bulls and bears.
If gold falls below the 3590-3580 area during the backtest, the current gold bull advantage will no longer exist, and the bears will likely regain control of the situation. As most long funds take profits and the market experiences panic selling, gold will completely turn into a bearish trend and fall further.
At present, I still hold short position in gold, and first aim at the short target area: 3620-3610 area. Once gold falls below this area, the target area will be postponed to 3600-3590 area. I am currently holding my short position and have already realized some profits. I very much hope that gold will fall back to the target area as expected!

“XAUUSD – Strong Retracement From New All-Time High (ATH) 3650“XAUUSD – Strong Retracement From New All-Time High (ATH) 3650 📉”
Gold (XAUUSD) reached the all-time high resistance / PRZ zone (3645–3680) and immediately showed rejection signs, confirming this level as a high-probability reversal point.
📊 Technical Breakdown
PRZ Rejection: The move above 3650 failed to sustain, indicating a liquidity grab and false breakout structure.
Momentum Exhaustion: A parabolic advance from 3330 support into ATH left behind multiple imbalances (FVGs) that now attract price back down.
Liquidity Dynamics: The rejection suggests buy-side liquidity has been taken, and the market may now seek sell-side liquidity below recent swing lows.
Market Structure: Intraday structure shows early signs of a bearish shift, with lower highs forming under 3635–3625.
🎯 Downside Targets
3585–3578 → First corrective level (38.2% retracement).
3565 → Key midpoint of the rally.
3545–3516 → Liquidity + 61.8–78.6% retracement cluster.
3480–3460 → Previous consolidation base.
3330–3320 → Major high-timeframe support demand zone.
⚠️ Invalidation
If buyers reclaim 3660–3680 with strong daily closes, the bearish retracement scenario will be invalidated, opening the path toward new ATH extensions.
📌 Conclusion:
Gold’s rejection at 3650 ATH PRZ is a significant technical signal. Current order flow suggests a retracement phase toward 3580–3515, with potential extension to 3330–3320 key support if selling pressure persists.

XAUUSD Hello Traders. This is my analysis for XAUUSD . If it breaks out of the trend line, we can expect a significant drop. Let's hope it will make a false breakout from the trend line and continue bullish.
I am not a professional and I would be happy if you share your opinion in the comments.
