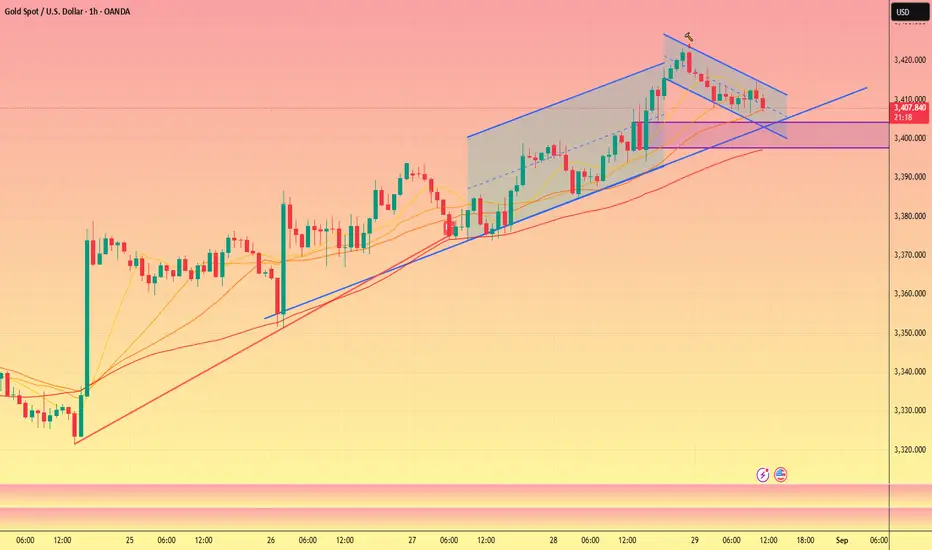
Gold (XAUUSD) Testing Support Before Potential Move HigherAnalysis:
The chart for Gold Spot (XAUUSD) on the 1-hour timeframe shows a strong uptrend within a rising channel, supported by higher lows.
Support Level: Price is currently testing a key support around 3,404–3,405. This level also aligns with the trendline, making it an important zone to hold.
Resistance Zone: The next major resistance lies between 3,430–3,445, where selling pressure could emerge.
Trend Outlook: As long as the support level holds, the bullish momentum remains intact, with potential for price to continue higher toward the resistance zone.
Risk Factor: A breakdown below the support and trendline could weaken the bullish structure and may trigger a pullback toward 3,390.
📈 Bias: Bullish above support, targeting resistance at 3,430–3,445.
📉 Invalidation: Bearish pressure may come into play if price closes below 3,390.
Xauusdanalysis

XAU/USD: Gold Dip to 3351? FX:XAUUSD is signaling a potential bearish move on the 1-hour chart , with an entry zone between 3400-3407 near a resistance level.
The target range of 3363-3351 aligns with key support zones, offering a clear downside play. 📈 Set a stop loss on a close above 3418 to manage risk effectively.
A break below 3395 with increasing volume could confirm this dip, driven by profit-taking and USD strength. Watch economic data releases! 💡
📝 Trade Plan:
✅ Entry Zone: 3400 – 3407 (resistance area)
❌ Stop Loss: close above 3418 to manage risk
🎯 Target Zone 1: 3363 – 3351 (key support levels)
Ready for this drop? Drop your take below! 👇


8/29: Sell in the 3446–3458 ZoneGood evening, everyone!
After testing the 3419–3427 resistance zone, gold pulled back briefly, then found support and broke higher, keeping the 1D uptrend intact. However, after such a sharp short-term rally, a pullback is likely.
📌 Key Supports: 3433–3428–3423
📌 Trading Plan: Short first, then buy
Main sell zone: 3446–3463
Look for short-term buys near support retests
Watch resistance reaction at 3438–3448
Heading into the weekend, news-driven uncertainty may increase — risk management is essential.

Gold retreats, buying opportunity reappearsAfter stabilizing at 3400 yesterday, gold prices continued their upward trend, reaching a high of 3423. This is very consistent with my view yesterday. The only regret is that gold prices did not return to 3400 after the article was published, and we missed this wave of gains.
Yesterday, in his speech on monetary policy, Waller expressed support for a 25 basis point interest rate cut in September and predicted further rate cuts within the next three to six months. If the employment data shows "significant weakness" in the US economy, he may support a larger rate cut (which is bullish for gold).
Based on gold's trend, 3400 OANDA:XAUUSD is definitely a key level. After yesterday's breakthrough, it has clearly become strong support. Therefore, I believe that as long as gold prices remain above 3400, the range of gold prices will likely be between 3400 and 3450.
Gold prices just retreated again. Not wanting to miss out, I bought around 3405, with a take-profit of $10-30 depending on the situation, and a stop-loss of $3395-3390.
If the 3395-3390 range is broken, don't go long on gold.

GOLD - at supporting area ? Holds or not??#GOLD.. after a fantastic bill run now market as t his current supporting area athat is around 3414-15
Keep close and if market hold it in that case we can expect further bounce .
NOTE: we will cut n reverse below 3414-15 on confirmation...
Good luck
Trade wisely

From Rally to Reversal: Gold Near PRZ, Bears Prepare!As I expected in the previous idea , Gold started to rise with the help of Powell's words and reached my targets(Full Target) .
Gold is currently entering the Potential Reversal Zone(PRZ) and is also moving near the Resistance zone($3,451-$3,406) and Resistance line .
In terms of Elliott Wave theory , Gold appears to be completing microwave 5 of the main wave C . The wave structure is a Zigzag Correction(ABC/5-3-5) .
I expect Gold to drop to at least $3,363 after entering the Potential Reversal Zone(PRZ) .
Second Target: $3,351
Third Target: Support lines
Note: Stop Loss (SL) = $3,416(Worst)
Gold Analyze (XAUUSD), 2-hour time frame.
Be sure to follow the updated ideas.
Do not forget to put a Stop loss for your positions (For every position you want to open).
Please follow your strategy; this is just my idea, and I will gladly see your ideas in this post.
Please do not forget the ✅ ' like ' ✅ button 🙏😊 & Share it with your friends; thanks, and Trade safe.

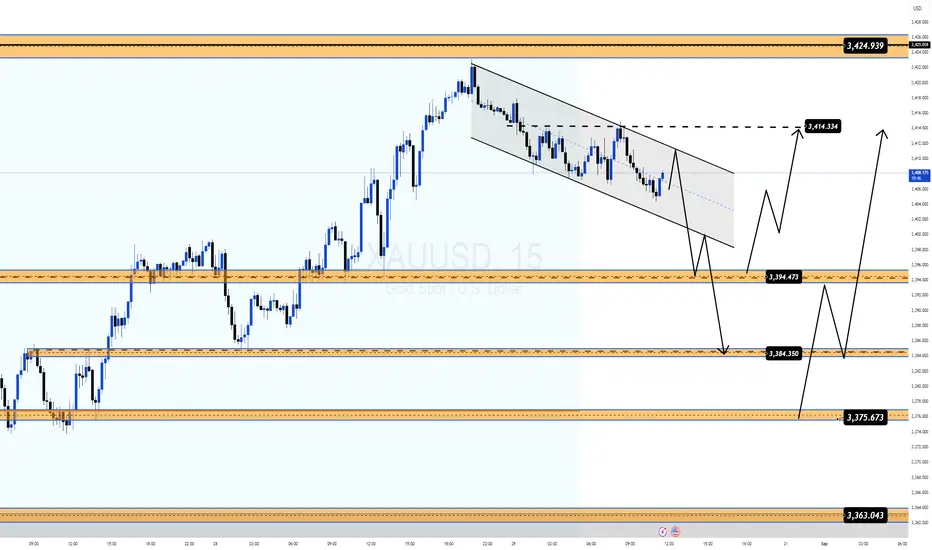
Gold at a Turning Point: Will PCE Data Trigger the Next Breakout🟡 XAUUSD PLAN UPDATE – MMFlow Trading
📰
Fundamental Context
Later today, traders are watching the US PCE Price Index – the Fed’s preferred inflation gauge.
Forecast: unchanged from the previous reading, which means no major inflation pressure.
If the data comes in slightly stronger for the USD, gold could face short-term downside pressure before bouncing.
Pre-news behaviour often includes liquidity grabs around key levels before the real move begins.
📊 Technical Outlook (M15)
Gold is trading inside a descending channel with several important zones:
Resistance / Supply:
3414.3 → short-term cap.
3424 – 3425 → strong supply zone.
Support / Demand:
3394.4 → interim support.
3384.3 → key demand zone.
3375.6 → structural support, trend pivot.
3363.0 → last line of defence if breakdown occurs.
🎯 Trading Scenarios (Pre & Post PCE)
1️⃣ Bullish Bias (primary scenario)
Holding above 3384 – 3375 suggests a rebound.
Break of 3414 opens the door to 3424 – 3425.
A clean break above 3425 could extend the bullish leg towards 3435+.
2️⃣ Bearish Scenario (if USD strengthens)
Failure at 3414 – 3420 may trigger a pullback towards 3384 – 3375.
A decisive break below 3375 risks further downside into 3363.
📍 Trade Plan (Guidance Only)
Buy zone: 3384 – 3375 (with confirmation signals).
Sell zone: 3414 – 3425 (short-term trades only, especially pre-news).
Stops: 5–7$ beyond key levels.
Targets: 10–20$ depending on risk appetite.
✅ Conclusion
Ahead of PCE: expect gold to accumulate within the channel, hunting liquidity.
After PCE: if data is slightly USD-positive, gold may dip into 3384 – 3375 before resuming its broader bullish path.
The overall bias remains bullish while above 3375 – 3363.
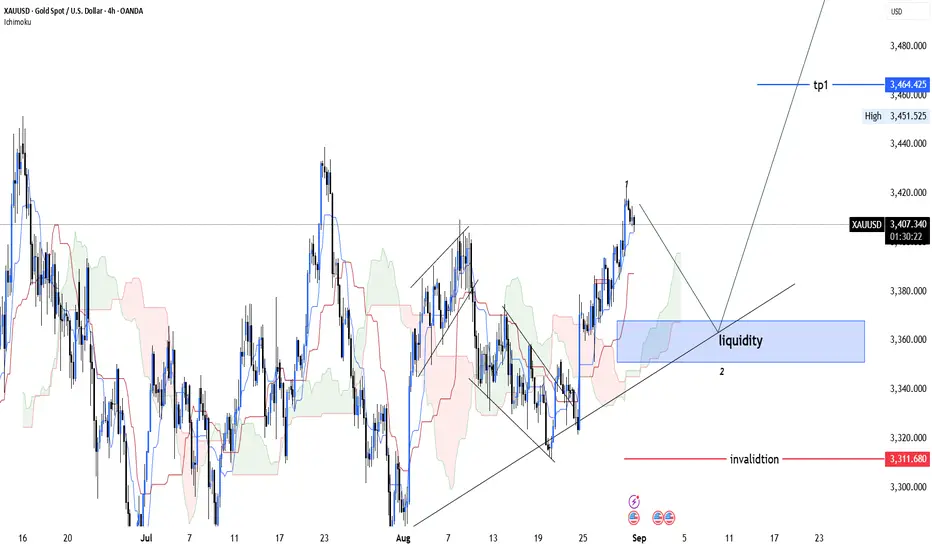
xauusd daily📊 XAU/USD – Wave Analysis
Gold is likely finishing Wave 1 and could correct down to 3352–3370 to complete Wave 2.
🔎 Analysis based on Fundamentals + Ichimoku + Elliott Wave
Xauusd analysis is ReadyThis analysis shows a bullish setup for Gold (XAU/USD). Price is moving in an ascending channel with entry near 3,407. The first target is set at 3,429 and the second target at 3,471, while the stop loss is placed below 3,379.

World gold price today August 29, 2025According to the report just released, the US GDP grew by 3.3% in the second quarter, higher than the initial estimate of 3.0% and exceeding economists' expectations. Real GDP was revised up mainly due to improvements in investment and consumer spending.
The US Department of Labor just released labor market data. Initial jobless claims, seasonally adjusted, were 229,000 for the week ending August 23. This figure was only slightly lower than the forecast of 230,000. The previous week's figure was revised down from 235,000 to 234,000.
In addition, continuing jobless claims reached 1.954 million for the week ending August 16, lower than the expected 1.975 million.
The labor market remains strong, leaving the Federal Reserve (Fed) with room to tighten monetary policy, putting pressure on gold prices.
Market sentiment was further strained after US President Donald Trump on Monday decided to fire Federal Reserve Governor Lisa Cook over allegations of improper mortgage lending, raising concerns about the independence of the US central bank.

Gold Sets Up for potential Upside Expansion as Buyers Step InGold (XAUUSD) is showing renewed bullish momentum after defending the mid-range support and reclaiming ground above the $3,410 zone. The structure suggests potential continuation higher with multiple bullish confluences aligning.
✅ Bullish Confluences:
Fibonacci Alignment: Price holding above the 38.2% retracement ($3,405) signals strength and potential for a higher retracement swing.
Volatility Band Support: Bounce from mid-band confirms buy-side defense and continuation potential.
Higher Low Structure: Recent consolidation maintained bullish structure, avoiding breakdown and favoring upside expansion.
🎯 Fibonacci-Based Targets:
TP1 – $3,429 (38.2%): First resistance target for partial profit-taking.
TP2 – $3,436 (61.8%): Next upside extension aligning with volatility resistance.
TP3 – $3,448 (100%): Full measured move completion toward upper band.
SL: Below $3,407 to invalidate the bullish thesis in case of breakdown.

GOLD BUY BOXES Hello Everyone Welcome Back !
Gold Buy Zones According To SMC
BOS + ORDER BLOCK (LL)
ZONES BUY - 3395 / 3385 , 3377 / 3372 , 3364 / 3350
Follow The Zones , These Are Buying Zones Where You Can Buy Gold And Get Profit , Comment Your Opinion And Follow Us For More Trades

Whether gold can hold steady at 3400 is the keyThe current market is bullish, primarily due to the developments surrounding Trump's proposed firing of Cook. Of the seven members of the Federal Reserve Board, three already support a rate cut: Bowman, Milan, and Waller. With the addition of another supporter, Trump's goal would be achieved. If Cook were to be fired and a more compliant candidate were to be promoted, the rate cut would be achieved, but the Fed's independence would also be undermined.
The dollar, US stocks, and US Treasuries would all be affected, and gold, the best safe-haven asset, would inevitably soar.
Today, we're focusing on two levels: 3400 and 3380.
If gold can stabilize above 3400 OANDA:XAUUSD , it's likely to head towards 3430-3450. At that point, you could consider buying around 3400.
Conversely, if it can't hold above 3400, it could test support at 3380. As long as it doesn't fall below 3380, it would be a good buying opportunity.
Good luck to everyone💪
📣If you have different opinions, please leave a message below to discuss
Is the entire network bullish? Trade with cautionGold rose yesterday without any obvious pressure, and bulls continued to exert their strength, 🐂but various technical indicators were close to the overbought area yesterday, and there is a need for technical correction in the short term. 📊
At the same time, due to the lack of certain news to drive gold, it is inevitable that gold will experience a correction today. 📉
Today's general trend is to go long when it falls back to support.📈 Focus on the effectiveness of the support at 3405-3395 below. After stabilizing here, you can consider going long and looking towards 3420-3430.🎯
Key data will be released later in the day, with core PCE data closely watched for new clues on whether the Fed will ease policy further after its September meeting. Any unexpected downside in the core PCE data could increase bets on a Fed rate cut, thereby weakening the US dollar and driving gold prices higher.👀
Today is Friday, and the weekly and monthly lines are about to come to an end. 📊It is necessary to be cautious in trading during the day to prevent unexpected events or possible one-sided market conditions. Strictly eliminate uncontrollable consequences caused by frequent transactions. 🙅♂️If there are any adjustments, we will notify you before the market opens.
XAUUSD – 1H | OB / CCH map Green = Buy OB, Red = Sell OB. Current price ~ 3410.7.
Key zones I’m tracking:
CCH / 1H supply: 3415–3422
HTF HIGH supply: 3435–3448
1H OB (near): 3382–3372
1H OB (deeper): 3334–3320
Scenario 1 – Rejection from supply (sell):
If price sweeps into 3415–3422 (CCH) or pushes into 3435–3448 (HTF HIGH) and 3–5m closes fall back below 3420, I’ll look for shorts targeting 3382–3372 first, then the 3334–3320 OB. Invalidation for the idea is sustained acceptance above 3450.
Scenario 2 – Mitigation then continuation (buy):
If price pulls back to 3382–3372 (1H OB) and prints a bullish shift (3–5m BOS/CHoCH), I’ll look for buys back to 3415/3422, and, if accepted above 3420, continuation into 3435–3448. If the first OB fails, the next buy zone is 3334–3320 (reaction-only with confirmation).
Execution: entries on 3–5m, always require a clear shift; no blind orders.

XAU/USD Intraday Plan | Support & Resistance to WatchGold rallied strongly yesterday, reaching into the $3,422 resistance zone, but failed to hold above and has since pulled back to around $3,409. Price is consolidating just above the $3,406 level, with short-term momentum still supported by the 50MA (pink) and 200MA (green) trending higher.
For the bullish case to continue, gold needs a decisive break and hold above $3,422, which would open the way toward $3,445. If price remains capped, we may see a deeper correction, first into $3,386, then $3,363, and potentially retesting the First Support Zone ($3,347–$3,328).
📌Key Levels to Watch
Resistance:
$3,422
$3,445
Support:
$3,406
$3,386
$3,363
$3,347
$3,328
🔎 Fundamental Focus – Friday, Aug 29
Today brings key U.S. data including Core PCE Price Index, Personal Income & Spending, Chicago PMI, and UoM Consumer Sentiment. These reports will give fresh signals on inflation and growth.
⚠️ It’s also the last trading day of August — expect higher volatility. Manage exposure carefully heading into the weekend.

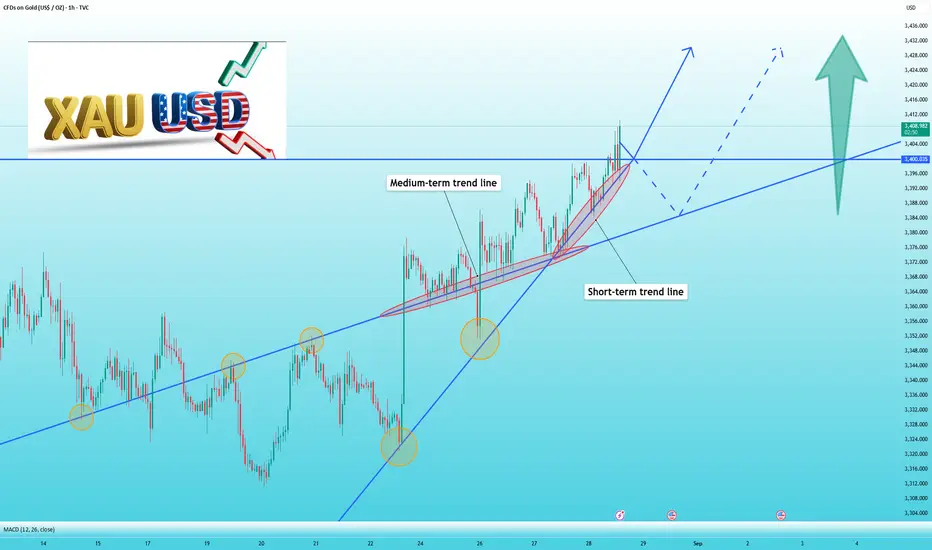
Gold, continue to be bullish!Gold opened yesterday and fell back to around 3384, then gradually fluctuated higher. After repeated consolidation in the US session, it broke through the previous high pressure of 3408, and reached the highest line of 3423. Finally, the daily line closed positive again, and the overall volatile and strong pattern continued. Today's thinking remains bullish, but it is not recommended to blindly chase more. The recent market is mostly based on the rhythm of adjustment and then pull up. In terms of operation, you need to wait patiently for the opportunity to confirm the retracement. In the 4H cycle, the upper track of the Bollinger Bands continues to open, but the indicators show a certain divergence. Although it is bullish in the short term, it is not suitable for chasing highs. Pay attention to the area near 3402-3390 for support below. If you fall back to this area, you can choose to arrange long orders. The upper target is around 3415-3430. It should be noted that the weekly and monthly lines were closed at the same time today, which may amplify the volatility. The occurrence of unilateral market cannot be ruled out. Discipline and risk control must be maintained in operations.

The market is bullish, so operate with cautionFederal Reserve Governor Tim Cook has filed a lawsuit against President Trump for attempting to fire her over allegations she lied on her mortgage application, raising concerns about the Fed's independence and potentially triggering further market panic.
Yesterday's daily chart closed positive, with technical indicators nearing overbought levels, prompting a correction in gold prices. Gold is currently consolidating around 3414. Avoid chasing gains in the short term. Focus on the support level of 3405-3395 below. If the European session pulls back to this level and stabilizes, consider going long, targeting 3420-3430. Conservative traders can enter the market after the NY data is released.
Today is Friday, and both the weekly and monthly lines are nearing their end. Data such as the PCE and consumer confidence index will be released later. Furthermore, the market is eagerly awaiting details about the Federal Reserve's interest rate cut in September. Therefore, caution is advised today. Independent traders must strictly adhere to their trading plans and be wary of unexpected events on Friday.

Gold 29/08: Smart Money Targets 3444 or Sweeps 3395Market Context (SMC View):
• Gold rejected from 3423 liquidity zone and is retracing into discount.
• Demand sits at 3397–3395, which could provide a bounce if tapped.
• Premium supply zones above 3422 and 3442 remain attractive for shorts.
________________________________________
🔼 BUY SCENARIO
• Buy Zone: 3397 – 3395
• SL: 3389
• TP: 3405 → 3415 → 3425
________________________________________
🔽 SELL SCENARIO 1 (Price Action)
• Sell Zone: 3422 – 3424
• SL: 3430
• TP: 3412 → 3400
________________________________________
🔽 SELL SCENARIO 2 (Swing)
• Sell Zone: 3442 – 3444
• SL: 3452
• TP: 3425 → 3412 → 3400
________________________________________
📌 Conclusion & Notes
• Bias: Buy on dips at 3397–3395, then look for liquidity grab around 3422–3424 or extended sweep into 3442–3444 for short entries.
• 3422–3424 is the first intraday supply zone, while 3442–3444 is the major swing sell zone.
• Patience: wait for rejection/confirmation candles before selling.
• Protect capital: keep SL tight, as gold tends to hunt liquidity around round numbers.

xauusd dobble top??base on trendline daily chanfge trend line and if close D1 candle bearish will be double top, price will be drop to 3376 and 2nd target 3351,
wait and see for today close candle and opening candle at monday

Interest rate forecast to decreaseMarkets now expect the Federal Reserve to begin cutting interest rates as early as September. Traders have almost fully priced in a 25 basis point cut, with further easing likely in October and December, according to the CME FedWatch Tool.
“Recent U.S. economic data have prompted us to revise our rate forecasts lower,” BofA said, citing signs of a cooling labor market. “Recent weakness in employment data, slowing job growth, and other signs of labor market slack could prompt the Fed to change its risk assessment.”
The bank also said political pressure on the Fed, including criticism from President Donald Trump, could continue to weigh on the dollar.
“The risks to the Fed’s independence are well recognized, but now markets must also factor in the implications of institutional weakness at statistical agencies,” the analysts stressed.

XAU/USD – End-of-Month Liquidity Sweep SetupGold is currently in a short-term corrective phase at the end of the month. Based on historical data, the past 4 months show that Gold tends to make a deep liquidity sweep towards the downside before resuming its bullish leg. This could once again be the case today.
📊 Key Observations:
Gold has shown repeated end-of-month wicks from 343x down to 335x zones.
Today’s focus: market may sweep liquidity below 3395 into the lower support zones before resuming higher.
Upcoming Core PCE data could trigger intraday volatility. If results align with the previous reading → short-term bearish pressure is expected before the larger bullish continuation.
📌 Key Levels & Zones
🔹 Resistance Zones
Supply Zone (3434 – 3436) → Ideal for short-term SELL setups.
Upper Resistance (3424 – 3435) → Breakout above this could open path to new ATH levels.
🔹 Support Zones
Key Support 1 (3395 – 3390) → First intraday liquidity area.
VPOC Zone (3376 – 3374) → Strong BUY zone, expect sharp reaction if price sweeps here.
Deep Liquidity Zone (3363 – 3355) → Extreme support; unlikely unless a major unexpected event occurs.
📌 Trading Plan
✅ BUY Zone
Entry: 3376 – 3374
SL: 3369
TP: 3380 – 3385 – 3390 – 3400 – 3410 – 3420 – ???
🎯 Best area to build long positions – aligned with VPOC & liquidity sweep expectations.
✅ SELL Zone
Entry: 3434 – 3436
SL: 3440
TP: 3430 – 3425 – 3420 – 3410 – 3400
⚠️ Short-term setup only – focus on Asian & London session corrections.
📍 Conclusion:
Expect liquidity sweep lower first before a bullish leg continues.
Watch 3395 – 3375 zones for BUY confirmations.
If price holds above 3375, Gold remains bullish heading into September.
