Elliott Wave Analysis – XAUUSD 27/08/2025
Momentum
• D1 timeframe: Momentum is showing reversal signals, as mentioned in yesterday’s plan. Currently, D1 is in the overbought zone, suggesting that bullish momentum has weakened and the market needs at least one corrective move to regain strength.
• H4 timeframe: Momentum is turning bearish. We need to wait for the current candle to close for confirmation, but there is a high probability that today’s main trend will be bearish.
• H1 timeframe: Momentum is in the oversold zone and preparing to turn up. If price rises into the overbought zone, then reverses bearish without breaking above 3394, there is a strong chance of a long-term decline – creating a sell opportunity.
________________________________________
Wave Structure
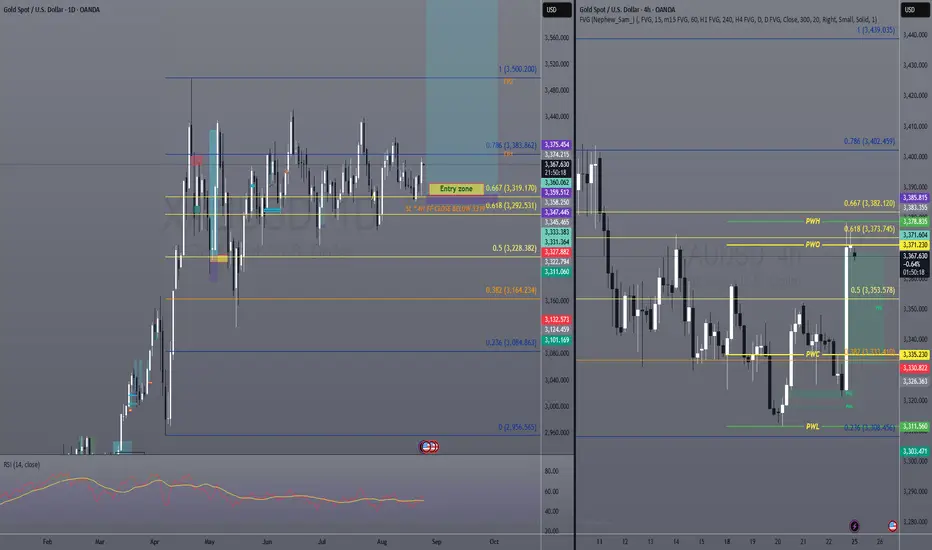
• D1 timeframe: With current reversal signals, there are two possible scenarios:
1. Triangle abcde – as shown in previous plans.
2. Combination correction (WXY) – where wave W is a zigzag, wave X is a double zigzag, and wave Y is a triangle (as on the chart). In this case, price may decline back toward 3311.
👉 Both scenarios are valid, with no clear dominance, so continued observation is required.
• H4 timeframe: A diagonal ending triangle is forming, combined with H4 momentum turning bearish. Although we need confirmation from the current H4 close, it is clear that bullish momentum is weakening → we should look for sell opportunities in line with H4 momentum.
• H1 timeframe: According to yesterday’s plan, we expected wave 3. However, several factors suggest otherwise:
o Price corrected deeply toward 3350.
o The rebound lacked strong momentum.
o An ending diagonal triangle appeared (not typical in wave 3, as it reflects very weak buying pressure).
o RSI shows bearish divergence, further confirming weakening bullish momentum.
Altogether, these point to a likely strong and sharp decline once the pattern completes.
📌 Ideal target zone: 3387 – 3390. If the current drop is wave A or wave 1, then the rebound of wave B or wave 2 should unfold within this zone.
________________________________________
Trading Plan
• Sell Zone: 3387 – 3390
• Stop Loss: 3397
• Take Profit:
o TP1: 3371
o TP2: 3350
o TP3: 3330
Xauusdanalysis

GOLD Local Short!
HI,Traders !
#GOLD is going up now
But will soon hit a horizontal
Resistance of 3394.70 from
Where we will be expecting a
Local pullback and we will
Be expecting a local move down !
Comment and subscribe to help us grow !

Unlocking Gold’s $3,600 Rally Before the Crowd /Best Entry Point1️⃣ General Overview
Gold remains in a corrective phase. Unless we see a clear 4H close above 372, bearish corrective pressure will stay stronger. However, certain zones may trigger bullish reactions if respected.
2️⃣ Key Levels
353 → First potential reversal area.
364 – 373 → Upside targets if 353 closes above this price on the 4H timeframe.
378 → Breakout level; above it price opens the way to higher targets.
382 – 392 – 402 → Next resistance levels if price closes above 378 on 4H timeframe.
335 → Strongest potential weekly buy zone if tested.
329 – 335 (ideal 35–29 range) → Ideal buy zone, though less likely to be visited this week.
3️⃣ Trade Scenarios & Setups
🔹Bullish Setup:
4H close above 353 → look for a move toward 364 → 373 → swing/open target.
4H close above 378 → momentum extends to 382 → 392 → 402.
Above 402 → new analysis will be required.
🔺 Bearish Setup:
4H close below 353 → decline toward 335 (strong weekly buy zone).
An extended drop into the 35–29 range = an ideal buy setup, but the probability is low.
GOLD Bullish Breakout!
HI,Traders !
#GOLD made a bullish
Breakout of the falling resistance
And the breakout is confirmed
So we are bullish biased
And we will be expecting
A further bullish move up !
Comment and subscribe to help us grow !

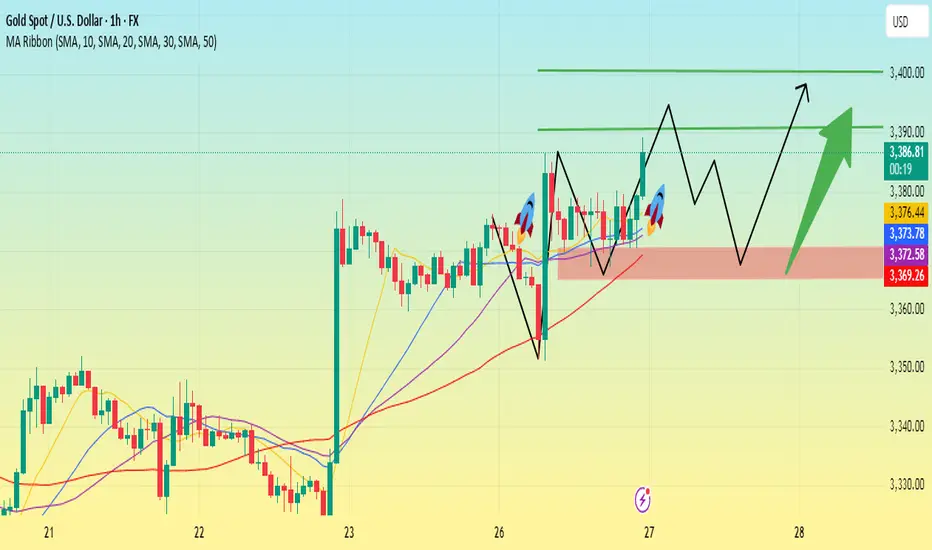
Explosive Rally Ahead: Gold Eyes a 3400 BreakoutThere is no doubt that as long as gold is above 3350, the current gold market will maintain a strong bullish structure. After today's sideways trading, gold has clearly established a support platform in the 3370-3360 area. Although it has repeatedly fallen back under pressure in the 3380-3390 area, it has rarely fallen below the short-term support platform of 3370-3360. In addition, the candlestick charts have repeatedly shown long lower shadows, proving that the buying momentum is strong and the market bullish enthusiasm is high! Therefore, in short-term trading, we can try to go long on gold based on the 3370-3360 support level.
However, it's important to note that gold has repeatedly come under pressure at the 3380-3390 resistance level. If gold consistently fails to break through this resistance level during its upward trend, bullish sentiment could be affected. Therefore, gold may need to retest support before any further gains. If it falls below the 3370-3360 level during this retest, it could extend to the 3355-3350 level, which is strong support in the short term. Therefore, if gold falls below the 3370-3360 level, it could retest the 3355-3350 level, prompting bulls to launch a counterattack.
Therefore, in the short term, given that gold maintains a bullish structure, I would primarily consider going long on gold.
1. Consider initiating a long position in gold in the 3370-3360 area; first, see if gold can break through the 3380-3390 area as expected.
2. If gold retests the support area, consider resuming a long position in the 3355-3350 area.

Daily Trading Plan – XAU/USD1. Key Levels for Today
Supports: 3,350 – 3,320 – 3,280
Resistances: 3,380 – 3,420 – 3,450
2. Bullish Scenario
✅ Entry Condition: If price holds above 3,380
🎯 Targets:
First target → 3,420
Second target → 3,450
🛑 Stop Loss: Below 3,350
3. Bearish Scenario
✅ Entry Condition: If price breaks below 3,350
🎯 Targets:
First target → 3,320
Second target → 3,280
🛑 Stop Loss: Above 3,380

XAUUSD possibly setting for another buy!Finally XAUUSD just had a breakout and price finally reached daily high. I am looking at 15min price action which is now on pullback. Potentially price to come back to 1h support consist of 1h fast ema ( 10ema) along with also align with 50% to 61.8% Fib level is an area of possible buy for this move to the upside.
However price needs to show a high level of rejection from that level for an entry to increase the probability of upside push.

Gold – US Session UpdateGold – US Session Update
Hello traders,
Gold is moving in line with the scenario, currently tracking wave 2 in Elliott, even though overall market volume remains light. What matters now is a clean break above 3386 resistance – that would provide enough momentum for gold to extend higher, with the next target around 3411, before continuing into wave 3.
At present, the setup is already running with around 200 pips profit. Traders can continue to hold positions, but taking partial profit (closing half) may help ease the psychology and allow more comfort in holding for extended targets.
For those who missed the earlier entry, the 3380 zone still offers a possible entry point. Although it’s slightly late, the target remains far enough to justify action.
Stick with this scenario if it aligns with your outlook – and always remember to manage risk carefully.
Wishing you success with your gold trades.

Unstoppable. Will it continue to break through?Gold quickly bottomed out and rebounded in early Asian trading. After hitting a low near 3351, it quickly rose and directly broke through last Friday's high, reaching a high near 3386, demonstrating that short-term bullish momentum persists.
From the 4-hour chart, short-term support is expected around 3365-3370. After a price correction, the bullish trend remains bullish. The short-term bullish stronghold is 3360. Until the daily chart breaks below this level, continue buying on pullbacks.
The 1-hour moving average is still diverging in a bullish direction, indicating further upside potential. Several short-term pullbacks to around 3367 have begun to rally. Therefore, it's advisable to continue buying at the 3365 support level with a light position. If gold unexpectedly breaks below 3360 and the rebound proves weak, the short-term trend of gold could weaken.
Trading strategy:
Short around 3395, stop loss at 3405, profit range 3370-3360.
Long around 3365, stop loss at 3355, profit range 3380-3390-3400.
XAU/USD M15 Update – Breakout or Fakeout?Gold has been consolidating in a tight 336x – 337x range throughout the day. Now, price is showing signs of pushing back towards the short-term high at 3377 – 3382.
👉 Two possible scenarios are on the table:
1️⃣ Liquidity Grab (Fake Breakout): Price retests the high → triggers FOMO buys → sharp rejection back down towards 3363 – 3355 liquidity zones.
2️⃣ Clean Breakout: If buyers hold control and break above 3382 – 3384, momentum could accelerate into the 3400 – 3402 resistance zone.
📌 Key Levels on M15:
Resistance: 3377 – 3384 | Major: 3400
Support: 3363 – 3354 – 3341
⚡ Trading Notes:
Don’t chase price into resistance.
Wait for clear confirmation around 3382 – 3384 before committing.
Scalpers can look for quick plays at 3363 – 3355 (buy zone) or fade rejection at 3382 – 3384 if breakout fails.
🔥 Gold is at a decision point – will it break higher into 3400 or trap longs before a deeper correction?
What’s your take? Drop your view below 👇

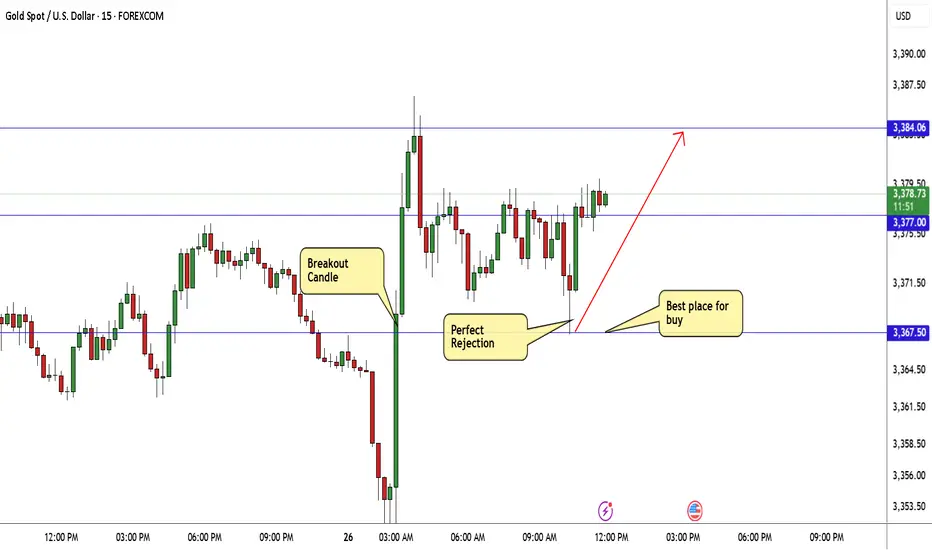
GOLD Breakout Done , Long Setup Valid To Get 200 Pips !Here is My 15 Mins Gold Chart , and here is my opinion , we finally above 3367.50 and we have a 4H Candle closure above it And Perfect Breakout and this give us a very good confirmation , so we have a good confirmation now to can buy after the price go back to retest the broken area 3367.50 , and we can targeting 100 to 200 pips . if we have a daily closure below this area this mean this idea will not be valid anymore .
Reasons To Enter :
1- Perfect Touch For The Area .
2- Clear Bullish Price Action .
3- Bigger T.F Giving Good Bullish P.A .
4- The Price Take The Last High .
5- Perfect 15 Mins Closure .
Downtrend Broken! Watch These Liquidity Zones for Big MoveMMFLOW Trading Plan | 26 Aug 2025 ⚡️
💰Gold is gearing up for a strong move!
Gold has broken the H4 downtrend line, showing strong buying momentum and liquidity sweeps, signaling a potential bullish continuation.
⚠️Warning: wide support zones below may trigger quick pullbacks to collect liquidity.
📊Market Context
USD is weakening amid political and Fed uncertainty
Trump attempting to influence lower interest rates, supporting gold
H4 downtrend line broken → buyers in control
Short-term: expect sideways movement + liquidity tests
Watch for quick spikes – FOMO buy zones are often targeted
⚡️Key Levels
Resistance: 3378 → 3384 → 3400
Support: 3363 → 3354 → 3340
🔥Trading Scenarios
✅BUY SCALP (Quick Moves – Short-term)
🔵Entry: 3355 – 3353
🔴Stop Loss: 3349
✔️Targets: 3360 → 3365 → 3370 → 3380 → 3390 → 3400+
✅BUY ZONE (Longer Setup – Swing)
🔵Entry: 3341 – 3339
🔴Stop Loss: 3335
✔️Targets: 3345 → 3350 → 3355 → 3360 → 3365 → 3370 → 3380 → 3390 → 3400+
💠SELL SCALP (Quick Reversals)
🔵Entry: 3382 – 3384
🔴Stop Loss: 3388
✔️Targets: 3378 → 3374 → 3370 → 3365 → 3360 → 3350
💠SELL ZONE (High Risk – Big Moves)
🔵Entry: 3400 – 3402
🔴Stop Loss: 3406
✔️Targets: 3395 → 3390 → 3385 → 3380 → 3370 → 3360
⚠️Risk Notes
Expect fast drops or spikes – stops can trigger quickly
Sideways movement likely in sessions + retests of highs
Only trade when price action confirms key zones
🎯Key Takeaways
Gold is poised for strong bullish continuation, but pullbacks will occur to collect liquidity
Use support/liquidity zones for entries, resistance zones for exits
MMFLOW = Market Rule | Key Levels = Profit

Smart Money Playbook: Where Will Gold Hunt Liquidity Next?Gold SMC Daily Plan – 26/08
Market Context (SMC perspective):
Price is consolidating near 3375 after an impulsive bullish move. There’s uncollected liquidity above 3385–3400, an FVG around 3354, and a deep buy zone at 3323–3327. Structure remains bullish unless 3327 is broken.
________________________________________
Key SMC Zones
• Liquidity Pool: 3385–3400 (potential sweep before reversal)
• FVG: 3354 region – watch for reaction
• Buy Zone: 3323–3327 (SL 3320)
• BOS/ChoCH: Upside confirmed above 3354; bearish shift if 3327 breaks
________________________________________
Trading Scenarios (SMC Logic)
1) BUY SCALP – Quick Liquidity Grab
• Entry: 3350–3352 (FVG support)
• SL: 3343
• TP: 3355 → 3360 → 3375 → 3385 → 3400+
Reason: Mitigation of FVG + bullish BOS continuation.
________________________________________
2) BUY ZONE – Swing Setup
• Entry: 3339–3336 (deep OB)
• SL: 3334
• TP: 3340 → 3350 → 3360 → 3365 → 3370 → 3380 → 3390 → 3400+
Reason: Possible liquidity sweep below 3340 before upside continuation.
________________________________________
3) SELL SCALP – Quick Reversal
• Entry: 3380–3383 (above intra-day liquidity)
• SL: 3385
• TP: 3378 → 3374 → 3370 → 3365 → 3360 → 3350
Reason: Sweep of local highs → BOS to downside.
________________________________________
4) SELL ZONE – High-Risk Liquidity Sweep
• Entry: 3400–3402
• SL: 3406
• TP: 3395 → 3390 → 3385 → 3380 → 3370 → 3360
Reason: Hunt major liquidity above 3400, then reversal.
________________________________________
SMC Flow for Today:
• Look for buy confirmations around FVG 3354 or deep buy zone 3327.
• If price sweeps 3385–3400 first, watch for sell setups with BOS confirmation.
• Structure bias flips bearish only if price closes below 3327.

Continue to go long on pullbacks, and bulls continue to rise.As for the trend of gold today, as expected, after gold tested the top and bottom conversion position of 3350, it took off directly under the influence of the opening and news, rising from 3351 to 3386. At present, 3385 is not the end point, and 3400 is also within reach. After we gained 310pips of profit at the opening, what should we do now? Continuing to trade low and long is the main idea today. After the hourly line was pulled up by a big Yang, the trend returned to the control of the bulls. 3350 is the starting point for today's rise, and the second retracement bullish point can no longer look at 3350, because if it falls to 3350 again, the trend will change from extremely strong to weak and volatile. The second bullish point is in the retracement concentrated area, which is around 3360-3368. If the retracement is in place today, you can continue to try to buy!
Gold operation suggestion: go long around 3360-3368, target at 3380-3390-3400.

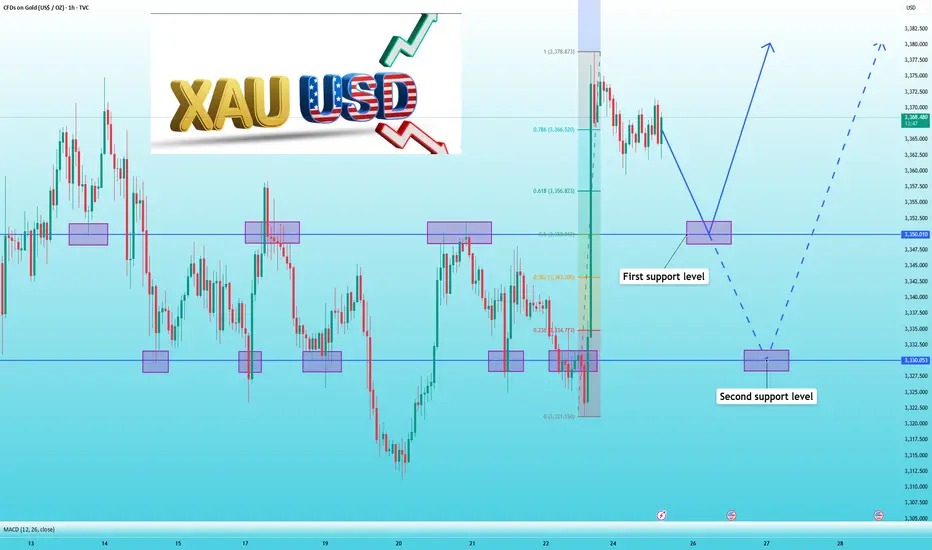
XAUUSD: Don’t rush to chase the rise, wait for a pullback firstThis year's Jackson Hole symposium, held at a policy crossroads for the Federal Reserve over whether to cut interest rates, captivated global attention.
Powell's shift from hawkish to dovish rhetoric ignited the market, completely contradicting previous market forecasts. The US dollar subsequently fell sharply, leading to a breakout rally in gold, from $3,330 to around $3,380.
In the short term, gold prices surged strongly last Friday, with many investors chasing long positions. Therefore, we should be wary of a pullback after profit-taking. Furthermore, Powell's speech last Friday has largely been digested, and the excitement has cooled somewhat.
In the long term, gold prices will undoubtedly continue to rise. A Fed rate cut is imminent, and any reduction, regardless of the magnitude, would represent a resumption of quantitative easing. The resulting situation is foreseeable. The US dollar will continue to decline, while gold will continue to rise, potentially reaching a new all-time high of $3,500.
Looking at the 1-hour gold chart, 3350, which has previously failed to break through, will be the next key support level. If it holds, buy boldly. If it breaks, look for further support at 3330.
Therefore, don't rush into trading. Waiting for the right entry point will be more efficient and more stable.
Gold first long then short,The rhythm is perfectly controlled.Arrange to go long on gold near 3363 and exit with profit near 3375, gaining 120pips. Then arrange to go short near 3376 and directly drop to 3355 target level, gaining another 210pips, and the overall gain is 330pips.
Gold maintained an overall range-bound pattern yesterday, with limited short-term fluctuations. After falling to around 3351 at the opening today, it rose strongly to around 3386 under the stimulation of news, basically recovering the lost ground of yesterday's volatile pullback. The daily line closed in a doji pattern overnight, and has the momentum to rebound further to the upper track of the range in the short term.
From the 4H cycle, the overall situation is still in a slow bull market oscillation pattern. The market has been able to rebound quickly after several declines, showing that the downward support is strong. Among them, the 3350 middle track line is an important bull support level. Today's rapid bottoming out and rebound has further verified the effectiveness of this position. In terms of operation, it is recommended to continue to focus on buying on pullbacks, pay attention to the 3365-3355 support area, and the rebound target will first look at 3385-3395. If it can break through, it is expected to further look at the 3400-3420 area.
Gold operation suggestion: go long around 3365-3355, target 3380-3390. If the market hits and remains under pressure and fails to break through the 3385-3395 area, consider shorting gold.

3360 is the lifeline for bulls,and a pullback means making moneyFrom a news perspective, Trump's dismissal of Federal Reserve Board Governor Tim Cook earlier this morning triggered heightened risk aversion, pushing the Fed into an unprecedented situation and potentially leading to a legal conflict. Amidst the current US economic and inflationary fluctuations and financial market instability, this incident has undoubtedly further complicated the already sensitive interest rate policy situation.
From a technical perspective, yesterday's small negative bar oscillated. After hitting the bottom of the middle track in the morning, the gold price pulled up and broke through the upper pressure of 3375-3380. The bull market dominated the market, and buying on pullbacks is still the main theme of current trading. The short-term upper pressure is focused on the 3392 line. As the gold price continues to rise, the short-term support will move up accordingly. The lower side will focus on the 3365-3355 support range.
If gold falls back to the support area of 3365-3355 in the European session, you can consider going long, with the target at 3385-3400.

Intraday gold trend analysis and trading strategiesGold closed positive on the daily chart and retreated slightly after opening in the morning. The overall trend is still fluctuating, waiting for a breakthrough. From the 4H chart, we can see that the MACD indicator is golden cross and running with large volume, and the dynamic indicator is showing a broken line and pressing down, which means that there may be a decline in the short term. Currently, the 4H middle line is near 3345, which is consistent with our judgment of short-term bottom support. Conservative traders can wait for it to fall back to the 3356-3345 area and then enter the long position, with the target looking at 3375-3390.

Fed Chairman 'Paves Way' for Rate Cut in SeptemberGold prices started the new week in the US market slightly down. Last Friday, the market reacted positively to the speech of the Chairman of the US Federal Reserve (Fed) Jerome Powell at the Jackson Hole conference. Mr. Powell signaled that the Fed could cut interest rates as early as the September meeting, helping the stock market recover and putting pressure on the USD.
However, investors are still worried about the uncertainty. Inflation in the US is higher than the target of 2% and the labor market is showing signs of weakness. This has left Fed policymakers divided on the view of cutting interest rates.
The Fed chairman has "paved the way" for a rate cut in September. This decision has provided support for many assets, including gold.

XAUUSD: Targeting $3600 By End Of The YearGold has successfully bridged the liquidity gap in the daily timeframe, indicating a bullish trend since then. We have an opportune moment to initiate a bullish position within our “drawn” area. However, it is imperative to verify the volume and price dynamics in a shorter timeframe. Upon witnessing robust confirmation, it would be optimal to take any position.
We extend our best wishes for successful trading. It is crucial to adhere to meticulous risk management practices during trading. It is important to note that this analysis does not guarantee price movements in accordance with the provided description.

Gold Scenario – Following the Medium-Term UptrendGold Scenario – Following the Medium-Term Uptrend
Hello traders,
Gold continues to move in line with expectations. Price reacted at the Fibonacci 1.618 resistance, effectively completing a liquidity test. The 3368 zone now offers a reasonable area to consider long positions.
With the previous ABC Elliott cycle complete, gold appears to be forming a new wave structure. Price is likely in wave 3 of the uptrend, pulling back slightly at the H4 descending trendline, before finishing with wave 5 breakout, which would also confirm the flag pattern forming on H4.
Trading plan: Look to buy around 3368, with a strict stop placed below the previous swing low.
Profit target: 3410 is a reasonable first take-profit. After that, expect a wave 4 correction, where short setups can be considered.
The MACD remains supportive, holding above its average and confirming bullish momentum. At this stage, it’s all about finding the right entry and trading with discipline.
This is my personal outlook for gold in the short to medium term. Use it as reference, and feel free to share your perspective in the comments so we can discuss further.

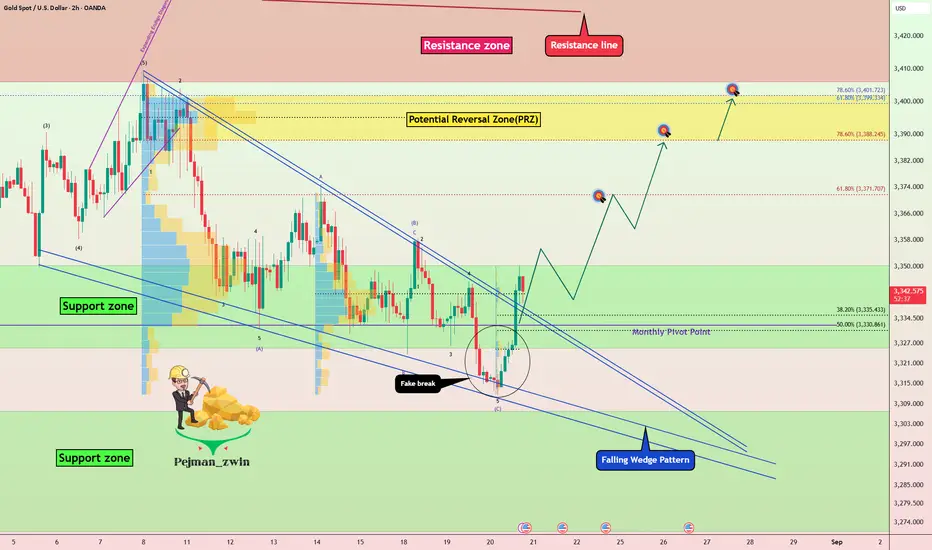
Gold Breaking Out of Falling Wedge Pattern – Rally Ahead?After creating a fake break below the Support zone($3,350-$3,326) , Gold ( OANDA:XAUUSD ) rose again above this zone and the Monthly Pivot Point .
If we look at the Gold chart on the 2-hour time frame from a Classic Technical Analysis perspective, we can see a falling reversal pattern , with Gold currently breaking the upper line of this pattern .
In terms of Elliott Wave theory, it seems that Gold is completing a corrective wave , and we should wait for the next impulse wave .
I expect Gold to start rising from the Support zone($3,350-$3,326) and rise to at least $3,369.
Second Target: Potential Reversal Zone(PRZ) = $3,402-$3,388
Note: Stop Loss (SL) = $3,320
Note: From today until Friday, important indexes will be released from the US, which can create excitement in financial markets, especially Gold, and even change the market trend when released.
FOMC Meeting Minutes = Today
Unemployment Claims = Tomorrow
Flash Manufacturing /Services PMI = Tomorrow
Fed Chair Powell Speaks = Friday
Gold Analyze (XAUUSD), 2-hour time frame.
Be sure to follow the updated ideas.
Do not forget to put a Stop loss for your positions (For every position you want to open).
Please follow your strategy; this is just my idea, and I will gladly see your ideas in this post.
Please do not forget the ✅ ' like ' ✅ button 🙏😊 & Share it with your friends; thanks, and Trade safe.
XAUUSD LONG H1XAUUSD with confirmation of imbalance area, long position will be good for timeframe H1
