XAU/USD Intraday Plan | Support & Resistance to WatchGold is trading around $3,326, moving lower after repeated failures to reclaim the $3,344 resistance yesterday. Price is now testing the lower edge of the First Support Zone ($3,324–$3,344).
It remains capped below both the 50MA (pink) and 200MA (green), which have flattened out, indicating a bearish or indecisive market structure.
If sellers gain momentum and break below $3,324, focus shifts toward the Secondary Support Zone ($3,304–$3,281). A clean break under $3,281 would expose the HTF Support Zone ($3,254–$3,229).
For buyers, only a sustained move back above $3,344 and the 200MA would shift momentum, opening the path toward $3,364 and $3,386.
📌 Key Levels to Watch
Resistance:
$3,344
$3,364
$3,386
$3,406
Support:
$3,324
$3,304
$3,281
$3,254
$3,229
📌 Fundamental Focus – Friday, Aug 22
Today’s spotlight is on the Jackson Hole Symposium, with key speeches from Fed Chair Powell, FOMC members, and President Trump expected to drive volatility. Markets will be highly reactive to policy signals and geopolitical remarks.
⚠️ Friday Risk Warning: Expect higher volatility, potential intraday manipulations, and sharp position adjustments as markets head into the weekend close. Liquidity often thins in late Friday sessions, so manage exposure carefully and avoid holding unnecessary risk over the weekend.
Xauusdanalysis

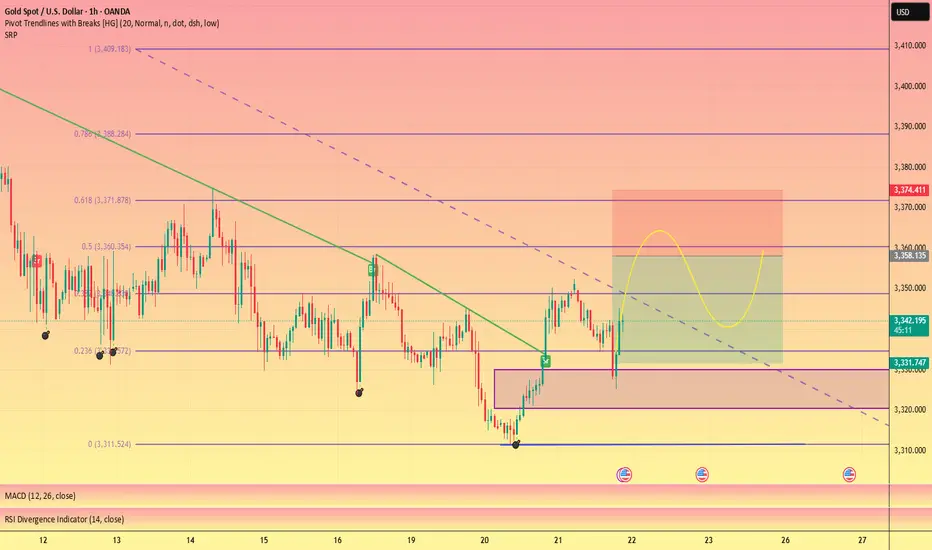
XAUUSD Trade Idea 2025/08/20Gold has been ranging between 3287-3393 for a long time.
Price recently has shown a reaction at Fib 0.618 and creating a new HH, now it's time wait for a new HL to confirm a market structure shift in lower tf. There will be a potential Long setup if it retest the recent support area around 3330, and targeting the range high.

22/8/68 : XAUUSD ( Europe / London Session )Using it from Europe Session until 7.00PM , I'll new analysis and update at 8.00PM
Resistance
3348-3353
3338-3343
3333
Support
3323
3312-3317
3302-3307

XAUUSD – Gold in Tight Consolidation | Weekend Trading PlanGold is currently showing the classic sequence: accumulation – breakout – consolidation again. Price is moving within a narrowing triangle pattern, preparing for the next explosive move.
From both a technical perspective and the macro–geopolitical backdrop, Gold is hesitating to choose a clear direction in the short term. But remember: the tighter the range, the stronger the breakout.
👉 Strategy: Wait for the breakout, then follow the direction with clear key levels for reactions and take-profit setups.
🔑 Key Levels
Resistance: 3337 – 3343 – 3350 – 3356 – 3365
Support: 3325 – 3320 – 3314
📌 Scenario 1 – Buy Setup
Buy Zone: 3316 – 3314
SL: 3309
TP: 3320 – 3325 – 3330 – 3335 – 3340 – 3345 – 3350 – 3360 – 3370
📌 Scenario 2 – Sell Setup
Sell Scalp: 3348 – 3350
SL: 3355
TP: 3344 – 3340 – 3335 – 3330
Sell Zone (Main Reaction): 3365 – 3367
SL: 3372
TP: 3360 – 3355 – 3350 – 3345 – 3340
🎯 MMFLOW Notes
Price compression = incoming volatility.
Always prepare two scenarios when trading narrow ranges.
Patience is profit – wait for market confirmation at key levels.

Xauusd analysis ready This analysis suggests a bearish outlook for Gold (XAU/USD). Price is expected to decline from the current level, with a stop loss near 3350, a first target at 3314, and a second target at 3295.

Gold Price Analysis August 22The gold market in recent sessions has shown a rather weak bullish force, so the possibility of a decline at the end of the week is worth noting. Currently, the price is still fluctuating in the important border zone of 3359 - 3330.
Notable points:
3330 is still a key support zone. However, it is advisable to wait for a clear confirmation signal from the candle before taking action to avoid falling into the False Break trap.
When 3330 is broken, the buying reaction may only appear around 3303.
Absolutely limit trading against the trend when there is a clear breakout signal.
🎯 Reference strategy:
SELL: Activate when the price breaks and maintains below 3330 → Target 3285.
BUY: When the candle closes above 3340 → Target towards 3380.

Elliott Wave Analysis – XAUUSD 22/8/2025
Momentum
• D1 timeframe: Momentum is turning bullish and has already formed 3 consecutive bullish candles. However, there has not been a strong breakout yet → this is a warning sign to stay cautious. If price continues with 2 more bullish candles, momentum will likely enter the overbought zone and risk a reversal.
• H4 timeframe: Momentum is in the oversold zone and preparing for a reversal. At the moment, the two momentum lines are sticking together, suggesting price may continue to correct. A bullish H4 confirmation candle is needed; once confirmed, we could expect 4–5 consecutive bullish H4 candles.
• H1 timeframe: Momentum is currently declining and showing early signs of reversal. However, since it has not yet entered the oversold zone, a confirmed reversal is not guaranteed → further observation is required.
Wave Structure
• D1 timeframe: The corrective triangle abcde (red) remains valid, and the wave 1–2 (blue) structure has not been invalidated.
• H4 timeframe: Price is currently in wave 2 (yellow). A break above the wave 1 high would confirm wave 2 is complete and wave 3 has begun. Wave 3 is typically strong, steep, and sharp – this would be a key confirmation signal.
• H1 timeframe:
o Yesterday’s decline to 3327 formed an ABC structure, suggesting wave 2 (yellow) may have completed. Afterward, strong bullish candles appeared.
o However, wave 3 usually moves with clear strength, while the current move is still corrective → a warning sign.
o The expanding triangle scenario for wave C (purple) is still not invalidated, so caution is required.
Two Main Scenarios on H1
1. Wave 1–2 (black):
o Wave 2 could complete around 3332 – 3330.
o This view is invalidated if price breaks below 3325.
2. Flat Correction ABC (blue):
o Wave C could target 3321 – 3320.
o This view is invalidated if price breaks below 3311.
o If invalidated, the expanding triangle scenario for wave C would come back into play.
Trading Plan
• Scenario 1 – Short-term Buy:
o Buy: 3332 – 3330
o SL: 3325
o TP1: 3348
o TP2: 3362
o TP3: 3381
• Scenario 2 – Deeper Buy:
o Buy zone: 3321 – 3320
o SL: 3311
o TP1: 3348
o TP2: 3362
o TP3: 3381

Gold (XAU/USD) Analysis - 22 August 2025Gold continues to trade within a high-volatility range, and today’s structure provides us with very clear execution zones validated across the Daily, 4H, and 1H timeframes. By blending price action, order flow, and institutional concepts, we can refine both the buy and sell areas that carry the highest probability of delivering asymmetric returns.
Macro Context (Daily)
The daily chart maintains a bullish undertone as higher-lows remain intact, and price continues to defend key demand blocks. That said, the upper range resistance around the $3360–$3380 area has capped recent rallies, leaving the market positioned between a strong daily demand base and significant supply overhead.
Swing Structure (4H)
On the 4H, gold is consolidating between a fresh demand block at $3318–$3324 and a supply block at $3356–$3362. This consolidation aligns perfectly with premium/discount zones of the current 4H range, giving us clarity on where institutional flows are likely to engage.
Execution Refinement (1H)
The 1H chart adds precision:
A bullish FVG and demand overlap sit at $3320, creating inducement for long entries.
Above, clear liquidity is resting just beyond $3355 and again near $3380, prime zones for potential stop-runs and reversals.
Momentum indicators (RSI/MACD) show hidden bullish divergence at demand and early exhaustion at supply — adding weight to both sides of the range.
Execution Zones
Primary Buy Zone (Golden Zone) → $3318 – $3324
Entry: $3322 | SL: $3312 | TP1: $3345 | TP2: $3360
Confluence: Daily demand OB + 4H discount zone + 1H FVG + RSI divergence.
Secondary Buy Zone → $3302 – $3308
Entry: $3306 | SL: $3296 | TP1: $3328 | TP2: $3340
Confluence: Deep retracement into 61.8% Fib + untapped 4H OB + liquidity sweep potential.
Primary Sell Zone → $3356 – $3362
Entry: $3359 | SL: $3369 | TP1: $3342 | TP2: $3325
Confluence: Daily resistance + 4H supply OB + premium zone + liquidity inducement above $3355.
Secondary Sell Zone → $3378 – $3384
Entry: $3381 | SL: $3391 | TP1: $3360 | TP2: $3335
Confluence: Major untested daily supply + 4H imbalance + stop-run liquidity.
Executive Summary
The clearest asymmetric opportunity lies in the Primary Buy Zone at $3318–$3324, which aligns across Daily, 4H, and 1H with multiple layers of confluence. This zone provides tight risk control with substantial upside toward $3360.
Until we see a decisive break of either the $3300 handle or the $3380 resistance, expect gold to remain range-bound with sharp liquidity grabs at both extremes. Institutional order flow favors a buy-the-dip bias within demand zones, while rallies into supply should be approached with tactical shorts.
Golden Zone = Buy $3318 – $3324
(best confluence: demand OB + FVG + RSI divergence + structural HL defense)

Gold Price Analysis August 21Gold has broken the Trendline and returned to the wide trading range of 3330 - 3360, an important accumulation area in the past few days. This will continue to be the reference area for investors to find entry points.
In the Asian session, the price adjusted to around 3332 - the convergence between the lower edge of the accumulation zone and the 0.5 Fibonacci retracement of yesterday's increase. This is an important milestone to determine the next direction:
✅ If it rebounds from 3332 → the possibility of forming a new uptrend, target 3378.
❌ If H1 closes below 3332 → confirming the return of the downtrend, the price may expand to 3285 in the short term.
📌 Reference strategy:
Buy when the price retests 3333 and there is a clear buy signal.
Sell when it breaks & holds below 3332.
Sell DCA when it breaks 3320 (confluence of trendline + previous break zone).
🔑 Important Zone
Support: 3332 – 3320 – 3310 – 3300 – 3285
Resistance: 3358 – 3378

XAUUSD – Bullish Outlook Confirmed1. Yesterday’s Context
In my yesterday’s analysis, I mentioned that although Gold had broken below the 3330 support, it was most probably a false break.
Yesterday’s price action confirmed this view: Gold pushed back above the broken level, accelerated higher, and even broke above the falling wedge trendline, reaching a high around 3352. On top of that, the daily chart closed with a strong bullish engulfing pattern.
________________________________________
2. The Key Question
Is this the start of a larger bullish continuation?
________________________________________
3. Why the Setup Looks Bullish
• False break below 3330 quickly reversed.
• Break above the falling wedge trendline = strong bullish signal.
• Daily bullish engulfing confirms momentum shift.
• Technical structure now favors continuation to the upside.
________________________________________
4. Trading Plan
At the time of writing, Gold is in a normal correction after yesterday’s strong rally.
• I remain bullish.
• I am looking to buy dips into support zones.
• Target: around 3380 as the next upside level of interest.
________________________________________
5. Final Note 🚀
The outlook remains unchanged: the bias is bullish, and yesterday’s breakout gives conviction that buying dips is the right strategy.
Disclosure: I am part of TradeNation's Influencer program and receive a monthly fee for using their TradingView charts in my analyses and educational articles.

gold on sell retrace.#XAUUSD await selling on breakout below 3336. Target 3318, Stop loss 3347.
The rectangle holds bearish flag, 3339 also.
We await for any strong H1 closure above 3352 to buy long.

8/21: Sell High and Buy Low Within the 3358–3332 RangeGood morning, everyone!
Gold rallied strongly yesterday. On the 4H chart, bulls still show upward momentum, but price has now entered the key 3352–3358 resistance zone. On the 30M chart, divergence signals are emerging, suggesting that the higher gold climbs, the greater the risk of a pullback.
During a retracement, watch support at 3343–3337–3332. In the short term, consider trading within the 3358–3332 range by selling near resistance and buying near support, while closely monitoring support/resistance flips. If bulls sustain momentum and break above 3358, the 3363–3378 zone offers a relatively safer area to look for short setups.

XAUUSD: Channel Ride to the Top or Fakeout Incoming?Gold is moving inside an uptrend channel, building momentum after bouncing from support. Right now, price is testing the key zone 3344 – 3348 – this is where the market will decide its next move.
📊 MMFLOW Outlook
✅ Scenario 1: Trend continuation (main bias)
Holding above 3344 – 3348 keeps the bullish structure intact.
A clean breakout over 3348.7 opens the path to:
→ Target 1: 3361.2
→ Target 2: 3369.8 (top of the channel)
⚠️ Scenario 2: Deeper retest before the move
If price rejects 3348 – 3351, a dip back to 3334 is likely.
Buyers may step in here to reload positions and push price higher.
A break below 3334 would weaken the bullish setup short-term.
📌 Key Levels (NY Session):
Support: 3334 | 3344 – 3348
Resistance: 3361.2 | 3369.8
✨ MMFLOW Note:
👉 Bias stays bullish, but patience at liquidity zones is key.
👉 Follow the flow – manage risk before the market makes the move.

Gold Breakout Ahead of FOMC – Next Step Trading PlanGold Breakout Ahead of FOMC – Key Levels & Trading Plan
Gold surged strongly in line with MMFLOW’s previous outlook, breaking through short-term resistances and the descending trendline within just one session. This early breakout ahead of the FOMC meeting signals that bullish momentum is firmly in play.
Even though price moved before the actual FOMC release, the market confirmed our directional bias: after clearing liquidity below, Gold quickly bounced back, reclaiming higher zones. With positive fundamentals supporting the metal in the long run, the bullish case for XAUUSD remains intact.
Currently, structure shows a clean breakout of the bearish channel, and we are waiting for a retest of KeyLevels today to fuel the next bullish leg.
📊 MMFLOW Market Outlook
Primary Bias: Bullish – Buy the dips
Scenarios:
🔹 Buy opportunities near strong support levels
🔹 Tactical sells only at confirmed resistance with rejection
Daily chart left a strong bullish confirmation candle, suggesting that pullbacks are opportunities to reload long positions.
🔥 Trading Plan – Buy/Sell Zones & Scalp Strategy
✅ BUY SCALP
Entry: 3333 – 3331
Stop Loss: 3327
Take Profit: 3338 – 3343 – 3348 – 3352 – 3356 – 3360 – ???
✅ BUY ZONE (Swing/Position)
Entry: 3316 – 3314
Stop Loss: 3310
Take Profit: 3320 – 3325 – 3330 – 3335 – 3340 – 3350 – 3360 – ???
🔻 SELL ZONE
Entry: 3368 – 3370
Stop Loss: 3375
Take Profit: 3364 – 3360 – 3355 – 3350 – 3345 – 3340 – 3330
📌 Key Levels to Watch
Supports: 3332 – 3323 – 3315
Resistances: 3348 – 3362 – 3370 – 3383
🚨 Risk Note:
If price dips too deep into 331x, beware of potential liquidity traps. Always respect your TP/SL as volatility remains high around FOMC events.
✨ MMFLOW Reminder:
👉 KeyLevels = Profits.
👉 Buy the dips, ride the bullish pump.

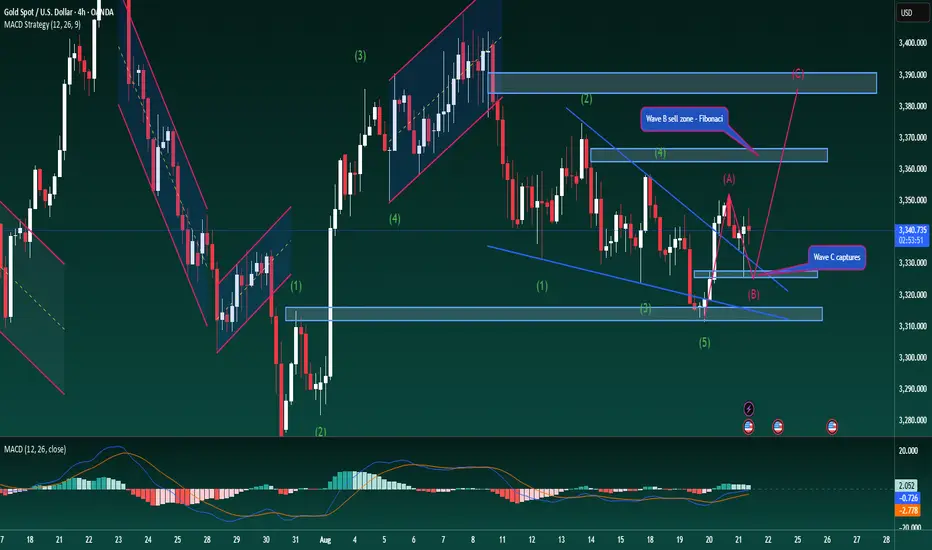
Gold – Elliott Wave “C” Begins (US Session Update)Gold – Elliott Wave “C” Begins (US Session Update)
Gold has reacted perfectly in line with Wave B, clearing the liquidity from yesterday’s H4 bullish candle and then surging strongly. The condition to look further towards Wave C – the final leg in the Elliott structure – is a decisive break above 3352. If confirmed, the long-term bullish outlook strengthens, with the next targets around 337x and potentially 3394.
News of a trade agreement between the EU and the US added strong momentum, helping to complete the corrective Wave B with impressive buying pressure.
For today’s US session, if you are still holding previous buy positions, it is worth keeping them. If not, the 3336–3340 zone provides a reasonable area to consider new long entries, with expectations that Wave C could extend towards 337x.
Always remember to place a tight stop-loss below the 3330 support area to manage risk effectively.
Wishing you success with this scenario – feel free to share your views in the comments below.
#XAUUSD #Gold #TechnicalAnalysis #PriceAction #ElliottWave #Fibonacci #Forex #Trading
A small rebound is not a trend reversal, continue to short#XAUUSD
Gold was stimulated by news yesterday and hit a high of 3352 at one point, but failed to effectively break through and stabilize above it. In the short term, it did not completely reverse the unilateral trend.📊
At present, gold continues to fall and rebounds after testing the effectiveness of the support level of 3330-3320 below. 📈In the short term, pay attention to the 3350 mark above.🌈 Once it breaks through and stabilizes above 3355, it is expected to test the resistance near the previous high of 3370.📉
On the other hand, if gold fails to maintain a firm footing above this level, it will likely remain volatile in the short term.↘️
This is why I didn't immediately follow up with a short position after closing my short position near 3335, 🤔opting instead to wait and see the market. 👀Gold has been fluctuating repeatedly recently. Please be cautious when trading and beware of falling into traps set by market makers.🎁
GOLD Best 2 Places For Buy & Best Place For Sell Cleared !Here is m y opinion on GOLD On 15 Mins T.F , We have a sideway movement since week start between 3343.00 to 3326.00 and finally yesterday we had a breakout and the price touch 3311.00 and the price moved to upside and again above 3326.00 so it`s still my fav place to can enter a buy trade , and the second place we can buy from it 3333.00 so we can buy from both levels , 3343.00 will be the best place for sell specially if we have not a daily closure above it , now the price very near buy area we can wait the price to retest the support area and then enter a buy trade and targeting 3343.00 and when the price touch it and give us a good bearish P.A , we can enter a sell trade and targeting 3326.00 ., and if we have a daily closure above 3343.00 i will think only for buy until end of the week .

GOLD Best Places To Buy And Sell Cleared , 400 Pips Waiting !Here is m y opinion on GOLD On 15 Mins T.F , We have a sideway movement since week start between 3343.00 to 3326.00 so we can buy and sell from both areas , 3343.00 will be the best place for sell and 3326.00 will be the best place for buy , now the price very near buy area we can wait the price to retest the support area and then enter a buy trade and targeting 3343.00 and when the price touch it and give us a good bearish P.A , we can enter a sell trade and targeting 3326.00 .

Trend change? No, the fluctuation is still there.During yesterday's NY trading session, Trump suddenly issued a statement saying that Federal Reserve Board member Cook must resign, implying that Cook may be suspected of criminal offenses. The market subsequently reacted to this, briefly surging to around 3350. Whether it can successfully break through 3350 remains a key short-term focus.
Gold opened high today and then plunged. The short-term volatility pattern has not changed. Currently, gold has returned to the 3340 line to consolidate. Although the daily line closed positively yesterday, the moving average is still in a bearish pattern. Judging from the hourly chart, technical indicators are currently weak. In the absence of any major news, we will maintain a bearish outlook for the time being.
In the short term, pay attention to the short-term pressure formed by 3345-3355 above. If you encounter resistance and pressure here, you can consider shorting with a light position. Pay attention to the support of 3335-3325 area below. Focus on the 100-day moving average, which is also yesterday's low of 3311. Once this position is broken, gold will fall to the 3300 integer mark, or even near the previous low of 3280.Today's focus will be on initial jobless claims data during the New York session.

H4 GOLD BUY Gold Give A Bullish Fvg After Big Falling So We Are Expecting A Bullish Setup Also Its Filled The Below IFVG And Break The Buy Trendline So Now We Will Buy Now Targeting Previous High Lets Goo For It
FOLLOW US FOR MORE TRADES
TRADE IN DEPTH MARKET

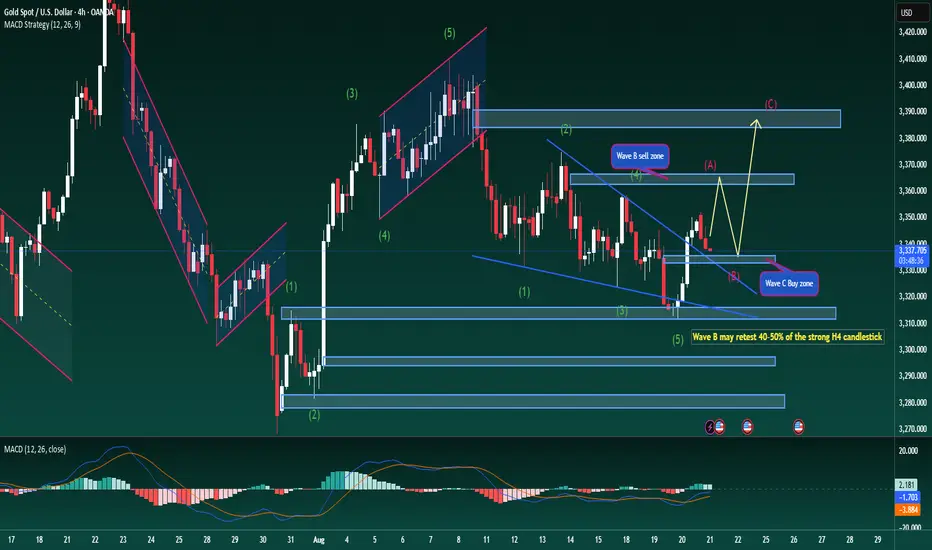
Gold Outlook After FOMC – Building a Bullish StructureGold Outlook After FOMC – Building a Bullish Structure
The latest FOMC meeting offered no new measures to support the economy, as Chair Powell suggested conditions remain stable and interest rates were left unchanged. Markets therefore stayed muted, with expectations now shifting towards September for potential policy moves.
On the technical side, gold has completed wave A after reacting to the daily trendline, and I expect the market is now forming an ABC corrective structure to complete a medium-term Elliott cycle. The recent rally also broke through the descending trendline on H4, confirming that bullish momentum may prove more sustainable.
At present, price is undergoing a mild pullback from the Asian session, with the potential to retrace 40–50% of the recent H4 candle. This move would also retest the broken descending trendline — if confirmed, it would establish a stronger bullish Dow structure and open the path for a longer wave cycle, at least until wave C plays out fully.
The H4 chart supports this scenario, as MACD averages are trending upward and volume is showing steady growth.
Buy zone: Around 3334, in line with the broader trend for medium- to long-term positions.
Sell zone: Around 3365, where wave C could complete and a new cycle may begin.
Gold is gradually showing a clearer technical structure. Patience and discipline with entries should help traders capture this move effectively.
#XAUUSD #Gold #TechnicalAnalysis #PriceAction #ElliottWave #Fibonacci #MACD #Forex #FOMC #Trading
Does #XAUUSD have the juice to break previous daily range high?It has been an interesting few days on XUAUSD, with many traders being confused on the direction it intends to go.
After yesterdays bullish momentum it is quite clear that the Bulls are not done yet, and given the fact that quite a large gap has now been filled on the daily chart, the possibility of Gold making a move to the upside seems to be the more probable move.
Targets are 3350 & 3370 for conservative exits.

XAUUSD: Trade Long GoldI will open a long position on gold again until the specified area reaches 3385-3387. I hope you are successful and profitable.
