8/18: Gold May Fall Below 3300 This WeekGood evening, everyone!
After testing the 3332–3323 key zone today, gold saw its first bullish rebound, pushing price back to the 3352–3358 resistance area. While bulls claimed a small victory here, the broader trend still favors the bears. For a genuine trend reversal, price must hold above 3350 and break through the major daily resistance at 3363. Otherwise, bulls remain under pressure, and as resistance gradually shifts lower over time, a lack of confidence could give bears the chance to drive price below 3300.
In this setup, the 3323–3332 support zone is critical for bulls. Holding it keeps the door open for further upside; losing it would turn 3332-3337( 3343–3348 )into a strong resistance area during rebounds.
Based on this outlook, the short-term strategy leans bearish. If price drops to 3310–3298 tomorrow, it could be a good opportunity to consider long positions. On rebounds, watch resistance at 3323–3328, with 3316–3321 acting as an additional barrier if bulls remain weak.
Xauusdanalysis

XAUUSD: The decline has stopped, continue to buyAs the talks between Trump and Putin achieved results on Saturday, risk aversion decreased, gold fell rapidly at the opening, and after briefly breaking through 3330, it found support again and rebounded strongly, reaching a high of 3358. Subsequently, the price of gold entered a slow decline, mainly because the market was waiting for the results of the talks between Trump, Zelensky and several European leaders, which was the main factor affecting the subsequent rise and fall of gold prices.
Personally, I think it is unlikely that this meeting will completely resolve the situation between Russia and Ukraine. Since it cannot be resolved, the geopolitical risks still exist, and the market's risk aversion is unlikely to decline, so gold will continue to rise.
Today's focus is on 3340. If support is found, consider buying.
🏆Trade setup:
📈Buy at 3340
✅Target 1 - 3355
✅Target 2 - 3370
🛑Stop Loss - 3330
📣If you have different opinions, please leave a message below to discuss

XAUUSD (Gold) 1H – Buy Setup From Key Support ZoneGold has recently pulled back after multiple rejections from the $3,389 – $3,390 resistance zone, showing sellers stepping in. Price is now approaching a key demand area around $3,309, where buyers previously defended aggressively.
📉 If price taps into the $3,309 support zone, we anticipate a strong bullish reaction that could drive price back toward the $3,390 resistance.
🔑 Trade Idea
Entry: $3,309 zone (confirmation of bullish rejection)
Stop Loss: Below $3,265
Take Profit: $3,389 – $3,390
Risk–Reward Ratio: ~1:3
📊 Technical Breakdown
🔵 Support Zone: $3,309 – Key structure level where bulls defended in the past.
🔵 Resistance Zone: $3,389 – $3,390, strong rejection area marked by multiple failed breakouts.
✅ Bias: Bullish from support to resistance, unless $3,309 breaks.
⚠️ Invalidation: A clean breakdown below $3,265 would flip bias bearish toward $3,200.

GOLD UPDATE: From Long TP to Short Entry - Range ContinuationGreat news! This morning's long entry is approaching our take profit target. 🎯✅
**📍 New Setup - Reversal Short:**
Now I'm looking to flip the script and go short from our long trade's take profit level. My target for this short position would be back down to this morning's entry point. 📉
**🧠 Market Psychology:**
I expect the upper resistance to hold once more, creating another leg of range-bound price action. This type of range continuation is common after strong moves - the market often needs time to consolidate before choosing its next direction. 🔄
**⚠️ Entry Validation:**
For the full entry rationale and technical setup details, make sure to check out this morning's post! The same principles apply, just in reverse. 🔄
**📊 Risk Management:**
As always, I'll be looking for that same 5:1 risk-to-reward setup. If the range breaks instead of holding, that invalidates the thesis and calls for a quick exit. 🛑
📈 **This trade setup offers a risk-to-reward ratio of 5:1.** Without including fees, the breakeven win rate for this trade would be approximately 16.67%. Knowing these figures in advance helps me avoid emotional trading. 🧠
💡 **Pro Tip**: If you often find yourself trading based on emotions, I recommend doing this type of pre-planning and quantifying your setups before execution — it can be a simple yet highly effective improvement. ✅
---
**Trading is simple.** You don't need multiple indicators or dozens of lines on your chart. A clean and simple chart often works best — it keeps your decisions consistent and reduces uncertainty. Sure, it might not look flashy, and my analysis may seem a bit "plain" compared to others… but that's how I like it. If you find this analysis useful, feel free to follow me for more updates.
---
*Disclaimer: This post is for general informational and educational purposes only. It does not constitute financial advice, investment recommendation, or a service targeting specific investors, and should not be considered illegal or restricted information in any jurisdiction.*

GOLD For Buy , Clear Closure & Clear Confirmation,200 Pips ClearHere is My 15 Mins Gold Chart , and here is my opinion , we finally above 3345.00 and we have a 4H Candle closure above it And Perfect Breakout and this give us a very good confirmation cuz we have not any 4H closure above this area since this week start , so we have a good confirmation now to can buy after the price go back to retest the broken area or even direct entry now to can use a small stop loss , and we can targeting 100 to 200 pips . if we have a daily closure below this area this mean this idea will not be valid anymore .
Reasons To Enter :
1- Perfect Touch For The Area .
2- Clear Bullish Price Action .
3- Bigger T.F Giving Good Bullish P.A .
4- The Price Take The Last High .
5- Perfect 15 Mins Closure .

Gold Corrects. Targeting an Upward Move?Gold opened Monday with a dip before rising, breaking below last Friday's low, continuing its downward trend. However, the market did not continue its downward trend after the break, instead undergoing a rapid rebound, reaching a high near 3358, but remaining below the resistance level of 3375.
Currently, gold prices are fluctuating around 3350, indicating a lack of upward momentum. The characteristic of volatile markets is that they tend not to sustain. Breaking through key points often leads to a rapid rebound, while approaching key resistance levels above, the market enters a period of stagnation and could experience a correction at any time. In the short term, focus on the first resistance level of 3350-3360, and the second resistance level of 3370-3380.
If the price continues to withstand pressure at the first resistance level and fails to break through, it will likely undergo a correction, accumulating upward momentum before retesting the upward resistance level. If the first resistance level is broken, we will focus on the second resistance level, which will be the watershed between bulls and bears this week. If it breaks through and stabilizes above this position, gold will usher in an upward trend. Support levels to watch are 3330-3310.

Gold price forecast difficult to break outThis week, analysts said that gold prices will still find it difficult to break out in the short term when the market lacks momentum to increase points. Factors that have supported gold prices to increase strongly in recent times, such as US tariff policies and geopolitical tensions in some regions, are all easing.
Mr. Daniel Pavilonis, senior commodities broker at RJO Futures, commented that although inflation data has edged up and interest rates have increased slightly, gold prices are still moving sideways within a narrow range. This development shows that gold is becoming less attractive in the eyes of investors and could fall below $3,000/ounce this year.
"If the US starts cutting interest rates and inflation rises higher, that could be a positive signal for gold. However, gold prices have been moving sideways for the past 4 months and the momentum for price increases in the short term is not high."
Long XAUUSD, H4 timeframe, Day tradeHere is an idea about Day trade of XAUUSD
Long
Buy Limit 3342
Stop Loss: 3328
TP: 3370

XAUUSD Analysis todayHello traders, this is a complete multiple timeframe analysis of this pair. We see could find significant trading opportunities as per analysis upon price action confirmation we may take this trade. Smash the like button if you find value in this analysis and drop a comment if you have any questions or let me know which pair to cover in my next analysis.

XAU/USD 18 August 2025 Intraday AnalysisH4 Analysis:
-> Swing: Bullish.
-> Internal: Bullish.
You will note that price has targeted weak internal high on three separate occasions which has now formed a triple top, this is a bearish reversal pattern and proving this zone is a strong supply level. This is in-line with HTF bearish pullback phase.
Remainder of analysis and bias remains the same as analysis dated 23 April 2025.
Price has now printed a bearish CHoCH according to my analysis yesterday.
Price is now trading within an established internal range.
Intraday Expectation:
Price to trade down to either discount of internal 50% EQ, or H4 demand zone before targeting weak internal high priced at 3,500.200.
Note:
The Federal Reserve’s sustained dovish stance, coupled with ongoing geopolitical uncertainties, is likely to prolong heightened volatility in the gold market. Given this elevated risk environment, traders should exercise caution and recalibrate risk management strategies to navigate potential price fluctuations effectively.
Additionally, gold pricing remains sensitive to broader macroeconomic developments, including policy decisions under President Trump. Shifts in geopolitical strategy and economic directives could further amplify uncertainty, contributing to market repricing dynamics.
H4 Chart:
M15 Analysis:
-> Swing: Bullish.
-> Internal: Bullish.
H4 Timeframe - Price has failed to target weak internal high, therefore, it would not be unrealistic if price printed a bearish iBOS.
The remainder of my analysis shall remain the same as analysis dated 13 June 2025, apart from target price.
As per my analysis dated 22 May 2025 whereby I mentioned price can be seen to be reacting at discount of 50% EQ on H4 timeframe, therefore, it is a viable alternative that price could potentially print a bullish iBOS on M15 timeframe despite internal structure being bearish.
Price has printed a bullish iBOS followed by a bearish CHoCH, which indicates, but does not confirm, bearish pullback phase initiation. I will however continue to monitor, with respect to depth of pullback.
Intraday Expectation:
Price to continue bearish, react at either M15 supply zone, or discount of 50% internal EQ before targeting weak internal high priced at 3,451.375.
Note:
Gold remains highly volatile amid the Federal Reserve's continued dovish stance, persistent and escalating geopolitical uncertainties. Traders should implement robust risk management strategies and remain vigilant, as price swings may become more pronounced in this elevated volatility environment.
Additionally, President Trump’s recent tariff announcements are expected to further amplify market turbulence, potentially triggering sharp price fluctuations and whipsaws.
M15 Chart:

Wait for pre-meeting guidance, focus on 3343-3330#XAUUSD
The current market focus is mainly on the upcoming talks.🤝 As expected, the news of the meeting between Trump and Putin was leaked over the weekend. 💻We still need to wait and see the news in the next two days to see whether the Russia-Ukraine war issue can be effectively resolved. 💠
If peace talks between the two sides can be effectively facilitated and risk aversion is reduced, gold will remain weak.🐻 Conversely, if the talks fail, a retaliatory bullish rally is highly likely.📈
Last Friday, gold prices fluctuated very narrowly, failing to find a valid trading point. ⚖️The early morning opening at a new low not only effectively allowed short sellers to exit their positions,😝 but also allowed market makers to reap the profits of last week's long traders😩.
Since the short sellers have all taken profits in the early trading session, there must be greedy people and traders seeking revenge in the market who will take over and short sell at low levels,📊 otherwise gold would not have risen so quickly. 📈
So, theoretically speaking, before the talks are concluded, I think the market will definitely eliminate the traders who shorted at the low level this morning.🐂
The overall hourly line is still under pressure at the high resistance line of 3358.💥 We will first see whether it can fall below 3343 in the European session. 🐂Only after it breaks will it test the small support of 3330. Otherwise, the bulls will still have to counterattack at a low position. Today, we will mainly go long at a low level.📈
🚀 BUY 3343-3330
🚀 TP 3355-3365-3370

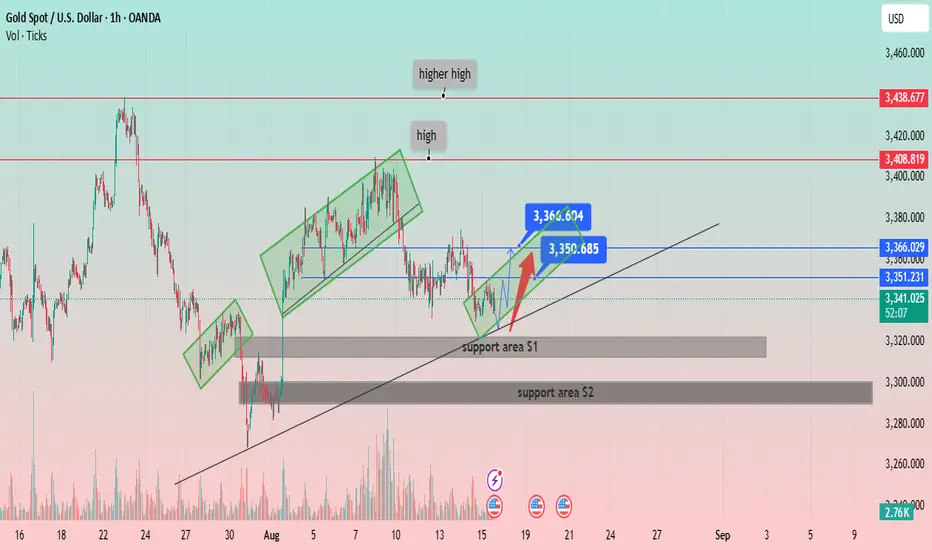
XAU/USD: Navigating the Uptrend and Key Support LevelsPrice Structure: Gold has been forming a series of higher highs and higher lows, indicative of a general uptrend. The chart labels a "high" and a "higher high," confirming this bullish structure.
Support and Resistance:
Two key support areas are identified:
Support area S1: A narrow zone around 3,320 USD. The price recently bounced off this area.
Support area S2: A broader, more significant zone around 3,290 USD, which appears to have been a strong support level in the past.
Several horizontal resistance levels are marked:
Immediate resistance: Around 3,351.231 USD and 3,366.029 USD.
Higher resistance: At 3,408.819 USD and 3,438.677 USD.
Channels and Trendlines:
The price has been moving within a series of ascending channels (highlighted in green rectangles), suggesting a stair-step upward movement.
A primary ascending trendline (black line) serves as a long-term support, with the price currently hovering just above it.
Recent Price Action and Projections:
The price recently broke out of a small downtrend and is showing signs of recovery from the "support area S1."
A potential price path is drawn with a red arrow, indicating a possible move towards the immediate resistance levels around 3,351 USD and 3,366 USD.
The chart highlights two specific price points, 3,360.604 USD and 3,350.685 USD, which likely represent a short-term trading range or target.
Volume: The volume spikes visible at key price points (e.g., at the low on July 30 and during the recent drop) indicate strong market activity.
Gold Price ForecastThe weekly gold survey by an international financial information platform shows mixed views among experts and investors. Of the 10 analysts who responded, only 10% said that gold prices would rise again, 10% said that gold prices would fall, but up to 80% predicted that gold prices would remain stable. The lack of a clear trend in gold prices shows the unpredictability of precious metals.
Meanwhile, investors were more optimistic. Of the 183 investors who responded to the survey, 63% said that gold prices would rise again, 18% said that gold prices would fall, and 19% expected gold prices to remain stable.
Mr. Adrian Day - Chairman of Adrian Day Asset Management said that gold prices will continue to fluctuate within a narrow range with a steady upward trend. The US Federal Reserve's (FED) expected interest rate cut in September has been reflected in the market, so gold prices need more monetary easing to break out more strongly.

XAUUSD edges lower on geopolitical reliefXAUUSD edges lower on geopolitical relief
Gold dipped in early Asian trading on Monday, as easing geopolitical tensions reduced its safe-haven appeal. Despite no progress in Friday’s Trump-Putin meeting, Trump told European leaders he’s open to U.S. security guarantees for Ukraine, with Putin reportedly agreeing to Western troop presence in any peace deal.
On the contrary, Thursday's PPI came out weaker than expected, signaling the possibility of a higher inflation in the nearest future. This may influence on Jerome Powell's decision on the U.S. key rate. Some experts already expect Powell to be hawkish on September 17. This week Powell will be participating on annual Jackson Hole event.
XAUUSD has been moving within a wedge for the last week. MACD is turning into a green zone on 4-h chart. Price successfully rebounds from the local support of 3,300.00. Future sideways movement is expected, the price may rebound from local support of 3,300.00 towards 3,380.00 as a first target.

Gold Price Analysis August 18Gold has just had a liquidity sweep to 3323 and quickly closed the H4 candle above the Fibonacci 0.5 level, showing that the bullish wave structure is still maintained. The next target that the market is aiming for is the resistance zone of 3358 - where Fibonacci 0.618 and the new trendline formed last week converge.
If the buying force remains stable, there is a high possibility that gold will soon conquer the 3400 level.
📌 Trading strategy
BUY when the price breaks the trendline, resistance or exceeds Fibonacci at 3358.
BUY around Fibonacci 0.5 with a confirmation signal of buying force at the 3345 area.
Target: 3400.
SELL trigger when the price breaks 3331 with a candle confirmation signal.

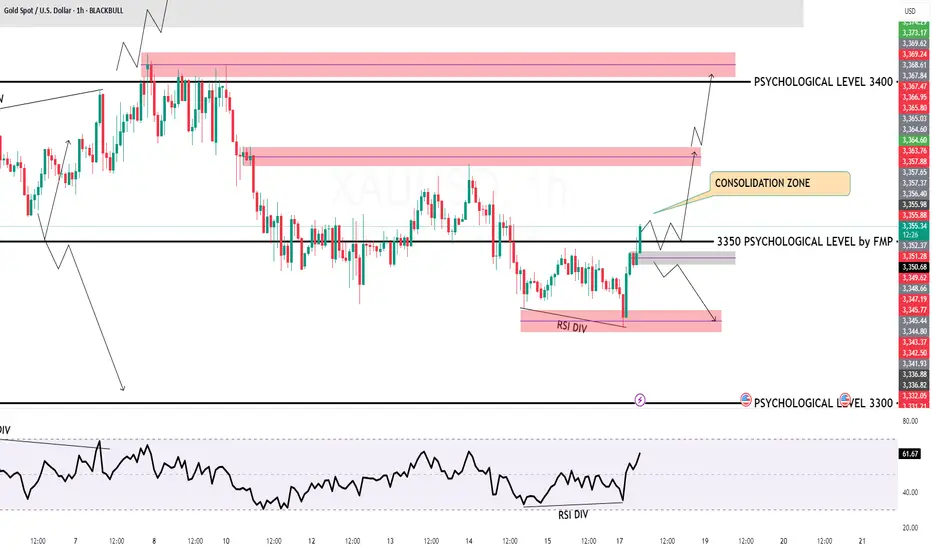
GOLD H1 Intraday Chart Update For 18 AUG 2025Good Morning Traders
as you can see that GOLD successfully break 3350 Psychological for Shorter term scenario
All eyes on 3330 level breakout for the day if market breaks 3330 level then it will move towards 3310 level otherwise market will move towards 3380 level soon
Disclaimer: Forex is RISKY
Has gold bottomed out? A strong upward trend?Last Friday, gold prices fluctuated and consolidated below 3350, remaining range-bound near 3340 at the close of the US session. On Monday morning, gold prices quickly retreated to test support near 3325. The hourly chart then rebounded, breaking through and stabilizing above 3345, forming a V-shaped rebound. Looking at the 1-hour chart, gold prices rebounded quickly after falling in the early Asian session, and the moving average system continued to cross upward, indicating that there is upward momentum in the short term; however, after the current price broke through the suppression position of 3350, it continued to fluctuate at this position. If the price cannot break through the range of 3350-3360 for a long time, then there is a high probability that it will technically retreat and accumulate momentum to impact upward again. In the short term, focus on the upward resistance level of 3350-3360, with support near 3330.
Trading strategy:
Short around 3355-3360, stop loss at 3370, profit range 3330-3320-3310.
Long around 3320, stop loss at 3310, profit range 3340-3350-3360.

XAUUSD READY FOR DROP (READ CAPTION)Hi trader's.
current price:3357
gold today breakdown lower and H1 candle i watching sell
gold resistance zone 3358 and 33670
gold breakdown 3340 then gold fill down
resistance zone 3358_3365_3370
support zone 3340
target 3330_3325
please like comment and follow thank you

Buy strategy still works until 3345 is broken✏️Gold price has confirmed the break of Fibonacci 0.618 and is continuing the uptrend. However, surprisingly, the Asian trading session attracted some selling pressure, pushing gold to around the 3355 break zone. When confirming the break of 3358, 3345 became the most important zone of the uptrend and this is also a trendline zone in the H4 time frame. The BUY gold strategy is still the main one until 3345 is broken.
📉 Key Levels
Support 3360-3345-3313-3285
Resistance; 3381-3404-3430
BUY now 3360 Break out and Retest Support zone (Fibonacci 0.618)
BUY Trigger 3345 Rejection of the support zone with buying pressure candle
SELL Trigger Break and trading Bellow support 3343
Leave your comments on the idea. I am happy to read your views.

Today's important price zone 3332. Determine the Gold Trend✏️Gold continues to receive some buying pressure at 3332 Fibonacci 0.382 zone. Thus, 3332 zone becomes the Key Level zone in the current trend. Gold is currently trading in a 332-3360 border zone. When Price breaks the trendline as well as Fibonacci 3360, it will confirm clear buying pressure.
📉 Key Levels
SELL Trigger 3332 Confirmation of candle closing below the important support zone 3332.
BUY Trigger 3360 Buying force breaks the Trendline and breaks
Leave your comments on the idea. I am happy to read your views.

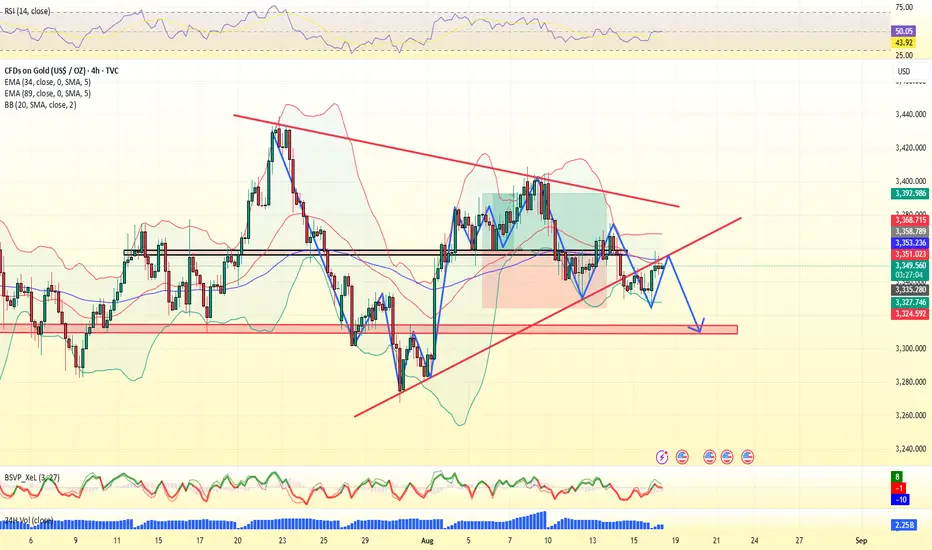
technical analysis of the XAUUSDPrice: Around $3,345 currently.
Chart Indicators
Zig Zag (5, 10): Helps highlight major swing highs and lows.
RSI (Relative Strength Index): 14-period with levels at 70 (overbought) and 30 (oversold).
Recent Low: Around $3,247 (late July).
Lower highs and lower lows indicate short-term bearish trend.
Price broke below a minor swing support around $3,380 and is now testing $3,345.
Zig Zag Pattern: Suggests corrective moves but overall downward bias after recent top at 3,438.
RSI Analysis
Recently peaked near 70 (overbought zone) during mid-August high.
Currently near 50 (neutral), showing consolidation after a sell-off.
Signal: No clear divergence, but bearish momentum eased after recent drop.
Key Support & Resistance
Support Levels:
$3,320–3,330: Near-term support zone.
$3,247: Major previous swing low (strong support).
Resistance Levels:
$3,380–3,400: Immediate resistance (recent broken support).
$3,438: Last swing high (strong resistance).
Volume Analysis
Downward move from $3,438 to $3,345 happened with moderate volume, suggesting steady selling pressure but not a panic drop.
Possible Scenarios
Bullish Scenario (Reversal or Pullback)
Price needs to hold above $3,330 and break $3,380 to target $3,420–3,438.
RSI moving above 60 would strengthen bullish momentum.
Bearish Scenario (Continuation)
If price breaks below $3,330, next target is $3,300, then $3,247.
RSI dropping toward 30 would confirm strong bearish momentum.
Trade Idea (Not Financial Advice)
For Bulls: Wait for a break & close above $3,380 for a potential long entry.
For Bears: Watch for a break below $3,330 for a potential short toward $3,247.
Stop-loss: Use nearby swing highs/lows for risk management.
Overall Sentiment:
Currently neutral to slightly bearish, as price is below key resistance and forming lower highs.

Gold Longs from 3,300 (11hr demand zone)Weekly Gold Analysis
For this week, I’m watching for short-term sell opportunities down into the 12H demand zone. At the moment, price is showing momentum to the downside, so we could see a setup form in the 12H supply zone before continuation.
However, my main focus remains aligned with the long-term trend, which suggests a potential rally forming from the 11H demand zone.
I’ve also noted a trendline forming above current price — meaning the reaction from the 12H demand zone could play out sooner than expected. That said, given the imbalance below, price may first need to mitigate a supply zone before breaking structure further to the downside.
Confluences for Gold Longs:
- Higher timeframe structure remains bullish overall.
- Significant upside liquidity still needs to be taken.
- An 11H demand zone remains unmitigated.
- For price to continue higher, a retracement is necessary.
- DXY analysis aligns with this bullish outlook.
P.S. Pro-trend trades take priority — but if a sell setup forms, I’ll approach with caution, lower risk allocation, and tighter TP targets.

Gold is calm, where will it go next week?This Friday, I repeatedly emphasized the idea of short selling (repeated profits). Now, judging from the recent data, my confidence in the interest rate cut expectations has been shaken. CPI inflation is mixed because the market is worried about the worries after the interest rate cut, which makes it difficult for gold prices to break the range. I am very optimistic about the continuation of the short position when the market opens next week. The profit from adjusting the short selling idea did not disappoint me. Many friends who trade independently in the market are always worried about a sudden rebound in the market when they short, and afraid of a rapid price drop when they go long. In fact, this just reflects a lack of sufficient confidence in their own trading system. Truly mature traders are not afraid of market fluctuations, but rely on systems and plans to remain calm and disciplined in different trends. For more specific operations, please pay attention to the bottom.
The 1-hour moving average of gold is still a dead cross and diverging downward. The short-selling force of gold is still there, and there is no sign of turning around at present. That means there is still time or space for the short-selling of gold. The 1-hour moving average of gold is still suppressed by the downward trend line. The trend suppression of gold moves down to around 3345-3360 in the short term. If gold rebounds next week and is under pressure at 3345-3360, continue to short it. If it falls below the support line near 3330 below next week, then the downward space of gold will open further, and then continue to short it when gold rebounds.
Gold operation suggestion: short around 3345-3360, target 3330-3320.
