XAUUSD Beginning of a Trend Reversal? Bearish Move IncomingGold is showing signs of potential downside pressure on the 4-hour chart. After a rejection from the upper volatility band and a failure to sustain bullish momentum above the dynamic EMA cloud, price has rolled over and is now trading below the midline support area.
🔻 Bearish Structure Developing:
Price rejected strongly from the upper gray zone (Resistance band).
A new lower high has formed, aligning with bearish market structure.
Candles are trading under the red-to-blue transition EMA ribbon, indicating increasing bearish sentiment.
🎯 Trade Setup:
Entry: Near 3,365
SL: Above the recent high near 3,406
TP: Targeting the lower band support around 3,300 – 3,323
Xauusdanalysis

Gold Spot / U.S. Dollar (1h Chart) - OANDA1-hour chart from OANDA shows the price movement of Gold Spot against the U.S. Dollar (XAU/USD). The current price is $3,323.720, reflecting a decrease of $45.480 (-1.35%) over the last hour. The chart includes a candlestick representation with a notable downward trend, a support level around $3,324.455, and a resistance zone between $3,352.955 and $3,360.000. The time frame displayed ranges from 12:00 to 3:00, with the data updated as of 12:52 PM PKT on June 24, 2025.

Gold Trading Strategy June 26✏️ D1 candle shows a recovery but not significantly. Gold is currently reacting at the key resistance zone of 3342.
The immediate support zone that the price is heading toward is 3326. This forms a breakout range between 3326 and 3342.
A bullish channel may form if there is a strong price reaction at 3326. Conversely, if 3326 is broken, it could confirm a continuation of the downtrend targeting 3302 during the European and US sessions today. The bearish target could even extend to 3278.
📈 Key Levels
Breakout Range: 3326 - 3342
Support: 3326 - 3314 - 3302 - 3278
Resistance: 3342 - 3363 - 3388
📊 Recommended Trade Setups
BUY: 3302–3300 | SL: 3297
SELL: 3363–3365 | SL: 3369

Buy gold first, and short on gold after filling the gapGold is currently continuing to retreat, and the lowest has reached around 3333. Gold is quite weak, and the bears have completely taken the upper hand. The overall center of gravity of gold is shifting downward, and the short-term support below is 3330-3325. Once gold falls below this support area, gold may continue to fall to 3300, or even 3280; since gold has fallen to the 3340-3330 area, we cannot rush to short gold in the operation, because there is a technical gap above that needs to be filled, so gold still has a rebound to 3360-3370 in the short term.
Therefore, before gold falls below the short-term support of 3300-3325, we can appropriately consider going long on gold; after gold rebounds technically and fills the gap above, we can consider continuing to try to short gold in the 3360-3370 area.

GOLD Bearish Breakout!
HI,Traders !
#GOLD is trading in a
UPtrend and Broke our of the bearish
Wedge pattern then made
A retest and is going down
Now so we are bearish
Biased and we will be
Expecting a further move down !
Comment and subscribe to help us grow !

Weakness continues, continue to short the bear market📰 Impact of news:
1. Pay attention to Powell's speech in New York
2. Pay attention to geopolitical influence
📈 Market analysis:
Gold opened lower and showed a weak situation. The 1H moving average was arranged downward. In the short term, bears still occupied the main trend. From the 4-hour analysis of gold, the bulls still had repeated resistance before breaking down. Once it breaks down, the market will go further bearish. Pay attention to 3330 below. 3400 is still the key above in the short term. Only by breaking through the bulls can the rebound continue. In terms of operation, high-altitude and low-long are temporarily maintained. Pay attention to the short-term resistance of 3355-3365 above, and the support of 3340-3330 below. Pay attention to the breakthrough! Pay attention to Powell's speech in the New York session.
🏅 Trading strategies:
SELL 3370-3365-3355
TP 3340-3330
BUY 3340-3335-3320
TP 3345-3355-3365
If you agree with this view, or have a better idea, please leave a message in the comment area. I look forward to hearing different voices.
TVC:GOLD FXOPEN:XAUUSD FOREXCOM:XAUUSD FX:XAUUSD OANDA:XAUUSD

XAUUSD is still on Rising channel on D1H4 Timeframe Analysis
Gold is currently holding the falling wedge pattern on H1 & Rising wedge on D1 Today we have volume opening Gap on OANDA which is still pending.
Market is holding the Range of 3330-3380
What's possible scanarios we have?
if gold sustained with this falling channel and H4 remains above 3320-3330 then Before the US market, I think gold can still return to around 3350 then 3370.
On the otherhand if The H4 candle closes below 3320 buyying will be limited and market will again the rangbound 3290-3330
#XAUUSD

XAU/USD: The truth may be late, but it will never be absent.Trump tweeted late at night that a ceasefire had been reached between Israel and Iran, causing gold and crude oil prices to crash straight away.
So far, neither side has officially announced the ceasefire, and new explosions continue to be reported, with the situation likely to reverse at any moment. Market sentiment runs faster than the truth, but the truth will catch up sooner or later.
Key Focus Points:
1.Monitor the authenticity of the ceasefire
2.Track Fed dynamics: If the Fed hints at rate cuts under pressure, the bullish logic for gold will remain intact.
XAUUSD
sell@3365-3375
tp:3340-3330
buy@3330-3340
tp:3360-3370
I am committed to sharing trading signals every day. Among them, real-time signals will be flexibly pushed according to market dynamics. All the signals sent out last week accurately matched the market trends, helping numerous traders achieve substantial profits. Regardless of your previous investment performance, I believe that with the support of my professional strategies and timely signals, I will surely be able to assist you in breaking through investment bottlenecks and achieving new breakthroughs in the trading field.

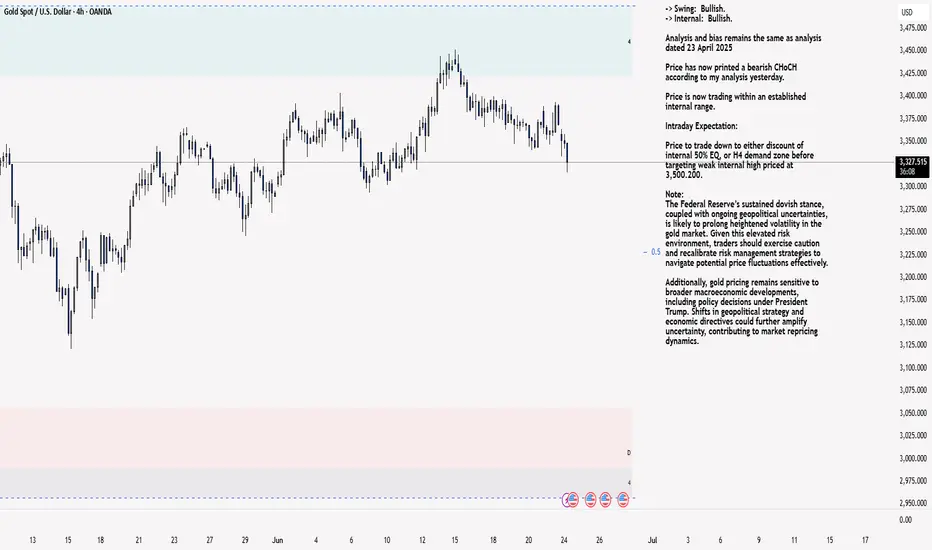
XAU/USD 24 June 2025 Intraday AnalysisH4 Analysis:
-> Swing: Bullish.
-> Internal: Bullish.
Analysis and bias remains the same as analysis dated 23 April 2025
Price has now printed a bearish CHoCH according to my analysis yesterday.
Price is now trading within an established internal range.
Intraday Expectation:
Price to trade down to either discount of internal 50% EQ, or H4 demand zone before targeting weak internal high priced at 3,500.200.
Note:
The Federal Reserve’s sustained dovish stance, coupled with ongoing geopolitical uncertainties, is likely to prolong heightened volatility in the gold market. Given this elevated risk environment, traders should exercise caution and recalibrate risk management strategies to navigate potential price fluctuations effectively.
Additionally, gold pricing remains sensitive to broader macroeconomic developments, including policy decisions under President Trump. Shifts in geopolitical strategy and economic directives could further amplify uncertainty, contributing to market repricing dynamics.
H4 Chart:
M15 Analysis:
-> Swing: Bullish.
-> Internal: Bullish.
Following previous high, and printing of bearish CHoCH, price has pulled back to an M15 supply zone, where we are currently seeing a reaction. Therefore, I shall now confirm internal high.
Price is now trading within an established internal range.
The remainder of my analysis shall remain the same as analysis dated 13 June 2025, apart from target price.
As per my analysis dated 22 May 2025 whereby I mentioned price can be seen to be reacting at discount of 50% EQ on H4 timeframe, therefore, it is a viable alternative that price could potentially print a bullish iBOS on M15 timeframe despite internal structure being bearish.
Price has printed a bullish iBOS followed by a bearish CHoCH, which indicates, but does not confirm, bearish pullback phase initiation. I will however continue to monitor, with respect to depth of pullback.
Intraday Expectation:
Price to continue bearish, react at either M15 supply zone, or discount of 50% internal EQ before targeting weak internal high priced at 3,451.375.
Note:
Gold remains highly volatile amid the Federal Reserve's continued dovish stance, persistent and escalating geopolitical uncertainties. Traders should implement robust risk management strategies and remain vigilant, as price swings may become more pronounced in this elevated volatility environment.
Additionally, President Trump’s recent tariff announcements are expected to further amplify market turbulence, potentially triggering sharp price fluctuations and whipsaws.
M15 Chart:
XAUUSD:Go long
The uncertainties in multiple dimensions such as geopolitics, US monetary policy and tariffs have significantly increased, which will bring more volatility to the gold price.
Today's market trend is still mainly volatile. During the Asian session, there has been a deep pullback. 3316 is the short-term support. It is expected that there will be a rebound in the future.
Trading strategy:
BUY@3325-30
TP:3345-50
More detailed strategies and trading will be notified here ↗↗↗
Keep updated, come to "get" ↗↗↗

Gold Short Term OutlookYesterday’s chart idea is playing out as analysed.
Gold failed to break above the $3,395 resistance and has now pulled back, currently testing the first support zone — aligned with the 4H 200MA and Daily 50MA.
If this area fails to hold, price is likely to head toward the next key support zone, where we expect a potential reaction.
To resume bullish momentum, we need to see a strong close above $3,346. Key bullish zones remain $3,375 and $3,395.
📌 Key Levels to Watch:
Resistance:
$3,375 • $3,395 • $3,418 • $3,439
Support:
$3,361 • $3,346 • $3,330 / $3,306
$3,287 – Critical demand zone
🧠 Fundamental Focus:
All eyes are on Fed Chair Powell’s testimony today, which may offer clues about the Fed’s rate outlook and inflation stance. Any hint of continued hawkishness could weigh on gold, while dovish commentary may trigger renewed upside interest.
Expect heightened intraday volatility around his remarks — stay cautious.

XAU/USD 26 June 2025 Intraday AnalysisH4 Analysis:
-> Swing: Bullish.
-> Internal: Bullish.
Analysis and bias remains the same as analysis dated 23 April 2025
Price has now printed a bearish CHoCH according to my analysis yesterday.
Price is now trading within an established internal range.
Intraday Expectation:
Price to trade down to either discount of internal 50% EQ, or H4 demand zone before targeting weak internal high priced at 3,500.200.
Note:
The Federal Reserve’s sustained dovish stance, coupled with ongoing geopolitical uncertainties, is likely to prolong heightened volatility in the gold market. Given this elevated risk environment, traders should exercise caution and recalibrate risk management strategies to navigate potential price fluctuations effectively.
Additionally, gold pricing remains sensitive to broader macroeconomic developments, including policy decisions under President Trump. Shifts in geopolitical strategy and economic directives could further amplify uncertainty, contributing to market repricing dynamics.
H4 Chart:
M15 Analysis:
-> Swing: Bullish.
-> Internal: Bullish.
Following previous high, and printing of bearish CHoCH, price has pulled back to an M15 supply zone, where we are currently seeing a reaction. Therefore, I shall now confirm internal high.
Price is now trading within an established internal range.
The remainder of my analysis shall remain the same as analysis dated 13 June 2025, apart from target price.
As per my analysis dated 22 May 2025 whereby I mentioned price can be seen to be reacting at discount of 50% EQ on H4 timeframe, therefore, it is a viable alternative that price could potentially print a bullish iBOS on M15 timeframe despite internal structure being bearish.
Price has printed a bullish iBOS followed by a bearish CHoCH, which indicates, but does not confirm, bearish pullback phase initiation. I will however continue to monitor, with respect to depth of pullback.
Intraday Expectation:
Price to continue bearish, react at either M15 supply zone, or discount of 50% internal EQ before targeting weak internal high priced at 3,451.375.
Note:
Gold remains highly volatile amid the Federal Reserve's continued dovish stance, persistent and escalating geopolitical uncertainties. Traders should implement robust risk management strategies and remain vigilant, as price swings may become more pronounced in this elevated volatility environment.
Additionally, President Trump’s recent tariff announcements are expected to further amplify market turbulence, potentially triggering sharp price fluctuations and whipsaws.
M15 Chart:

Gold (XAUUSD) – Pullback Setup Before Breakout? – JUNE 26, 2025🟡 GOLD PRICE OUTLOOK – June 26, 2025
Bias: Bullish | Looking for long entry on pullback
📊 Technical Overview :
OANDA:XAUUSD Gold continues to build a bullish market structure, forming consistent Higher Highs (HH) and Higher Lows (HL). Price is currently moving within a rising wedge, approaching a short-term resistance zone.
🔴 Sell Zone (Resistance) : 3359 – 3373
– Rising wedge top + upper trendline
– Fakeout trap possible near 3379.26
🟢 Buy Zone (Support) : 3294 – 3300
– Strong confluence zone
– Matches previous structure support + trendline
– Ideal for HL formation and long setup
🌍 Fundamentals & Macro Drivers :
💵 USD Weakness:
• DXY near 3.5-year low after Powell replacement rumors
• Boosting gold's upside momentum
☢ Geopolitical Risk:
• Iran–Israel ceasefire in place, but fragile
• Safe-haven demand still supportive
🏦 Central Bank Demand:
• 20% of global gold demand from central banks
• China 🇨🇳 & India 🇮🇳 are major buyers
📅 Upcoming Catalysts:
• US PCE Inflation & GDP due tomorrow
→ Weak data = Potential breakout above 3370+
📌 Trade Plan :
✔ Watch for rejection at 3359–3373
✔ Long setup if price retests 3294–3300
🎯 Target = 3370+
❌ Invalidation = Daily close below 3280
📈 Summary :
Gold remains structurally bullish, supported by weak USD, central bank demand, and macro risks.
Waiting for a healthy pullback into demand for long continuation setups.

#XAUUSD #GOLD 30Min 📉📈 #XAUUSD 30m Analysis – Dual Setup Scenario
We’re monitoring two potential trade setups depending on how price reacts at key levels:
🔴 Sell Setup:
Price is entering a Sell-Side Order Block Zone between 3350–3360, aligned with a Fair Value Gap (FVG). This premium zone is likely to act as strong resistance, with potential rejection targeting downside liquidity near 3310 — an ideal area for short positions.
🟢 Buy Setup:
If price sweeps below and taps into the Liquidity Zone / Demand Area around 3305–3311, we’ll watch for a bullish reversal from this discount zone. This area offers a favorable setup for long entries, aligning with institutional buying levels.
📌 Be sure to mark these key zones on your chart for enhanced clarity and execution.
💬 What’s your outlook on Gold? Share your thoughts below 👇

Gold Price Rebounds from Support Zone – Potential Breakout Above🟡 Gold (XAU/USD) | Rejection from Support with Potential Bullish Continuation
Published: June 26, 2025
Timeframe: 30-Minute | Broker: OANDA
---
🎯 Summary
Gold appears to be staging a potential bullish reversal after a strong reaction off a key support zone around $3,300, with a rising channel formation and higher lows hinting at a break above short-term resistance. This could set up a test of the $3,360–$3,370 level in the near term.
---
📊 Technical Breakdown
🔹 Support Rejection & Structure
Price action found strong demand at the $3,300–$3,310 zone (highlighted by the orange circles and green arrows).
Multiple rejections from this zone indicate the presence of institutional buying or defended liquidity.
The current price action respects a rising channel, forming consecutive higher lows, a bullish market structure in the short term.
🔹 Resistance & Breakout Potential
Price is approaching a key horizontal resistance at $3,355–$3,360.
A clean break and hold above this level could trigger a continuation toward the next liquidity zone near $3,380+, aligning with prior consolidation (green box region).
🔹 Ichimoku Cloud Analysis
The price is testing the Kumo cloud from below.
A bullish crossover and breakout above the cloud would further confirm bullish momentum.
Leading Span A is flattening, suggesting a potential equilibrium shift in favor of buyers.
---
🧠 Strategic Insight
What sets this chart apart is the clear confluence of signals:
Structural support,
Bullish channel formation,
Repeated higher lows,
A squeeze against resistance.
This paints a scenario where smart money may be accumulating before a breakout. The anticipated move is not merely reactive — it's rooted in fractal price behavior, cloud dynamics, and accumulation logic.
---
📌 Trade Scenario (Not Financial Advice)
Bullish Case:
A breakout above $3,360, ideally with volume confirmation, opens the door for a move to $3,380–$3,390. Watch for retests of the breakout zone for potential entries.
Bearish Invalidator:
A close below $3,320 would invalidate the ascending channel and shift short-term sentiment back to neutral or bearish.
---
💡 Original Perspective
While many traders focus on the breakout itself, this idea emphasizes the accumulation phase and higher-lows within a compression zone — a subtle yet powerful clue of institutional activity. This nuanced approach provides a layer of depth often overlooked in short-timeframe charts.
---
📣 Community Prompt
🔍 What’s your view on Gold's behavior at this resistance? Are you seeing similar higher-timeframe confluence? Drop your thoughts or alternate views in the comments!

It’s the right time to short goldThe daily gold line presents a three-top gathering pattern. The historical trend shows that the 3290-3280 area has triggered technical pullbacks many times, all of which rebounded to around 3350. The current 4-hour chart trend line suppression level coincides with the Fibonacci 0.618 pullback resistance from the previous high of 3450 to 3300 in the 3350-3360 range. This area constitutes the core pressure zone. If the price fails to effectively break through and stand above 3360 when it probes this area again, it is highly likely to replicate the previous two resistance and fall patterns. At that time, short orders will be arranged based on the 3350 first-line resistance area, with the goal of breaking the key support of 3300 and further looking down at the 3280 and 3260 levels. The overall bearish tendency is maintained, and the resistance to rebound is a signal to enter the market and sell short.
Gold recommendation: Gold is short around 3345-3352, target 3330-3320

XAUUSD: Breakout or Bull Trap?Gold (XAUUSD) on the daily timeframe is showing signs of a temporary rebound after a sharp drop from the resistance zone at 3,452 USD. Specifically, the price has bounced back from the support area around 3,291 – 3,298 USD – a region aligned with dynamic EMA support and the 0.382 Fibonacci retracement of the previous bullish leg.
1. Key Technical Structure:
A clear reversal candlestick pattern has formed at a strong support zone, paving the way for a short-term technical rebound.
The 0.5 Fibonacci level at 3,346.5 is currently acting as the nearest resistance – aligning closely with today’s closing price.
EMA 20 and EMA 50 are beginning to converge, indicating market indecision on the next directional move.
2. Short-Term Price Scenarios:
Bullish Scenario: If price holds above the 3,291 – 3,298 support zone and breaks above 3,348, it could retest the 3,400 – 3,452 highs in the coming days. In this case, strengthening EMAs and bullish candle momentum would support this setup.
Bearish Scenario: Conversely, if the price fails to break through the 3,348 – 3,352 resistance zone and falls below 3,291 again, the market may head toward deeper support levels at 3,240 – or even as low as 3,167 USD.
3. Trading Recommendations:
Short-term Buy if there is a confirmed bullish candle closing above 3,348 with strong volume; stop loss below 3,291.
Sell on rally around 3,348 – 3,352 resistance if no clear breakout is confirmed.
Apply strict risk management, especially in a choppy market environment ahead of key macroeconomic data at the end of the month.
Conclusion:
XAUUSD is currently in a “trend re-evaluation zone.” Closely monitoring the 3,291 – 3,348 range will be the key to timing efficient entries in the short term.

XAUUSD and GBPJPY Analysis todayHello traders, this is a complete multiple timeframe analysis of this pair. We see could find significant trading opportunities as per analysis upon price action confirmation we may take this trade. Smash the like button if you find value in this analysis and drop a comment if you have any questions or let me know which pair to cover in my next analysis.

GOLD drops sharply to 3300 and found important support areaThe recent bearish momentum on GOLD has met a good support zone and at present we started to see early signs of bullish interest returning, right after we got a beautiful rejection from the zone.
Currently I’m expecting for the price to bounce to the target near 3,390 . If this bullish push continues with strong volume and momentum, I’ll be locking in that bias and planning my entry accordingly. I could get involved right here for a more aggressive entry. It’s a bit riskier, but if the structure confirms, I’m more than happy to take the shot, as sometimes the best trades come when you trust your setup.
This is not financial advice.

"Gold Vault Breach! XAU/USD Heist Plan in Motion"🏴☠️💰 XAU/USD Gold Heist Blueprint 💰🏴☠️
“The Vault’s Open… Time to Load Up!”
🌟Hi! Hola! Ola! Bonjour! Hallo! Marhaba!🌟
Dear Money Makers & Market Robbers 🤑💰💸✈️
Get ready to execute the Golden Robbery with style and precision! Based on our 🔥Thief Trading Style🔥 using both technical & fundamental weapons, we’ve decoded the latest gold vault password: XAU/USD (Gold vs USD) is showing bullish bias!
🎯 Heist Instructions:
📈 Entry Point –
“The vault is wide open!”
Enter long anytime — but for the sharp shooters, place buy limits on the most recent 15/30min swing lows or pullback zones for a stealthier entry. Let the retracement pull the guards away 😏🔐
🛑 Stop Loss –
🔒 Set your Thief SL just below recent swing lows on the 4H timeframe (around 3310.0).
🔧 Adjust based on risk tolerance, lot size, and number of open trades — every heist has its escape plan!
🏁 Target Zone –
🎯 Aim for 3395.0 — or vanish before the cops show up!
Trail the stop as you go and don’t get greedy — wealth is preserved when exits are clean! 🏃♂️💨
🧲 Scalper's Advisory:
Only steal on the Long Side! Bulls are funding this operation.
💼 Big pockets? Dive in.
💳 Small stack? Swing with the pros & follow the plan.
🎯 Use Trailing SL to keep the loot safe.
📊 Market Insight – Why We Rob Gold Now?
XAU/USD shows bullish momentum 🐂 backed by:
Macro & Fundamental Data 🧠
Geopolitical & Intermarket Trends 🌍
COT Reports & Sentimental Outlook 💼
Dollar Weakness + Safe Haven Flow 💸
📚 Always cross-check the news wires & reports to validate the path! Fundamentals are the lockpick tools behind every breakout! 🔓📈
⚠️ Stealth Warnings:
📆 News Events = Increased Surveillance!
🚫 No new entries during high-volatility news drops.
🛡 Use Trailing SL on live trades to secure the bag.
💖 Wanna Support Our Heist Style?
Smash that 🚀 BOOST BUTTON 🚀
It fuels our Thief Army and helps you & your crew loot the market with confidence and flair!
Every day’s a new caper — follow the plan, manage your risk, and stay outta jail! 🏆💪🤝🎉
🔐 See you in the next Robbery Blueprint — Stay Locked & Loaded!
🐱👤💼📈💣💸

XAUUSD – Structured Buy Setup with Multiple Profit TargetsGreetings, traders.
Today’s first opportunity is setting up on XAUUSD, where price action has entered a high-probability buy zone.
This long setup includes three take-profit targets, offering both short-term and extended risk-reward potential. I will personally exit at 3366.66, while more aggressive traders may aim for higher levels.
🔔 Key Economic Events Today:
Two high-impact data points are expected:
Gross Domestic Product (QoQ, Q1)
Initial Jobless Claims
Volatility is expected. Size your risk accordingly.
🧠 Trade Parameters:
• Timeframe: M30
• Direction: Long
• Entry: 3336.62
• Take Profits: 3366.67 / 3382.51 / 3392.30
• Stop Loss: 3324.97
• Risk/Reward: 1:2.5
🔗 Signal Source
All trading signals are delivered directly from our official desk via TradingView:
👉 www.tradingview.com
Velatrix Capital is not a retail page.
We are a data-driven, execution-focused trading firm operating with an institutional-grade framework.
All strategies are designed, validated, and deployed under strict internal criteria by our leadership team, with decades of experience in algorithmic trading and macro-level analysis.
🔔 Subscribe now. This is Velatrix Capital.

XAUUSD:Short sell at 3340-45
Today's trading needs to narrow down the range. There are signs that the center of gravity below is gradually moving upward. During the Asian session, the highest point reached around 3343. Friends who have already bought short positions here can wait for 3320-25 to take profits and exit. Those who haven't bought can wait for 3340-45 to short, with the target also being 3320-25
Trading strategy:
SELL@3340-45
TP:3320-25
It can be considered to go long when it reaches around 3320-25
More detailed strategies and trading will be notified here ↗↗↗
Keep updated, come to "get" ↗↗↗

XAUUSD Hello traders.
Today’s first trade setup comes from the XAUUSD pair. The pair is currently positioned in an ideal buy zone, and I’ve spotted a potential long opportunity. There are three different take profit levels, all of which are listed below. Personally, I’ll be closing my position at the first TP level: 3366.66.
However, keep in mind that two major economic events will be released today:
📌 Gross Domestic Product (GDP) (QoQ) – Q1
📌 Initial Jobless Claims
These are highly impactful events, so please manage your risk accordingly.
🔍 Trade Details
✔️ Timeframe: 30-Minute
✔️ Risk-to-Reward Ratio: 1:2.5
✔️ Trade Direction: Buy
✔️ Entry Price: 3336.62
✔️ Take Profit: 3366.67 / 3382.51 / 3392.36
✔️ Stop Loss: 3324.97
🕒 If momentum fades or the price consolidates within a tight range, I’ll keep this trade open only until 23:00 (UTC+4). After that, I’ll close it manually—whether in profit or loss—depending on how the price action evolves.
🔔 Disclaimer: This is not financial advice. I’m simply sharing a trade I’ve taken based on my personal trading system, strictly for educational and illustrative purposes.
📌 Interested in a systematic, data-driven trading approach?
💡 Follow the page and turn on notifications to stay updated on future trade setups and advanced market insights.
Escalating U.S. Debt Crisis Coupled with Weaker U.S. DollarPowell Unleashes Rare Dovish Signal, Gold Rebounds to $3,330
In yesterday's speech, Powell remarkably signaled policy easing, explicitly stating the Fed "will take appropriate actions to sustain economic expansion," driving gold's short-term rebound to the $3,330 threshold. Technically, gold is now locked in a strong consolidation range of $3,300–$3,350, with the Bollinger Bands midline at $3,325 emerging as the focal point of long-short battles.
The U.S. Dollar Index hit a new low today, while the U.S. debt crisis is set to raise the borrowing ceiling again—both tailwinds for gold's upward momentum.
Trading Strategy Recommendations:
- Short at Resistance: Enter light short positions between $3,345–$3,350, set stop-loss at $3,360, and target a pullback to $3,320.
- Long at Support: Initiate staggered long positions in the $3,310–$3,300 support zone, set stop-loss at $3,290, and target a rally to $3,340–$3,345.
- Volatility Trading: Exploit range-bound movements around the $3,330 midline, aiming for 8–12 dollar profits per trade.
Market Note: With the dollar weakening and debt ceiling tensions resurfacing, gold's safe-haven appeal is reinforced. Maintain position sizes below 5% and strictly enforce $15 stop-loss orders to navigate news-driven volatility.
I am committed to sharing trading signals every day. Among them, real-time signals will be flexibly pushed according to market dynamics. All the signals sent out last week accurately matched the market trends, helping numerous traders achieve substantial profits. Regardless of your previous investment performance, I believe that with the support of my professional strategies and timely signals, I will surely be able to assist you in breaking through investment bottlenecks and achieving new breakthroughs in the trading field.
