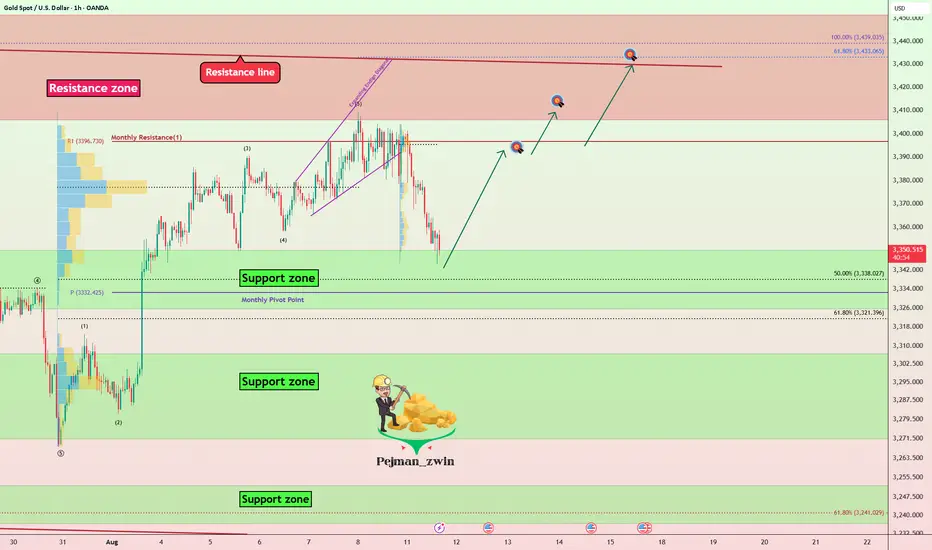
Gold Correction Ending — Time for the Next Rally?Gold ( OANDA:XAUUSD ) is currently moving near the Support zone($3,350-$3,326) and the Monthly Pivot Point .
In terms of Elliott Wave theory , it seems that Gold is completing a corrective wave, and we should wait for the next impulse wave .
I expect Gold to start rising from the Support zone($3,350-$3,326) and rise to at least $3,393 .
Second Target: $3,407
Third Target: $3,427
Note: Stop Loss (SL) = $3,317
Gold Analyze (XAUUSD), 1-hour time frame.
Be sure to follow the updated ideas.
Do not forget to put a Stop loss for your positions (For every position you want to open).
Please follow your strategy; this is just my idea, and I will gladly see your ideas in this post.
Please do not forget the ✅ ' like ' ✅ button 🙏😊 & Share it with your friends; thanks, and Trade safe.
Xauusdanalysis
8/12: Key Support at 3343–3337, Resistance at 3366–3372Good morning, everyone!
Yesterday, the market saw a one-sided drop, with selling pressure on the 4H chart largely released. However, the daily bullish structure has been damaged. Given the size of yesterday’s decline, there’s a decent chance of an intraday rebound today.
Key support levels to watch are 3343–3337 and 3328–3323, while resistance sits at 3352–3358 and 3366–3372–3378. Trading should focus on these zones.
With today’s news-driven volatility likely to exceed yesterday’s, if the downtrend continues, I see 3312–3298 as an attractive buying opportunity. My overall bias for the day remains buying on dips, with potential short opportunities near resistance.

Market Analysis: Gold Pulls BackMarket Analysis: Gold Pulls Back
Gold price started a fresh decline below $3,380.
Important Takeaways for Gold Price Analysis Today
- Gold price climbed higher toward the $3,410 zone before there was a sharp decline against the US Dollar.
- A key bearish trend line is forming with resistance near $3,355 on the hourly chart of gold.
Gold Price Technical Analysis
On the hourly chart of Gold at FXOpen, the price climbed above the $3,380 resistance. The price even spiked above $3,400 before the bears appeared.
A high was formed near $3,409 before there was a fresh decline. There was a move below the $3,380 pivot level. The bears even pushed the price below the $3,350 support and the 50-hour simple moving average.
It tested the $3,330 zone. A low has formed near $3,331 and the price is now consolidating losses near the 23.6% Fib retracement level of the downward move from the $3,409 swing high to the $3,331 low.
Immediate resistance on the upside is near a bearish trend line at $3,355 and the 50-hour simple moving average. The next major hurdle is near the 50% Fib retracement level.
The main barrier for the bulls could be near the $3,380 level, above which the price could test the $3,400 zone. Any more gains might call for a move toward $3,410. An upside break above $3,410 could send Gold price toward $3,425.
Initial support on the downside is near $3,330. The next key level is $3,320. If there is a downside break below $3,320, the price might decline further. In the stated case, the price might drop toward the $3,300 zone.
This article represents the opinion of the Companies operating under the FXOpen brand only. It is not to be construed as an offer, solicitation, or recommendation with respect to products and services provided by the Companies operating under the FXOpen brand, nor is it to be considered financial advice.

GOLD Potential Bullish Breakout OpportunityGold seems to exhibit signs of a potential Bullish Breakout on the Shorter timeframes as the price action may form a credible Higher High with multiple confluences through key Fibonacci and Support levels which presents us with a potential long opportunity.
Trade Plan:
Entry : CMP
Stop Loss : 3327
TP 0.9 - 1: 3398 - 3402

XAU/USD,1h Chart PatternBased on my chart, the two marked resistance zones (target points) for XAU/USD are:
First target: around 3,375 – 3,380 (short-term resistance inside the Ichimoku cloud area).
Second target: around 3,395 – 3,405 (previous swing high and top of the channel).
Since price is trending upward along the ascending trendline and just broke into the Ichimoku cloud, the first target is more conservative, while the second is for a stronger bullish push if momentum continues.

XAUUSD Delivered Excellent profits As I mentioned in yesterday’s commentary session:
My strategy is buy from from Dips 3330-3340
Very happy with the profits so far, multiple trades at 3331–3340
📌 XAUUSD YESTERDAY TRADES💥
-----------12 - AUG -2025 ----------------
GOLD BUY 3340 40 PIPS BE HIT✳️
GOLD BUY 3344 130 PIPS TP HIT✳️
GOLD BUY 3340 50 PIPS SL HIT ❌️
GOLD BUY 3331 270 PIPS TP HIT✳️
--------------------------------------------------------------
NET PIPS : 390 PIPS
Always follow your setup & your path with patience and discipline.
My targets is achieved alhumdulillah.
All I say thanks to those who followed us and made profits.

Gold Spot / U.S. Dollar (XAU/USD) 4-Hour Chart - OANDA4-hour chart from OANDA displays the price movement of Gold Spot (XAU/USD) from late July to mid-September 2025. The current price is $3,335.985, reflecting a decrease of $6.670 (-0.20%). Key levels include a sell price of $3,335.720 and a buy price of $3,336.270. The chart highlights recent price fluctuations, with a notable drop and a shaded support/resistance zone between approximately $3,340.000 and $3,360.000

BULLISH ON GOLDPrice traded into Daily FVG. BOS happened on 1H FVG and returned to FVG where I picked entry.

Gold price analysis August 13The trading strategy from yesterday is working as the price reacted accurately at the Fibonacci level of 0.382. In today's session, the 3358 area plays a key role - this is the ideal area to consider DCA when a BUY confirmation signal appears.
On the contrary, 3333 will be the last defensive zone for the uptrend. If this level is broken, the market is likely to reverse to the downtrend, opening up a SELL opportunity towards the 328x area.
Regarding the wave structure, the assessment is still consistent with the analysis of the previous session.
Trading plan:
BUY DCA: When the candle closes confirming above 3358
SELL: When the price breaks 3333 (Fib level of 0.382)

XAUUSD 4H Analysis – Bullish Reversal OpportunityGold is currently trading around $3,336, retesting a key demand zone near $3,334 – $3,340 (green box). This zone has acted as strong support in the past, aligning with a major horizontal level and previous breakout retests.
🔍 Key Levels:
Support Zone: $3,334 – $3,340 (green box)
Resistance 1: $3,361
Resistance 2: $3,394
Major Demand Zone Below: $3,223
📊 Technical Outlook:
Price has pulled back into a strong demand area after failing to break above the $3,394 resistance. If bulls defend this green zone, we could see a bounce toward $3,361 and potentially $3,394. A clean break above $3,394 could open the door for a retest of the $3,420+ zone.
However, if this demand zone breaks, sellers could push price lower toward $3,223.
💡 Trading Plan:
Buy Entry: Around $3,334 – $3,340 (on bullish confirmation)
Stop Loss: Below $3,323
Take Profit 1: $3,361
Take Profit 2: $3,394
⚠ Disclaimer: This is not financial advice. Always conduct your own analysis and manage risk properly before trading.
#XAUUSD #Gold #Forex #Trading #PriceAction #TechnicalAnalysis #SwingTrade #SmartMoneyConcepts #SupportAndResistance #CommodityTrading

XAU/USD 13 August 2025 Intraday AnalysisH4 Analysis:
-> Swing: Bullish.
-> Internal: Bullish.
You will note that price has targeted weak internal high on three separate occasions which has now formed a triple top, this is a bearish reversal pattern and proving this zone is a strong supply level. This is in-line with HTF bearish pullback phase.
Remainder of analysis and bias remains the same as analysis dated 23 April 2025.
Price has now printed a bearish CHoCH according to my analysis yesterday.
Price is now trading within an established internal range.
Intraday Expectation:
Price to trade down to either discount of internal 50% EQ, or H4 demand zone before targeting weak internal high priced at 3,500.200.
Note:
The Federal Reserve’s sustained dovish stance, coupled with ongoing geopolitical uncertainties, is likely to prolong heightened volatility in the gold market. Given this elevated risk environment, traders should exercise caution and recalibrate risk management strategies to navigate potential price fluctuations effectively.
Additionally, gold pricing remains sensitive to broader macroeconomic developments, including policy decisions under President Trump. Shifts in geopolitical strategy and economic directives could further amplify uncertainty, contributing to market repricing dynamics.
H4 Chart:
M15 Analysis:
-> Swing: Bullish.
-> Internal: Bullish.
H4 Timeframe - Price has failed to target weak internal high, therefore, it would not be unrealistic if price printed a bearish iBOS.
The remainder of my analysis shall remain the same as analysis dated 13 June 2025, apart from target price.
As per my analysis dated 22 May 2025 whereby I mentioned price can be seen to be reacting at discount of 50% EQ on H4 timeframe, therefore, it is a viable alternative that price could potentially print a bullish iBOS on M15 timeframe despite internal structure being bearish.
Price has printed a bullish iBOS followed by a bearish CHoCH, which indicates, but does not confirm, bearish pullback phase initiation. I will however continue to monitor, with respect to depth of pullback.
Intraday Expectation:
Price to continue bearish, react at either M15 supply zone, or discount of 50% internal EQ before targeting weak internal high priced at 3,451.375.
Note:
Gold remains highly volatile amid the Federal Reserve's continued dovish stance, persistent and escalating geopolitical uncertainties. Traders should implement robust risk management strategies and remain vigilant, as price swings may become more pronounced in this elevated volatility environment.
Additionally, President Trump’s recent tariff announcements are expected to further amplify market turbulence, potentially triggering sharp price fluctuations and whipsaws.
M15 Chart:

XAU/USD Intraday Plan | Support & Resistance to WatchGold has broken above the 50MA (pink) but remains capped below the 200MA (green), trading just above the $3,353 key level. This area is acting as a pivotal barrier — a clean break and sustained hold above $3,353 is needed to shift momentum bullish.
A sustained break and hold above this zone could see momentum build toward $3,380, with further upside potential to $3,399 and $3,422. Failure to clear this area may keep price trapped in the pullback structure, risking another retest of $3,329 and possibly the Secondary Support Zone.
📌 Key Levels to Watch
Resistance:
‣ $3,380
‣ $3,399
‣ $3,422
Support:
‣ $3,353
‣ $3,329
‣ $3,313
‣ $3,295
🔎 Fundamental Focus
Multiple FOMC speeches and President Trump remarks today could spark volatility.
Expect choppy price action — manage risk around headlines.

Gold Technical Analysis August 13, 2025Gold prices fell sharply as US President Donald Trump clarified his tax policy on precious metals.
The gold market is still waiting for an official announcement from the White House on the possibility of applying it to imported gold bars of 100 ounces and 1kg. However, on social media, US President Donald Trump said that this precious metal will not be subject to import tax.
Despite strong selling pressure on world gold prices, a market strategy still predicts a price of $4,000/ounce by the end of the year.
Mike McGlone - Senior Commodity Strategist at Bloomberg Intelligence said that looking at the bigger picture, gold is still supported at an important level above $3,300/ounce and the technical forum could signal an upcoming breakthrough.
“ETFs have turned to strong inflows after four years of net outflows. A slight correction in US stocks could be the catalyst to push gold closer to $4,000 an ounce”


GOLD Intraday H1 Chart For 13 August 25Hello Traders,
as you can see that GOLD is still in tight range all eyes for now 3365 resistance level break out for further upward move
below 3330 level GOLD remains bearish and will move towards 3308 level
Disclaimer: Forex is Risky

GOLD - short below , single support.#GOLD... stay in range even during CPI
so now we have single supporting area 3343-45
Keep close and only short below that otherwise not.
Good luck
Trade wisely

GOLD H4 PRICE UPDATE #XAUUSD#XAUUSD #GOLD #XAU
Gold Consolidating Between 3360 / 3340
First #GOLD Want To Take Breakout From Buyside Or Sell Side
If Gold Take The Buyside liquidity Then We Considering Sell Trades
Target the blue box (Engulfing Bullish Box) + (Order Block Box)
#GOLD JUST FLY FROM OUR BUY CISD ENTRY
#GOLD SMT Then Fly
Gold Buying From 3,300 Or 3,280
Targeting Price 3400 With Breakeven
Gold Selling From 3,440 / 3,460
Targeting Price 3,300 / 3,280

GOLD DUMPS $50 – LIQUIDITY ZONE AHEAD | CPI IN FOCUS! GOLD DUMPS $50 – LIQUIDITY ZONE AHEAD | CPI IN FOCUS!
📌 MARKET RECAP
Gold kicked off the week with a sharp $50 drop, breaking multiple key trendlines and nearby support levels in quick succession.
Main drivers behind the move:
Profit-taking after the recent strong rally.
Stronger USD expectations ahead of CPI data (forecast +0.1% vs previous).
Geopolitical factors – Ukraine–Russia ceasefire talks approaching their conclusion, adding to risk-off sentiment.
🧐 WHAT’S NEXT?
If CPI comes in strong → USD strengthens → Gold could slide further into the 333x – 330x liquidity zone.
If CPI disappoints → USD weakens → Gold may quickly bounce back toward the 337x key level (previous breakdown area) for a retest before deciding direction.
🎯 MMFLOW GAME PLAN
1️⃣ BUY SCALP
📌 Entry: 3331 – 3329
📌 SL: 3325
📌 TP: 3335 – 3340 – 3345 – 3350 – 3360 – 3370 – 3380
2️⃣ BUY ZONE
📌 Entry: 3310 – 3308
📌 SL: 3304
📌 TP: 3314 – 3318 – 3322 – 3326 – 3330 – 3335 – 3340 – 3350 – 3360 – ???
3️⃣ SELL SCALP
📌 Entry: 3363 – 3365
📌 SL: 3370
📌 TP: 3360 – 3356 – 3352 – 3348 – 3344 – 3340
4️⃣ SELL ZONE
📌 Entry: 3376 – 3378
📌 SL: 3382
📌 TP: 3372 – 3368 – 3364 – 3360 – 3355 – 3350 – 3340
⚠️ RISK NOTE
CPI is a potential game-changer – even a small deviation from forecasts can trigger a massive one-way move.
Always keep an eye on AD-marked Key Levels on the chart before pulling the trigger.

Wait patiently, 3350 is the key, if it falls below, look at 3330Gold experienced frequent fluctuations last Friday night. After opening today at around 3,400, it quickly fell back. Gold has already fallen below last Friday's low. 🐻
It is expected to retrace to test the support level of 3357-3350 today📈. If the support level is not broken, the bulls may rebound at any time.🐂
If it unexpectedly falls below, it may accelerate its decline to around 3330📉, where there is also support, and you can go long in the short term when it approaches📊.
On the whole, the main strategy during the day is to go long based on support and callback. If it touches 3357-3350 for the first time, you can consider going long with a light position.✅
Three techniques to accurately capture the gold marketAt present, gold as a whole still maintains a range-bound pattern. Although the CPI data is bullish, the overall trend structure of rising and falling has not changed. It is still under pressure from the high point of the range, and supported by the low point of the range. In the case that there is no breakthrough unilateral market in the current volatility, the operation is still based on the range thinking. From the hourly line structure, the high point has not been refreshed and the low point has been lost. The short-term bearish operation characteristics are obvious. The bearish reference suppression area is around 3357-3370. The support below focuses on the 3335-3320 area. If it is lost, the strategy will be adjusted.
Gold operation suggestion: short sell under pressure near 3357-3370, target 3345-3335. If the 3335-3320 area stabilizes and is not broken, a short-term long layout can be considered.

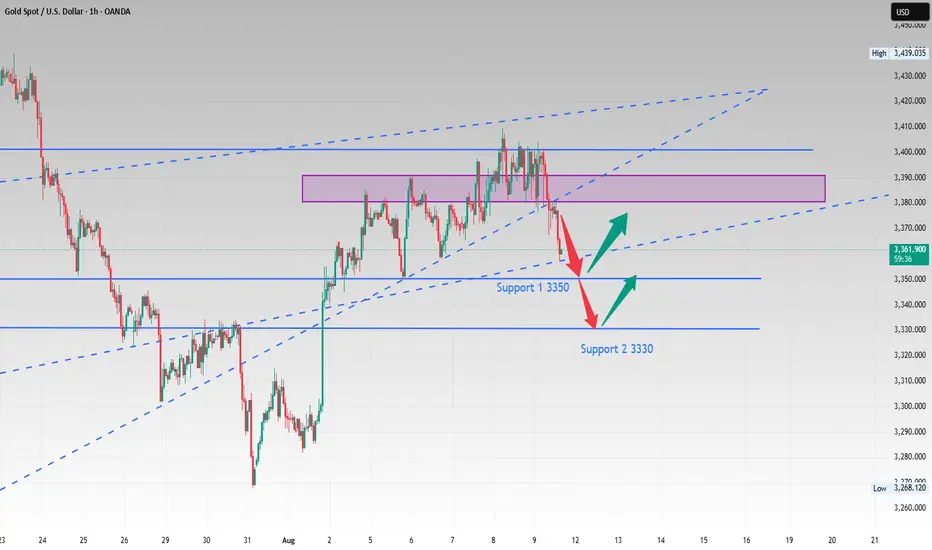
xauusd (GOLD): a signal Hi guys!
Key Technical Points:
Ascending Channel:
Price action has been moving within a well-defined ascending channel.
Currently, the price has pulled back and is approaching the lower boundary of this channel.
This lower boundary often acts as a support area where buyers might step in.
Support Zone (Red Box):
The red highlighted area, around $ 3,340-$ 3,350 USD, is a key support zone.
This zone aligns w ith the lower boundary of the channel , adding more weight to the support.
Price is currently testing this area, which could act as a springboard for the next upward move.
Resistance Zone (Blue Box):
The upper resistance zone between roughly 3,425 and 3,440 USD is a major target for bulls.
This is a previous high area where sellers might re-enter the market.
-------------------------------------------------------
Trade Idea:
Long Position:
Entry could be considered near the lower boundary of the channel and the red support zone (around 3,340-3,350 USD).
Stop loss placement: Just below the red support zone to limit downside risk.
Target: The upper resistance zone at around 3,425-3,440 USD.

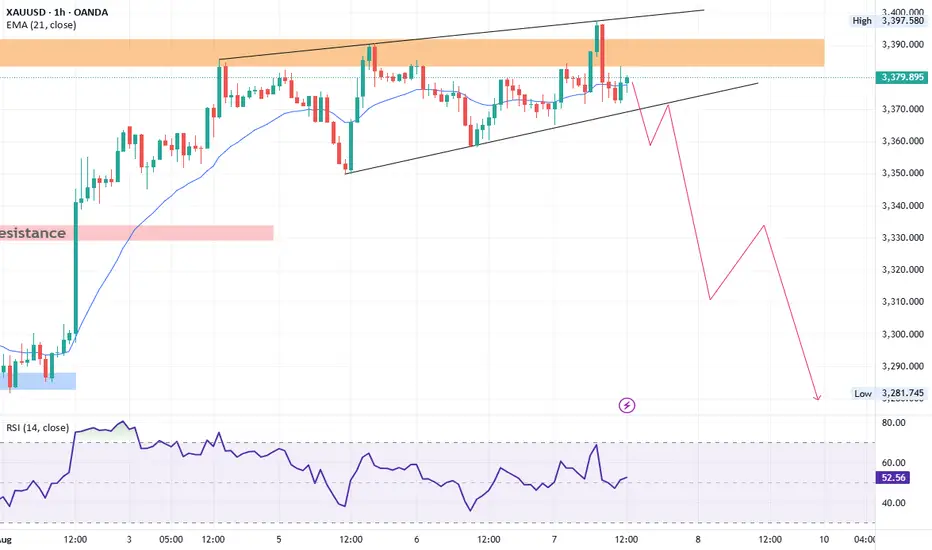
XAUUSD Technical AnalysisGold is currently trading within a rising wedge pattern on the 1-hour chart. The price recently touched the upper trendline of the wedge and faced a strong rejection, indicating bearish pressure. If the price breaks below the lower boundary of the wedge, it will likely trigger a sharp bearish move.
Key downside targets after a confirmed breakdown are:
3340
3300
3270
If Gold drops below 3270, the next significant support lies at 3250 on the daily chart. A daily close below 3250 will confirm a shift in the medium-term trend, opening the path toward the 3000 psychological level.
OANDA:XAUUSD
Gold XAUUSD Analysis 12.08.2025 IntradayGold is currently moving sideways within the range of 3341/44 to 3356/59. Price is consolidating between these levels, creating a clear short-term support and resistance zone. Unless price breaks out and retests on either side of this range, no trades should be taken. Watch CPI data and other confirmations before entering in the breakout direction.
Trading Signal
Buy Scenario: Break and retest above 3356/60, targeting 3375–3380 zone.
Sell Scenario: Break and retest below 3341/44, targeting 3315–3320 zone.
