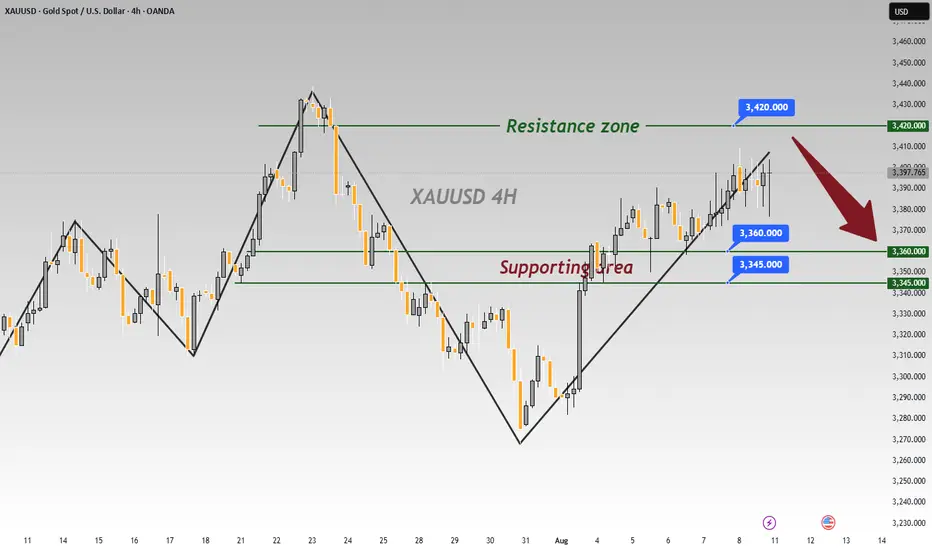
How to correctly grasp the gold trading opportunities?At present, the suppression of 3410 is still quite strong. After testing the resistance, a short-term long-short reversal was formed, and it retreated and broke the 3380 low support. It is expected to test the 3360 and 3345 moving average supports below today. After falling below the 3380 bullish starting point, the short-term trend will temporarily be mainly downward. Only when it is close to the low support can a new layout be made. Therefore, wait patiently for the low point to be retreated and stabilized before considering going long on gold.
Xauusdanalysis

GOLD Melted , Clear Chance To Buy It Now , 150 Pips Waiting !Here is My 15 Mins Gold Chart , and here is my opinion , the price go down very hard after touch 3400.00 and melted to 3353.00 and we finally above 3358.00 and we have a 30 Mins Candle closure above it And Perfect Breakout and perfect bullish price action , so we have a good confirmation now to can buy it and we can targeting 100 to 200 pips as a small correction after this huge movement to downside in a very short period , so i will buy it to see if we have a correction for 150 to 200 pips at least .
Reasons To Enter :
1- New Support Created .
2- Bullish Price Action .
3- Bigger T.F Giving Good Bullish P.A .
4- 30 Mins Confirmation
5- Little Correction .

XAUUSD – Technical Analysis H1 (August 11, 2025)1. Overall Trend
On the H1 timeframe, gold is in a clear downtrend after failing to hold the resistance zone at 3,379 – 3,385. The EMA9 has crossed below EMA20, confirming short-term bearish pressure. Strong selling volume in recent candles indicates sellers are currently in control.
2. Key Support & Resistance Levels
Near-term resistance: 3,367 – 3,368 (EMA9 + descending trendline)
Major resistance: 3,379 – 3,385 (previous supply zone + 0.382 Fibonacci retracement)
Near-term support: 3,357 – 3,353 (recent local low)
Target support: 3,333 – 3,332 (0.618 Fibonacci retracement + strong demand zone)
3. Price Action & Pattern
Price has formed a Break & Retest pattern on the descending trendline.
The downside target is set around 3,332, with a potential R:R ratio of ~3.23 for short positions.
High selling volume suggests price may continue testing deeper support levels before any significant rebound.
4. Intraday Trading Strategies
Sell setup: Look for short entries when price pulls back to 3,367 – 3,368, SL above 3,379, TP at 3,333.
Buy setup (scalping): Consider buys only if price tests 3,332 and shows clear bullish reversal signals with declining sell volume.
Maintain strict risk management with R:R ≥ 1:2 and avoid FOMO during high volatility.
5. Conclusion
Gold remains biased to the downside in the short term, with 3,367 – 3,368 acting as the key decision zone for potential continuation shorts. Patience and confirmation signals are crucial for maximizing profit potential.
Follow for more high-quality daily gold trading strategies.

Gold Breaks Rising Wedge – Bearish Targets AheadGold recently broke down from a rising wedge pattern near the $3,385–$3,390 area, signaling potential bearish momentum. Price is currently trading around $3,360, staying below the broken wedge support and also below the main trendline. This breakdown aligns with a shift from short-term bullish to corrective/bearish movement. The trend has shifted bearish unless it reclaims $3,375–$3,388. Short-term bias favors more downside toward $3,350 and $3,342
Key Levels to Watch
- Immediate Resistance: $3,370 – $3,375 (wedge breakdown retest zone)
- Major Resistance: $3,388 – $3,395 (trendline and previous supply zone)
- Immediate Support: $3,350 – $3,352 (short-term Fib and horizontal support)
- Major Support: $3,335 – $3,340 (next demand area)
- Extended Downside Target: $3,322 (Fib 0.22 level)
Note
Please risk management in trading is a Key so use your money accordingly. If you like the idea then please like and boost. Thank you and Good Luck!

XAUUSD Gold Trading Strategy August 11, 2025
At the beginning of the new week's trading session, the gold price fell sharply from the 340x area to the current 335x area.
Basic news: The US Dollar Index (DXY) fell to around 98 last week, unable to stay above 100. Although the 10-year Treasury yield rose to 4.285%, the Dollar remained under pressure, reflecting market concerns about political risks in the United States.
Technical analysis: After the price met the 340x resistance area, it fell sharply. Currently, the H1 frame MA lines have turned into resistance, but the H4 frame is still support. The H1 frame RSI is showing signs of increasing again and moving towards the average line; the H4 frame RSI is adjusting towards the oversold area. We will wait at the resistance areas and liquidity areas to trade.
Important price zones today: 3375 - 3380, 3350 - 3355 and 3395 - 3400.
Today's trading trend: SELL.
Recommended orders:
Plan 1: SELL XAUUSD zone 3378 - 3380
SL 3383
TP 3375 - 3365 - 3355 - 3330.
Plan 2: SELL XAUUSD zone 3395 - 3397
SL 3400
TP 3392 - 3382 - 3362 - 3330.
Plan 3: BUY XAUUSD zone 3353 - 3355
SL 3350
TP 3358 - 3368 - 3378 - 3390 (small volume).
Wish you a safe, successful and profitable new trading week.🥰🥰🥰🥰🥰

XAUUSD falls on easing geopolitical tensionsXAUUSD falls on easing geopolitical tensions
Gold fell below 3,380.00 on August 11 as reduced geopolitical tensions weakened its safe-haven appeal, following President Trump’s announcement of an August 15 meeting with Putin in Alaska to discuss ending the Ukraine war, potentially avoiding new U.S. sanctions on Russia. Losses may be capped by ongoing trade concerns, expected Fed rate cuts, and uncertainty over U.S. tariffs on gold bars after a recent agency ruling.
Technically, XAUUSD failed to hold an intermediate 3,380.00 level and develop a bullish momentum towards 3,440.00, which means the start of the sideways market in the asset. Next possible target is 3,000.00 level.

Gold Price Poised for Bullish Rebound Toward 3385After breaking out of the descending channel, gold entered a consolidation phase before facing a corrective dip. Current price action suggests a potential reversal from support, with bullish momentum likely to target the 3385 level in the short term. Key support lies around 3,260, and sustained buying pressure above this zone could fuel the projected upward move.|
Previous Trend:
Price was in a strong downtrend, moving inside a descending channel until the end of July.
This was followed by a sharp bullish breakout with strong volume, indicating a momentum shift.
Current Structure:
After the breakout, gold formed a sideways consolidation (yellow box), suggesting accumulation before the next move.
Recently, price retraced from the upper resistance zone and is now testing the lower horizontal support.
Key Levels:
Support Zone: 3,250 – 3,260 (critical demand area; a bounce here is expected).
Resistance Zone: 3,380 – 3,385 (short-term target).
Breakout Confirmation: A strong bullish candle above 3,300 would strengthen the move toward the target.

Latest Gold Price Update TodayHello, let’s strategize and analyze OANDA:XAUUSD together!
Last week, the gold market went through a highly volatile phase when rumors surfaced that the US would impose a 39% tax on gold bars imported from Switzerland on Thursday afternoon. This news immediately triggered a strong buying surge, pushing the spot price of gold above the critical resistance level of 3,400 USD, although the White House later denied it.
Earlier in the week, gold opened at 3,360 USD and fluctuated multiple times between 3,345 and 3,396 USD/ounce as buying and selling forces battled. Interestingly, even after the tax rumor was debunked, the price of gold only dropped slightly before rebounding and maintaining around 3,400 USD until the end of the week.
According to my analysis, gold is currently correcting and moving around 3,370 USD. The 3,435 USD level (the recent peak) is crucial to watch closely. This level has been tested three times in May, June, and July without being broken, reflecting the consistent strength of the buyers.
Looking further ahead, the 3,500 USD level remains a significant resistance. "I hope the next test will come after a steady upward trend, rather than a quick breakout, as this could lead to a stagnation in the rally," I believe.
The overall market sentiment is also positive: the latest survey shows that about 60% of Wall Street experts predict gold prices will continue to rise, while only 10% foresee a decline, with the rest expecting sideways movement. On the retail side, around 69% of individual investors remain optimistic about gold’s short-term outlook.
What about you? How do you predict gold’s movement?

Gold’s Pullback: Fueling the Next Surge Toward 3390-3400Today is the first trading day of this week. Gold has continued to fall since the opening, and has reached a low of around 3364 so far. Through the short-term trend, we can see that gold has insufficient willingness to continue to rise above 3400 and still faces considerable resistance. It needs more support and momentum to drive it forward before it can continue to rise. Currently, gold continues to retreat to around 3364. Has the trend of gold turned into a bearish trend? I think it's too early to draw such a conclusion!
Although gold has fallen significantly, there is still strong buying support below. The 3360-3350 area has become a key support level. As long as gold does not fall below this area, the bullish structure has not been completely broken. Therefore, there is still sufficient energy for gold to continue its rebound. This decline in gold is intended to increase liquidity and accumulate more upward momentum, which will help gold stabilize at 3400 and move towards higher targets!
Therefore, for short-term trading, I think we can still continue to try to go long on gold, but after all, the decline in gold has been so large. For short-term trading, we can appropriately lower the rebound expectations to the 3380-3390 area.

XAUUSD Gold Intraday Analysis 11.08.2025Price has recently broken below the ascending trendline and is currently trading beneath a key supply zone between 3375–3380. After the trendline break, the market has shown a strong bearish impulse followed by consolidation, suggesting potential continuation to the downside.
If price retraces back into the 3375–3380 area and shows clear signs of rejection (such as bearish engulfing, rejection wicks, or lower time frame structure shift), I will be looking for short entries with a target towards the next demand zone around 3345.
Trade Setup:
Sell Limit: 3375–3380 (upon rejection confirmations)
Stop Loss: Above 3385
Take Profit: 3365/3355/3345
This setup provides a favorable risk-to-reward opportunity, aligning with the current bearish structure after the break of trendline support.
Always follow proper risk management and wait for confirmation before entering.

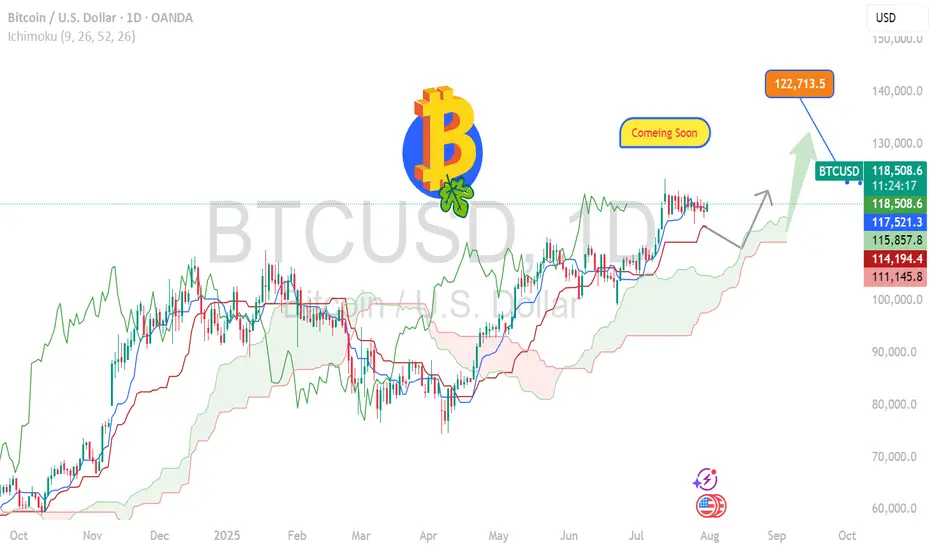
BITCOIN- Charging Towards 122k Momentum Building BTC/USD Long Setup – Targeting 122K 🔥
Bitcoin is holding strong above 118500, signaling bullish momentum.
✅ Price broke key resistance & forming higher lows.
🟢 Current structure favors buy-side continuation with next major target at 122000.
Support Zones:
🔹 117800 – intraday bullish retest
🔹 116500 – strong demand zone
Resistance Ahead:
🔸 120200 – short-term reaction
🔸 122000 – major target
🚀 Expecting bullish wave continuation.
If momentum sustains above 118K, 122K breakout highly probable!
#BTC #Bitcoin #CryptoSetup #BTCUSD #CryptoTrading #BTC122K #ChartAnalysis #BullishBreakout
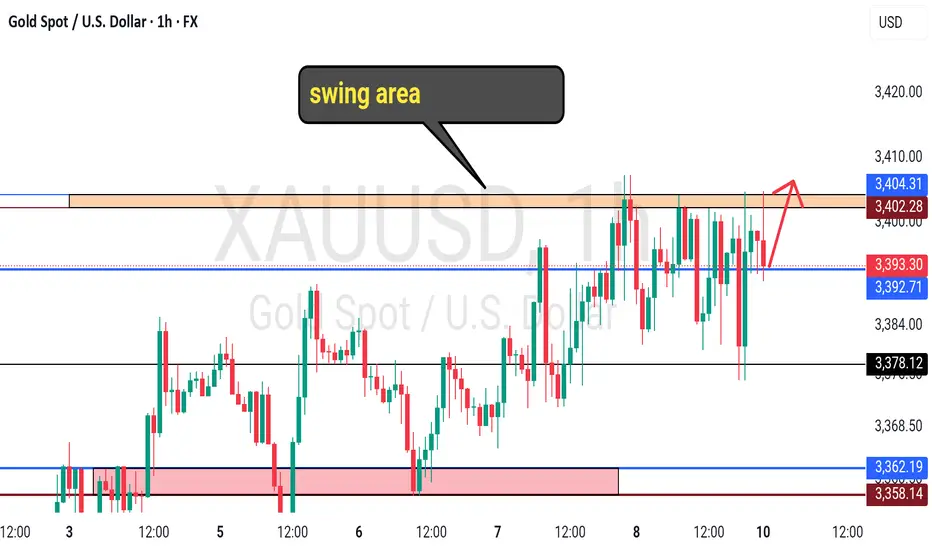
XAUUSD Rebound Setup Toward Key Resistance LevelsGold is testing its support trend line near 3,376, with potential for a rebound toward resistance at 3,401. A breakout above this level could open the path to the target zone around 3,425.

XAUUSD (Gold) price is ranging between 3248-3428 from April 2025XAUUSD (Gold) price is ranging between 3248-3428 from April 2025 to date, 11th August 2025.
Key level for selling 3380-3428 (before placing an order, must watch the daily candles and H4 for better understanding).
Gold overall has strong bullish momentum. In my view, gold is consolidating at the levels, but in the coming days, any new geopolitical event or any conflict in any country of the world will lead to more bullish momentum in gold.
As I mark it, buying gold is more safe and profitable in current situations, but keep in mind you must have the up-to-date geopolitical events and economic news.
If the price gets ranged and touches 3355, and you see any rejection candles after that and a strong confirmation candle, then you should place a buy trade with proper stop loss and take profit.

Gold Price Analysis August 11Last week, gold closed the last trading session in a sideways state in the accumulation zone. Entering the beginning of this week, the market is waiting for a new push to break the 3385–3405 zone, from which to trade in the winning direction.
If the lower edge breaks: A correction will be formed, then there is a high possibility of a new uptrend towards the historical peak (ATH).
If the upper edge breaks: The buyers can completely take advantage of the uptrend to bring the price closer to the ATH mark around 3445 in a short time.
📌 Key Levels
Support: 3383 – 3345
Resistance: 3404 – 3431 – 3445

Range, Gaps, and Whipsaws: Gold Awaits Its Next Big MoveThe final days of last week have been frustrating for Gold traders, to say the least.
Starting Thursday, when the price tested the waters around 3400, we entered a range — but not a calm one. The moves inside this range were sharp and violent: a quick rally to 3400 followed by an equally quick drop to the 3380 zone, and so on.
Even the final hours of Friday mirrored this behaviour, with Gold dipping to 3380 only to recover and close the week near 3400.
The Asian open a few hours ago brought another twist — a gap above 3400 that was quickly filled, followed by continued downside in what could be described as a classic “gap and crap” scenario.
From a chart perspective, the bigger picture is still unclear. We do, however, have two critical levels to watch:
• 3365 → important support
• 3400 → key psychological resistance and technical level
Until we get a clear and decisive break above or below one of these zones, direction remains uncertain.
Personal plan:
• I would avoid trading an immediate breakdown below support today — in such a case, I’d prefer to wait for the daily close before committing.
• On the other hand, if price pushes back towards 3400, I suspect we might finally see a breakout, so I’ll be preparing for long positions in that scenario.
For now, a wait-and-see approach seems most prudent.
Disclosure: I am part of TradeNation's Influencer program and receive a monthly fee for using their TradingView charts in my analyses and educational articles.

8/11: Sell High and Buy Low in the 3416–3372 RangeGood morning, everyone!
This week’s major data releases and news events are concentrated between Tuesday and Friday. Monday is relatively calm, so today’s strategy will mainly rely on technical analysis.
Technically, after a pullback to the MA20, last week’s weekly candle closed as a small bullish candle, and price has re-entered the strong resistance zone at 3400–3450. On the daily chart, bullish momentum hasn’t been fully released yet, but the 4H chart is showing early signs of bearish pressure. For today, keep an eye on the 3400–3420 resistance area, with primary support at 3386–3378 and secondary support at 3372–3366. Unless the bulls completely give up, a break below secondary support seems unlikely.
The main trading range for today is 3372–3416. If the market turns into a one-way move, consider a “contrarian” approach — just avoid buying high and selling low. If you find yourself in a trapped position, don’t panic. As long as risks are controlled, you can use scale-in entries or hedging to recover. If your trade rhythm is off, even holding onto positions (“sitting it out”) can reduce losses or turn a profit. Of course, if risk gets out of control, cut losses decisively — better to retreat than to blow up the account.
Account safety always comes first. Keep your capital intact, and you’ll find plenty of profitable opportunities this week — so many, you might start wondering if someone added extra days to the calendar.
If you need assistance, feel free to leave me a message.

GOLD - at support ? What's next??#GOLD... Perfect move as per our video analysis and now market just at his current immediate supporting level.
That is 3392-93
Keep close and if market hold it in that case we can expect bounce otherwise not..
NOTE: we will go for cut n reverse below 3392-93 on confirmation.
Good luck
Trade wisely
Gold is Ready For Bull MoveHello Traders
In This Chart GOLD HOURLY Forex Forecast By FOREX PLANET
today Gold analysis 👆
🟢This Chart includes_ (GOLD market update)
🟢What is The Next Opportunity on GOLD Market
🟢how to Enter to the Valid Entry With Assurance Profit
This CHART is For Trader's that Want to Improve Their Technical Analysis Skills and Their Trading By Understanding How To Analyze The Market Using Multiple Timeframes and Understanding The Bigger Picture on the Charts

XAUUSD Weekly Outlook – Bullish Setup AheadGold continues to show bullish momentum after holding above the recent breakout zone. Price is currently consolidating just above the $3,380 - $3,390 support area (green zone), which aligns with a key demand level from previous market structure.
🔍 Technical Outlook:
Support Zone: $3,380 - $3,390 (demand area)
Resistance Target: $3,437 (previous swing high)
Trend: Bullish bias remains intact as long as price holds above support.
Plan: A potential retracement into the green demand zone could provide a fresh buying opportunity targeting the $3,437 resistance.
📈 Trade Setup:
Entry: $3,385 – $3,390 (on pullback to demand zone)
Stop Loss (SL): $3,370
Take Profit (TP): $3,437
💡 Projection:
We anticipate a short-term pullback into support, followed by a bullish continuation towards the $3,437 level. A clean breakout above this resistance could open doors for further upside.
⚠ Disclaimer: This is not financial advice. Trade at your own risk and always follow your risk management rules.
#XAUUSD #Gold #TradingView #PriceAction #Forex #Commodities #TechnicalAnalysis

Shorting at highs is steadier to avoid risksAlthough gold kept breaking through its daily highs last week, rising all the way to around 3410 before starting to pull back, and the daily lows were also gradually climbing – making it easy to profit whether going long or short – I still recommend prioritizing shorting at high levels. This way, we can avoid losses if gold drops sharply. 📉
Go short at highs during the Asian session 📉
Go long at lows during the European session 📈
Go short at highs again during the U.S. session 📉
⚡️⚡️⚡️ XAUUSD ⚡️⚡️⚡️
🚀 Sell@ 3410 - 3400
🚀 TP 3390 - 3380 - 3370
Daily updates bring you precise trading signals 📊 When you hit a snag in trading, these signals stand as your trustworthy compass 🧭 Don’t hesitate to take a look—sincerely hoping they’ll be a huge help to you 🌟 👇
Market trend forecast and layout at the beginning of the week#XAUUSD
On Friday night, gold prices fluctuated rapidly before closing due to news, and finally closed near 3397. Currently, gold is fluctuating and consolidating in the 3400-3380 range. This pattern not only reflects the fierce game between bulls and bears, but also suggests that the market may be brewing a new breakthrough direction. Therefore, we need to be particularly vigilant about potential breakouts next week.
Judging from the market alone, gold is still in an upward trend channel, so at the beginning of the week we can focus on the effectiveness of the support between 3390-3380. If the support level of 3390-3380 below remains solid and the hourly line breaks through and stabilizes above 3400, then the gold price may test the key resistance level of 3410 again. Once it breaks through, it is expected to reach 3420-3430.
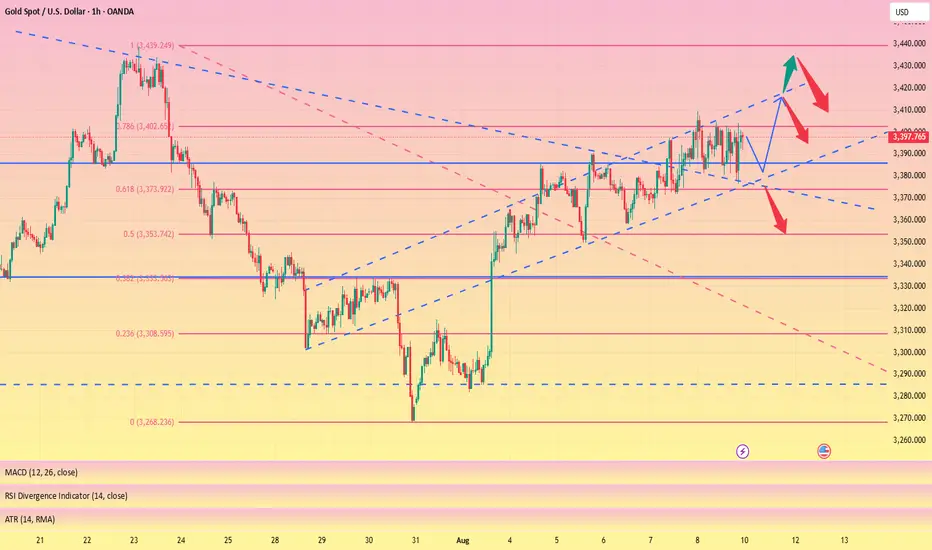
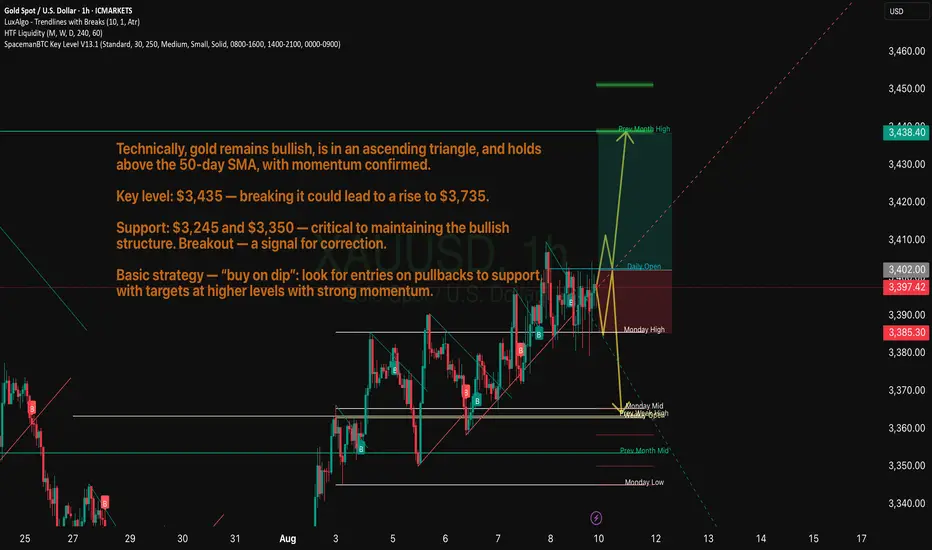
XAUUSD - General structure and basic dynamicsBrief technical analysis
1. General structure and main dynamics
Gold is trading in an ascending triangle, a bullish pattern indicating potential for further gains. The price has consolidated above the 50-day moving average, and the RSI is reinforcing the bullish sentiment.
The MACD and RSI (≈ 54.7) are signaling growing positive momentum, especially after the rebound from the lower Bollinger band and the formation of EMA-8/EMA-21 crosses.
Citi has raised its forecast to $3,300-3,600 over the next three months, given the weak US economy and the weakening dollar.
Yesterday, gold prices were close to a multi-year high near $3,400. A break of resistance around $3,435 could bring gains to the target of $3,735 (according to the “measured move” pattern).
However, an HSBC analyst warns of weakness in momentum; a pullback after growth is possible, especially with an improving global background and a delayed tightening by the Fed.
2. Key levels
Resistance:
~$3,435 — the top of the ascending triangle
If broken — potential target $3,735
Investopedia
Support:
~$3,245 — the lower boundary of the structure and the zone of a possible pullback
Next — ~$3,150 with further sales
50-day SMA: ~$3,350 — a critical level for maintaining the bullish scenario
EURUSD Analysis week 33🌐Fundamental Analysis
The US Dollar (USD) struggled to find buying momentum on Thursday, but the EUR/USD pair struggled to build upside momentum. The US economic calendar will not release any macroeconomic data that could boost USD valuations over the weekend. Therefore, investors may pay attention to comments from Federal Reserve officials and risk sentiment.
A bullish move on Wall Street after the opening bell could limit the USD’s upside momentum and help the EUR/USD pair find support. Conversely, the pair could continue to decline if the market turns cautious in the second half of the day.
🕯Technical Analysis
EURUSD is still trading in an uptrend and is facing resistance at 1.170. A break above 1.160 forms a lower boundary support zone that should prevent further downside. Pay attention to the resistance and support zones noted on the chart to have a strategy when there is a price reaction in that area.
📈📉KEY LEVEL
Support: 1.160-1.145
Resistance: 1.170-1.181
