XAUUSD Hello traders.
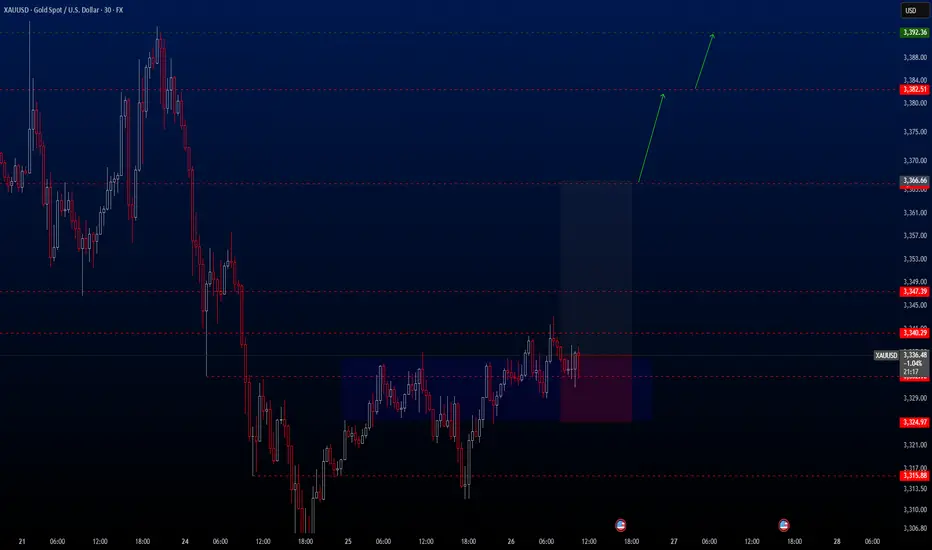
Today’s first trade setup comes from the XAUUSD pair. The pair is currently positioned in an ideal buy zone, and I’ve spotted a potential long opportunity. There are three different take profit levels, all of which are listed below. Personally, I’ll be closing my position at the first TP level: 3366.66.
However, keep in mind that two major economic events will be released today:
📌 Gross Domestic Product (GDP) (QoQ) – Q1
📌 Initial Jobless Claims
These are highly impactful events, so please manage your risk accordingly.
🔍 Trade Details
✔️ Timeframe: 30-Minute
✔️ Risk-to-Reward Ratio: 1:2.5
✔️ Trade Direction: Buy
✔️ Entry Price: 3336.62
✔️ Take Profit: 3366.67 / 3382.51 / 3392.36
✔️ Stop Loss: 3324.97
🕒 If momentum fades or the price consolidates within a tight range, I’ll keep this trade open only until 23:00 (UTC+4). After that, I’ll close it manually—whether in profit or loss—depending on how the price action evolves.
🔔 Disclaimer: This is not financial advice. I’m simply sharing a trade I’ve taken based on my personal trading system, strictly for educational and illustrative purposes.
📌 Interested in a systematic, data-driven trading approach?
💡 Follow the page and turn on notifications to stay updated on future trade setups and advanced market insights.
Xauusdanalysis
XAU/USD – Smart Money Building Toward $3360? |26 June 2025Gold (XAU/USD) is pushing into fresh highs around $3337, and we may be approaching a key inflection point. But beneath the surface of candles and wicks lies the real story — one written by liquidity, displacement, and smart money positioning.
This outlook breaks down gold’s price action using Smart Money Concepts (SMC), price structure, and Fibonacci confluence, to help identify the most probable high-value trade zones for both swing and intraday traders.
4H Outlook – Institutional Flow & Structure
Market Structure
Gold recently broke above the $3310–$3320 resistance, confirming a bullish Break of Structure (BOS). This keeps the market in a sequence of higher highs and higher lows, validating continued bullish pressure.
Smart Money Insights
BOS: Clean break above $3320 signals strength.
CHoCH: None yet — trend remains bullish.
Liquidity Sweep: Sell stops below $3295 have already been taken.
Buy-Side Liquidity: Sits above $3350 — price may gravitate there next.
FVG: Unfilled Fair Value Gap between $3314–$3322 — possible retracement zone.
Bullish OB: Identified between $3300–$3310, aligned with FVG and BOS level.
Equilibrium: Using $3275 (swing low) and $3342 (swing high), the midpoint sits near $3308, acting as fair re-entry value.
Key Zones
Buy Zone (Demand): $3295–$3310 — OB + FVG + Fib confluence.
Sell Zone (Supply): $3350–$3360 — next likely liquidity target.
Bias Summary
As long as price remains above $3295, the bullish structure stays valid. Watch for a retracement into $3308–$3316 for potential continuation toward $3350–$3360. Price may briefly dip below $3310 to trigger liquidity before moving higher.
1H View – Precision Entries
Structure
Following the high at $3342, price has pulled back slightly and is forming what appears to be a bullish flag — often a continuation pattern.
Smart Money Zones (1H)
FVG: $3315–$3322 — potential short-term reaction zone.
Order Block: $3305–$3312 — 1H bullish OB aligned with 4H bias.
Sell-side Liquidity: Swept at $3295 earlier this week — supports continuation.
Trade Setups
Long Setup #1 – Optimal Entry
Entry: $3308–$3315
Stop: Below $3295
TP: $3342 (partial), $3350–$3360 (full)
Why: Strong zone combining FVG, OB, and Fib support.
Long Setup #2 – Aggressive Entry
Entry: $3316–$3320
Stop: $3300
TP: $3340–$3350
Why: Quicker entry inside the imbalance — riskier but valid.
Short Setup – Countertrend (Low Conviction)
Only valid on a clear break below $3310 + CHoCH
Entry: Below $3310 (confirmed)
Target: $3295
Note: Lower confidence unless 1H structure turns bearish.
Final Notes
The bias remains bullish above $3301–$3308. This is a high-probability area to look for long setups on retracement. Avoid shorts unless we see a confirmed structural shift with a CHoCH and OB breakdown.
Expect the market to potentially hunt stops below $3310, then aim for liquidity sitting above $3350–$3360.

Gold continues to fluctuate. Waiting for a trend?Today, gold has been suppressed below the high of 3345, and the hourly line tends to be weak. Looking at the number of Yin and Yang lines on the hourly line during the fluctuation, we can see that the typical Yin line is continuous and the Yang line is few, plus the weak suppression of the previous day, from the rhythm point of view, it is a weak signal.
From the hourly chart, around 3312, this is the 0.618 position of the retracement of the 3295-3337 fluctuation range. The decline is slow during the day, and the 0.618 position has become a support rebound.
And the current trend, like the previous day, may continue to rebound and then fall. At the same time, there was no cyclical decline in the early Asian session. Instead, it fluctuated sideways, bottomed out and rebounded, and then continued to return to the high of the previous day.
Judging from the current market situation, the Asian market bottomed out and rebounded in the morning, reaching a high of around 3343, and then began to fall back, and is currently fluctuating around 3335.
The trend of the European session is very critical, and the focus is on the watershed below 3328. If this position falls below, the price will most likely continue to fall.
Operation strategy:
Short around 3340, stop loss 3350, profit range 3320-3310.

Trading Strategy (XAUUSD) – June 25, 2025 After a sharp decline in the previous session, XAUUSD has shown a mild recovery and is currently trading around 3,332 USD. However, price action suggests this could merely be a pullback within a broader downtrend, as gold has yet to break above the key resistance zone.
Technical Analysis
Price Action
Gold has bounced from the support zone between 3,291 – 3,317 USD, which has historically acted as a strong demand area. This zone also aligns with the Fibonacci 0.382 retracement from the previous bullish leg.
However, XAUUSD remains below the key resistance zone at 3,373 – 3,392 USD, which is a confluence of:
- The Fibonacci 0.618 retracement from the most recent downtrend
- A historical supply zone that has been rejected multiple times
- The upper boundary of the sideways range formed since May
- If price fails to break through this zone in the coming sessions, the risk of continued downside remains high.
RSI Indicator
- The RSI (14) is currently hovering around the neutral zone (49–54), indicating that the rebound lacks the strength needed to confirm a trend reversal.
- The RSI has not crossed above the 55 threshold, suggesting the dominant trend is still bearish.
Key Technical Levels to Watch
Resistance:
- 3,373 – 3,392 USD: Confluent resistance zone (Fibonacci 0.618 + prior supply zone)
- 3,435 – 3,452 USD: Major swing high, a key medium-term reference level
Support:
- 3,291 – 3,317 USD: Immediate support zone, still holding strong
- 3,250 – 3,224 USD: Potential downside target if the bearish momentum resumes
Suggested Trade Setups
Scenario 1 – Buy if price holds above 3,291 and shows confirmation signals
Entry: 3,295 – 3,300 USD
Stop-loss: Below 3,289 USD
Take-profit: 3,340 – 3,355 – 3,370 USD
Conditions: Must show clear bullish reversal patterns (Pin Bar, Bullish Engulfing) on H1 or H4 timeframe
Scenario 2 – Sell if price rejects from resistance zone with confirmation candle
Entry: 3,370 – 3,375 USD
Stop-loss: Above 3,392 USD
Take-profit: 3,330 – 3,310 – 3,290 USD
Conditions: Clear bearish rejection candle + declining volume
Note: XAUUSD is currently in a technical rebound phase after a strong drop but lacks solid reversal confirmation. Traders should closely monitor the price reaction near the 3,373 – 3,392 USD resistance zone over the next sessions. This area will determine whether the downtrend will resume or a reversal begins.
Stay tuned for more daily trading strategies, and make sure to save this analysis if you find it helpful for your trading plan.
Strategy analysis by @Henrybillion

XAUUSD Technical Outlook – Rebound or Trap?1. Market Overview
After a sharp rejection near the 0.618 Fibonacci level, XAUUSD has pulled back and is now trading around 3,323 USD. Although price has stabilized somewhat, technical indicators suggest this is likely a corrective move within a prevailing downtrend.
2. Technical Analysis
Price Action
XAUUSD is currently hovering near 3,323 USD after a failed attempt to break above the resistance zone at 3,373–3,392 USD — an area marked by:
The 0.618 Fibonacci retracement from the recent downtrend
Repeated historical rejections.
The upper boundary of a sideways consolidation range from early June.
Recent candlesticks show indecision and rejection from higher levels, suggesting sellers are still in control.
Support Zone Behavior
The price recently bounced from the 3,294–3,317 USD range, where strong historical support and the 0.382 Fibonacci level align.
This zone continues to hold, but if broken, could open the door to deeper declines toward the 3,250 or even 3,224 USD levels.
RSI Indicator
RSI remains flat around the neutral zone, indicating a lack of bullish momentum.
No significant divergence or breakout signals are currently visible on the daily RSI chart.
3. Key Technical Levels
Resistance:
3,373 – 3,392 USD: Confluence resistance zone (0.618 Fib + historical supply).
3,435 – 3,453 USD: Previous swing high – key medium-term benchmark
Support:
3,294 – 3,317 USD: Immediate support, holding for now.
3,250 – 3,224 USD: Potential next target zone if bearish pressure resumes.
4. Trade Setup Scenarios.
Scenario 1 – Buy if support holds and bullish confirmation appears
Entry: 3,295 – 3,305 USD.
Stop-loss: Below 3,289 USD.
Take-profit: 3,340 – 3,355 – 3,370 USD.
Condition: Look for bullish reversal patterns (e.g., Bullish Engulfing, Pin Bar) on H1–H4.
Scenario 2 – Sell on rejection from resistance zone
Entry: 3,370 – 3,375 USD.
Stop-loss: Above 3,392 USD.
Take-profit: 3,330 – 3,310 – 3,290 USD.
Condition: Clear bearish rejection candlestick with diminishing volume
Note:
XAUUSD remains in a vulnerable state. The current move may be a technical rebound rather than a true reversal. Traders should watch closely how price behaves around the 3,373–3,392 USD zone in the coming sessions. A breakout could signal a new bullish leg, while another rejection would likely confirm a continuation of the bearish trend.
Gold Price Struggles at Key Support ZoneTechnical Analysis – Data as of June 25–26, 2025
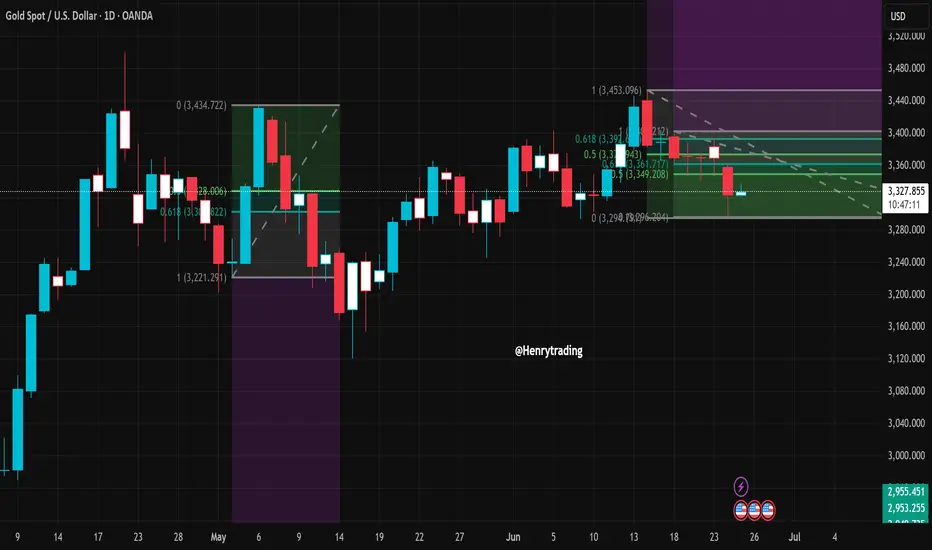
In the latest trading sessions, XAUUSD continues to move within a narrow range, reflecting a cautious market sentiment awaiting clearer signals. The daily chart shows price hovering around the 3,341 USD level — aligning with the 0.618 Fibonacci retracement and intersecting key descending trendlines and previous correction zones.
1. Notable Price Action:
Gold has bounced slightly from the 3,294 USD support and retested the 3,360–3,365 USD resistance but failed to break through.
Small-bodied candles with long wicks indicate indecision, suggesting that neither buyers nor sellers have a clear upper hand.
The descending trendline (blue line) is acting as a significant resistance barrier, with each bullish attempt being rejected.
2. Key Support and Resistance Levels:
Immediate Support: 3,294 – 3,296 USD
Nearby Resistance: 3,360 – 3,365 USD
Crucial Breakout Zone: 3,382 – 3,394 USD (Fibonacci 0.618 – 0.786 of the latest downleg)
3. Short-Term Trading Strategy:
If XAUUSD maintains support above 3,294 USD, a short-term technical rebound toward 3,360 – 3,394 USD is possible.
However, a clean break below 3,294 with strong volume could trigger further downside momentum, potentially targeting 3,265 USD or even 3,221 USD.
4. Overall Outlook:
The market is currently in a state of uncertainty, with neither side showing dominance. Traders are advised to wait for a decisive breakout in either direction before entering new positions. Breakout trading strategies with volume confirmation should be prioritized in this phase.

Gold may continue to rebound to 3350-3360If gold can stand above 3330 today, it will stimulate long trading behavior to a certain extent, especially the self-rescue behavior of trapped longs. Gold may continue to rebound and is expected to reach the 3345-3355 area. So there is no need to risk shorting gold near 3330 for the time being; although gold may continue to rebound, it is still under pressure in the 3350-3360-3370 area; and gold is still weak overall, so we can consider shorting gold in the 3350-3360 area and look at the target area of 3325-3315.
The Premium privilege of my account will end on June 26, and it will stop updating here from tomorrow. Friends in the channel have already made a lot of money by following my trading strategy. Friends who have not joined yet can join and receive the latest trading strategies and trading signals as soon as possible to escort your trading!

GOLD - Near to CUT n REVERSE Area? What's next??#GOLD... market placed a very reasonable high that is around 3338-39 around
Keep close that area because if market holds then drop expected otherwise not..
Note: we will go for cut n reverse above 3338-39 on confirmation.
Good luck
Trade wisely

Gold Peaked, Deep Analysis: MACD & RSI, Targets: $3,131 & $2,904Gold (XAUUSD) already peaked. The 22 Apr session was a clear top signal. A very strong one at that. The chart is showing a lower (red arrows) and overall distribution channel. Trading volume continues to drop. Bearish volume is predominant.
Gold produced a strong rally, it lasted 159 days. Total growth amounts to +39% from bottom to top, starting November 2024, end April 2025.
It's been 64 days since the all-time high. No new highs, no bullish momentum. Geopolitical factors that would push Gold to new all-time highs, a war, did show up recently, a surprise event and yet Gold's price failed to move higher. This is a warning signal.
The RSI is weak now. Gold is trading very high, a very strong price but with a risk RSI. This is another warning signal, a strong one. Bullish would be the contrary, low price with a strong RSI. A weak RSI at this point can be interpreted as the bullish force being exhausted.
The daily MACD is pretty bad. Trending fully down with no possibility of anything bullish. Here is the chart.
This is a friendly reminder. Switch to Crypto.
You've been warned.
Namaste.

Gold Short Term OutlookYesterday, we noted that gold needed to close and hold above the $3,330 resistance to open the path toward $3,346 and potentially $3,375.
Since then, price rejected the intraday support and is now trending above the $3,330 level.
Currently, the 50MA is acting as dynamic resistance. A clean break above it could trigger a move toward $3,346 and possibly higher resistance zones.
However, if bullish momentum fades, price may drop back toward the key support area, where buyers could look to step in again.
🔑 Key Levels:
Resistance:
$3,330 • $3,346 • $3,361 • $3,375
Support:
$3,306 • $3,287 • $3,271 • $3,242

BTC continues to short at high levels during the day📰 Impact of news:
1. Geopolitical impact
📈 Market analysis:
BTC has reached an intraday high of 108,125, just one step away from the all-time high of 112,000. With the increase in trading volume and institutional sentiment turning bullish, the momentum seems to be in the bulls' favor. In addition to institutional buying, the ceasefire agreement in the Iran-Israel war is also an important factor in Bitcoin's sharp rebound. Trump's announcement of the end of the war almost immediately triggered a surge in the cryptocurrency market. However, the overall pattern has not changed, and the range resistance has not been broken, so we still keep the idea of shorting at high levels.
🏅 Trading strategies:
SELL 108000-107500
TP 104500-103500
If you agree with this view, or have a better idea, please leave a message in the comment area. I look forward to hearing different voices.

Short gold after reboundGold rebounded after touching 3312, and has now rebounded to 3330, but the rebound strength is far less than the decline strength, so the overall performance of gold is still weak. Because gold fell sharply yesterday, the market bullish confidence suffered a heavy blow, and there are many resistances above after gold fell and broke, and it is under pressure at 3340-3350 in the short term, and there is a technical gap above that suppresses the 3360-3370 area.
Therefore, before gold stabilizes in the 3360-3370 area, the short-selling force still has the upper hand, so we still focus on shorting gold in trading. We can consider shorting gold with the 3340-3350 area as resistance, and look at the target area of 3320-3310.
The Premium privilege of my account will end on June 26, and it will stop updating here from tomorrow. Friends in the channel have already made a lot of money by following my trading strategies. Friends who have not joined yet can join and receive the latest trading strategies and trading signals in the first time to protect your trading!

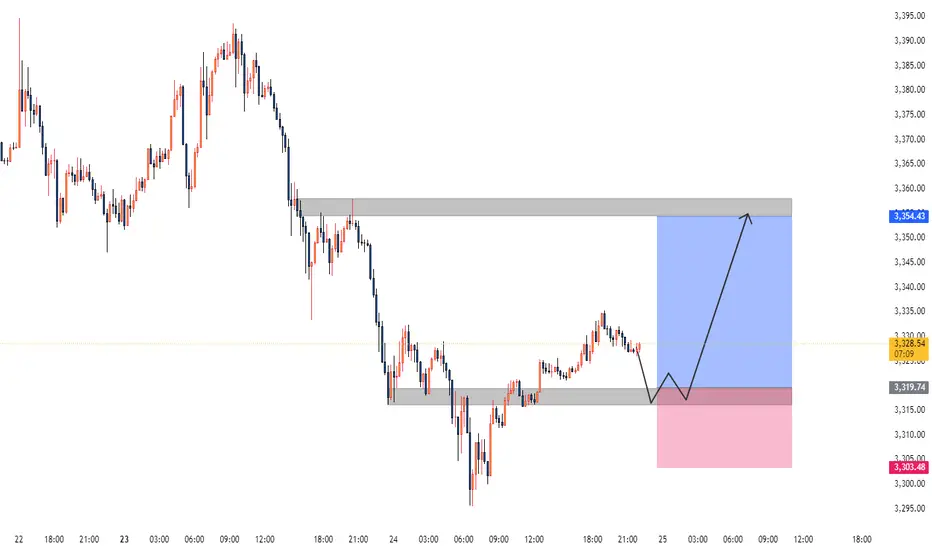
Gold XAUUSD Analysis 25.06.2025The Gold shows with a recent upward trend following a period of consolidation and a dip. Key observations:
The price previously fluctuated between a support level around 3,310-3,319 and a resistance near 3,354.
The current price is consolidating near the recent high, suggesting potential for further upward movement or a pullback.
Signal:
Buy signal is present in the range of 3,316-3,319, aligning with the support level, offering a good entry point for a potential upward move.
Gold fluctuates upward. Trend change?Yesterday, the gold daily line closed with a middle-yin candlestick with a lower shadow. The closing price has lost the middle and lower rail positions one after another, and the short-term downward pressure adjustment will continue.
The hourly level shows a bottoming out and rebound, and it rose in the early Asian session, breaking through the pressure resistance of 3328-3332 in the European and US sessions yesterday, but it did not continue the rebound and fell into a narrow range. At present, there is still great resistance above 3340, and it has failed to break through after many attempts, but the hourly line track has not been completely lost.
Pay attention to the 3315 support for long positions, and pay attention to the 3340-3355 short position range for upward movement. For the period of shock, strong support or resistance will inevitably produce inertial puncture behavior, and some errors are normal. We need to pay attention to the market trend at all times and change strategies in time.
Today we need to focus on the response strategies for resistance and support levels, which will determine whether we can achieve profits within the fluctuation range.
Good luck to everyone.

Suppression remains unchanged, the latest layout of gold📰 Impact of news:
1. Powell's testimony
2. Geopolitical impact
📈 Market analysis:
The short-term rebound of gold is the release of energy for the accumulated bulls. From the current market trend, 3340 above is the key point of the short-term watershed between bulls and bears. The short-term resistance above is around 3342-3348, and the short-term support below is around 33220-3315. If it falls below this, it will continue to look towards yesterday's low of 3290-3280. The daily level is under pressure and continues to see a decline and adjustment. If it touches 3340-3350 above, you can try to short. After it retreats to 3320-3315 and obtains effective support, you can consider going long.
🏅 Trading strategies:
SELL 3340-3350
TP 3330-3320-3315
BUY 3320-3315
TP 3330-3340-3350
If you agree with this view, or have a better idea, please leave a message in the comment area. I look forward to hearing different voices.
OANDA:XAUUSD FX:XAUUSD FOREXCOM:XAUUSD FXOPEN:XAUUSD TVC:GOLD

XAUUSD I Forecast Ahead of USD Unemployment ClaimsWelcome back! Let me know your thoughts in the comments!
** XAUUSD Analysis - Listen to video!
We recommend that you keep this pair on your watchlist and enter when the entry criteria of your strategy is met.
Please support this idea with a LIKE and COMMENT if you find it useful and Click "Follow" on our profile if you'd like these trade ideas delivered straight to your email in the future.
Thanks for your continued support!Welcome back! Let me know your thoughts in the comments!

Gold is overall dominated by bearish sentiment.On Wednesday, gold prices edged higher, mainly driven by the U.S. Dollar Index hovering near a one-week low and depressed U.S. Treasury yields, which enhanced purchasing power for non-U.S. dollar investors. The market remained focused on the Middle East situation, as the fragile ceasefire between Israel and Iran still held uncertainties. However, with the temporary de-escalation of conflicts between the two sides, the geopolitical risk premium that previously boosted gold gradually dissipated, and safe-haven funds continued to flow out of the gold market, limiting the upside space for gold prices.
Technically, gold's daily chart formed a large bearish candle, notching the seventh consecutive weekly decline, which significantly disrupted the recent bullish structure. Current market sentiment is clearly skewed toward bearishness. After last night's sharp decline, a technical correction may occur today, but the horizontal high at 3,347 has become a key resistance level. Failure to break through this level will maintain short-term selling pressure. On the downside, focus on the 3,300 support zone—if breached, it may trigger further declines toward the previous low of 3,290.
you are currently struggling with losses,or are unsure which of the numerous trading strategies to follow,You have the option to join our VIP program. I will assist you and provide you with accurate trading signals, enabling you to navigate the financial markets with greater confidence and potentially achieve optimal trading results.
Trading Strategy:
sell@3335-3340
TP:3300-3295
Bulls have made profits, gold layout in the evening📰 Impact of news:
1. Powell's testimony
2. Geopolitical impact
📈 Market analysis:
I have completed the long trade according to the previous trading strategy, and the long order has generated profit. In the short term, the overall trend of gold is still bearish. Only if it breaks through and stabilizes above 3350 can the bulls continue. If it rebounds to the 3330-3335 line and encounters resistance under pressure, you can consider shorting. If it rebounds to 3340-3350 but fails to stabilize, you can increase your short position. Pay attention to the support of 3320-3300 below. If it falls below 3300, it is expected to reach 3280
🏅 Trading strategies:
SELL 3330-3335-3340-3350
TP 3320-3310-3300-3280
If you agree with this view, or have a better idea, please leave a message in the comment area. I look forward to hearing different voices.
OANDA:XAUUSD FX:XAUUSD FOREXCOM:XAUUSD FXOPEN:XAUUSD TVC:GOLD

Start going long on goldAlthough gold is under pressure and weak at present, gold still rebounded near 3295 under the influence of yesterday's major negative news, proving that there is still a large amount of buying funds below, limiting the retracement space of gold; and from 3295 to 3335, there is still a rebound space of $40, proving that gold is not extremely weak. Moreover, there is a gap left above, and there is a technical need to rebound to fill the gap;
In addition, yesterday gold fell sharply due to news, and there should be many longs trapped in the market. If gold is relatively stable, there may be self-rescue behavior of the trapped longs, so gold longs still have the opportunity to rebound to 3340-3350. At present, the main focus is on the short-term support area of 3315-3305, and we can moderately consider going long on gold in this area.

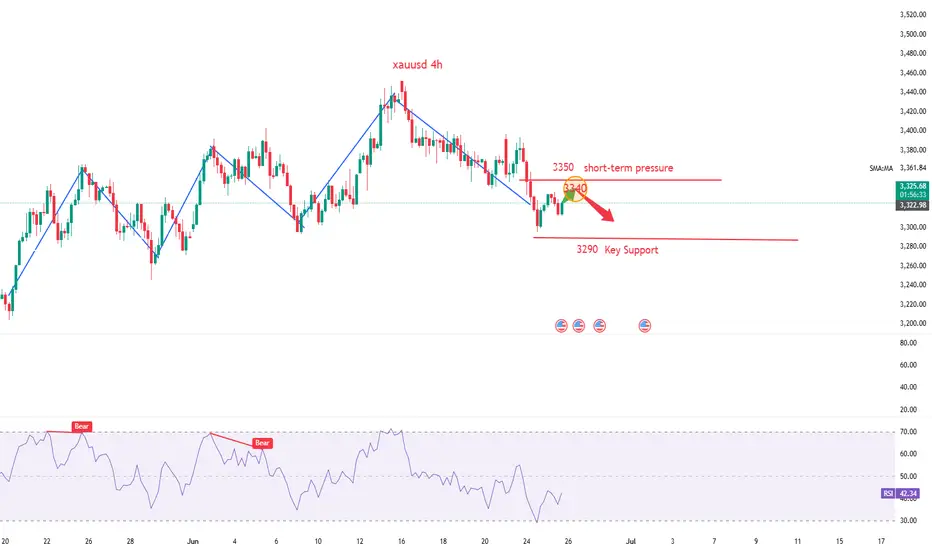
Gold Spot / U.S. Dollar (XAU/USD) 4-Hour Chart Analysis4-hour chart from OANDA shows the recent performance of Gold Spot priced in U.S. Dollars (XAU/USD), with the current price at $3,313.650, reflecting a decrease of $9.800 (-0.29%). The chart highlights a recent upward trend followed by a pullback, with a support zone around $3,301.186 to $3,313.650 and a resistance level near $3,380.030. The inset provides a zoomed-in view of the price action, indicating potential volatility with a lightning bolt symbol and U.S. flags, suggesting significant market movements or news

GOLD Made H&S Reversal Pattern , Chance To Sell To Get 200 PipsHere is My 15 Mins Chart On Gold and we have a very good reversal Pattern , Head & Shoulders , we have a 15 mins closure below neckline 3322.00 we can enter a sell trade and targeting at least 100 pips as scalping , we can enter after waiting the price to retest neckline and then enter . and the price can reach 3300.00 to 3296.00 again .

GOLD/XAUUSD SellGold price is still bearish in the short term. The US dollar is currently being boosted. There are also geopolitical talks and indirect ceasefires. Therefore, the short-term risk aversion sentiment has declined. The gold price is now quoted at: 3323. We can focus on the lower target of 3300-3290.

Gold fluctuates, 3300 may fall below.Gold fell to 3333 on Tuesday and then rose to around 3358, then began to fall slowly due to resistance, continued to fall in the European session, and fell to around 3295 in the US session, and rebounded in the late trading, rebounding to around 3325, and the daily line closed with a negative line with a lower shadow.
In addition, Israel and Iran both accused each other of violating the agreement, which brought uncertainty to the gold market.
After the sharp drop in gold last week, except for the correction of the cross positive line on Tuesday last week, the daily level has closed five consecutive negative lines since last Wednesday until now, fully demonstrating that the gold price has shown a weak feature of fluctuating downward in recent transactions.
From the technical indicators, the 5-day moving average and the 10-day moving average cross downward, which indicates an important signal that the market trend is weakening in the short term. The current gold price continues to run below the moving average, further verifying the current market situation where shorts dominate.
In terms of resistance, the 5-day moving average is currently around 3350, and the 10-day moving average is around 3370. These two price levels constitute the key resistance range in the upward process of gold prices. As long as the gold price fails to effectively break through this resistance band, it is likely to continue to be weak in the short term. At the support level, pay attention to the 60-day moving average around 3290.
Operation strategy:
Short gold rebounds around 3350, stop loss 3360, profit range 3320-3310.
Go long gold falls back to around 3295, stop loss 3285, profit range 3330-3340.
The market conditions are often not what we ideally want. This is the market, and it is also a form of trading practice.
