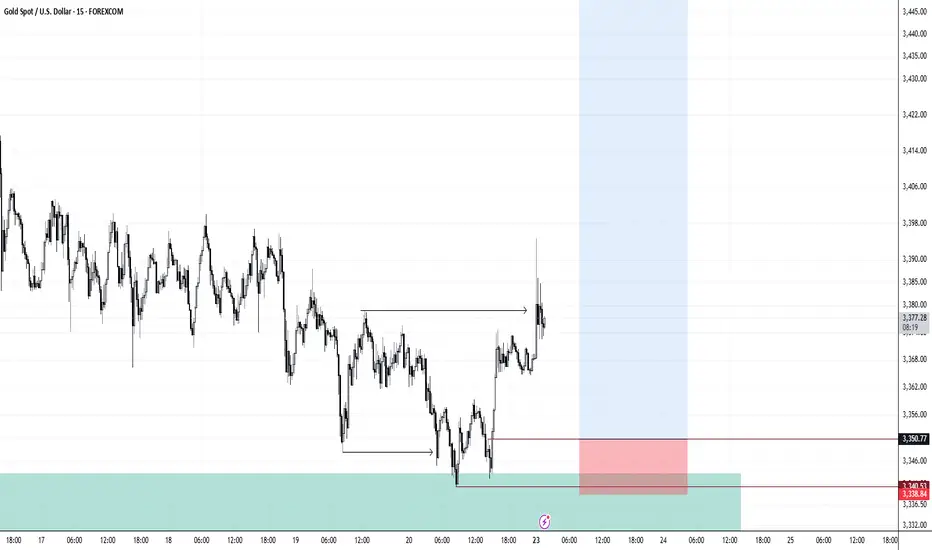
Gold (XAU/USD) 4H Analysis-23 June 2025Gold (spot XAU/USD) is currently trading around $3,358. On the 4-hour chart, price has been range-bound between $3,356 and $3,400. Recently, gold attempted to break higher (up to around $3,394) but quickly reversed — a sign that the breakout may have been a smart money trap. Technically, the structure saw a break below $3,380 in mid-June, leading to a push toward the $3,323 region. This reflects a short-term bearish wave followed by stabilization near the lows.
Bias: The market is currently neutral-to-bullish, depending on key supports. As long as price holds above the $3,322–$3,330 swing-lows, dips are considered buying opportunities. Notably, an order block/demand zone around $3,357–$3,360 appears to be holding well and attracting buyers. On the upside, $3,400 acts as a strong resistance level. A break above $3,400 would shift the bias firmly bullish, while a break below $3,338 would suggest bearish momentum returning.
🔑 Key 4H Support & Resistance Levels
Resistance:
• $3,400 – Major round number and recent high
• $3,434–$3,435 – Next resistance above $3,400
• $3,451–$3,452 – Recent swing top
• $3,500 – All-time-high level
Supply Zone:
• $3,388–$3,394 – Minor resistance and previous support turned supply
Demand Zone (Order Block):
• $3,357–$3,360 – Major 4H demand area showing strong buyer interest
Support:
• $3,338 – Critical support level below the order block
• $3,322–$3,323 – Multi-source key swing support
• $3,280–$3,300 – Lower targets if support fails
• $3,260 or below – Worst-case downside projection if breakdown accelerates
📈 1-Hour Intraday Trade Setups
Buy the Dip
• Entry: $3,357–$3,360
• Confirmation: Bullish reversal candle on 1H
• Stop Loss: Below $3,336
• Targets: $3,380 → $3,400
Sell a Rejected Rally
• Entry: Near $3,400 (only if clear rejection is seen)
• Confirmation: Bearish reversal candle or price stalling
• Stop Loss: Above $3,400
• Targets: $3,360 → $3,330
Breakdown Short
• Entry: If price breaks below $3,338 with strong 1H close
• Stop Loss: Above $3,345
• Targets: $3,323 → $3,300
Bullish Breakout Trade
• Entry: Break and retest above $3,400
• Confirmation: Clean 1H close above $3,400
• Stop Loss: Just below $3,400
• Targets: $3,434 → $3,452
✅ Final Takeaway
Gold is currently trading inside a $3,330–$3,400 range. The best intraday opportunity is to buy dips into the $3,357–$3,360 demand zone with a stop below $3,330, targeting $3,400+. If support breaks, flip to short toward $3,320–$3,300.
Xauusdanalysis

Gold Spot / U.S. Dollar (XAU/USD) 4-Hour Forex Chart4-hour forex chart displays the price movement of Gold Spot (XAU) against the U.S. Dollar (USD) from late June to early July 2025. The chart shows a recent price of 3,377.73 USD, with a slight increase of +9.76 (+0.29%). The candlestick pattern indicates a downward trend following a peak, with a highlighted resistance zone around 3,400 USD. The chart includes a 4-hour timeframe and key price levels ranging from 3,330.00 to 3,400.00 USD.

gold ready for buy buying zone=3355-3360, gold is approaching a strong demand zone with confluence of fibonacci (0.5-0.61)levels.
possible structure shift to upside !
target= 3368-3388
final move can be 3410

After the support at 3,340 for gold, a rebound may be expected.The gold price rebounded after falling from the all-time high of 3,500 to 3,120. It opened at 3,433 last week, dipped to the low of 3,340 before rebounding to close at 3,368. The weekly candlestick was bearish but held above the 5-week moving average. The daily chart shows a doji star with a bearish alignment, yet it maintained the support of the middle Bollinger Band. The 4-hour chart remains within the upward channel, with the support near 3,340 proving effective, indicating short-term signs of stabilizing. This morning, it gapped up to 3,398 and then slightly corrected. The market's safe-haven position replenishment demand supports the gold price. In terms of operation, it is recommended to focus on going long on pullbacks.
you are currently struggling with losses,or are unsure which of the numerous trading strategies to follow,You have the option to join our VIP program. I will assist you and provide you with accurate trading signals, enabling you to navigate the financial markets with greater confidence and potentially achieve optimal trading results.
Trading Strategy:
buy@3350-3360
TP:3390-3395

Gold BuysH4 structure we are bullish, M15 we chOch and wait for pullback then continue with buys. With the iraq wars, investors are looking for a save haven and saving their cash in gold. We are bullish for the week
6/23 Gold Analysis and Trading ViewsGood morning, everyone!
Over the weekend, former President Trump announced and carried out an attack on Iran's nuclear facilities, triggering a renewed wave of risk-off sentiment in the markets. At today’s open, gold surged to around 3394. Driven by geopolitical tensions, the bearish technical structure has temporarily been disrupted.
Whether the bullish momentum can sustain will depend on how the situation continues to unfold.
Key technical levels to watch today:
Resistance: 3389 / 3407 / 3423 / 3432
Support: 3372 / 3365 / 3356 / 3348
Trading strategy: Given the current news-driven market, a buy-on-dip approach is preferred, with short positions as a secondary option depending on price reaction near resistance zones.
Also, pay close attention to today’s daily close (1D chart). If the price closes below 3355, it could signal profit-taking from the bulls, potentially pulling gold back into a bearish technical trend.

#XAUUSD #GOLD 4H#XAUUSD 4H Trade Update
Gold continues to respect its bullish market structure, with clear Breaks of Structure (BOS) and formation of higher lows. Currently, price is consolidating around a key ascending trendline and demand zone.
📍 Entry Zone: 3,340 – 3,345
🎯 Targets: 3,370 / 3,390 / 3,400
❌ Stop-Loss: Below 3,315
This setup was shared yesterday and has since been perfectly activated as price tapped into our marked demand zone.
#Gold #Silver #ForexTrading #XAUUSD #PriceAction

Gold Trade Setup - 22/Jun/2025Hi Traders,
I expect this pair to go Up after finishing the correction.
1) We are in uptrend and potentially correcting for further upside.
2) The current move can be just a part of a intermediate correction or can even go to break the top.
How to Enter : Look for engulfing with in the SL zone.

XAUUSD Golden LEVELSMarket Overview
📈 TCL (Trend Change Level): 3330
📊 WIMP (Weekly Important Mid-Price): 3403.2
Update: Prices have closed above 3368.60. This shifts the bias for order blocks: those entirely above this level are now considered bearish, and those entirely below are bullish.
📌 Market Outlook for Monday
Our observation from Friday's New York session is crucial: the high was not even close to Thursday’s high. This implies that price failed to go above the **3276–3278** range.
**Expectation:** We anticipate that Friday’s low will be broken during Monday's NY session, signaling potential further downside.
🔍 Key Support Zone
We expect prices may find strong support around the **3312 – 3320 – 3324** range.
If this support holds, the market may head towards the key weekly level of **3403.2**.
⚠️ Price Behavior at 3403.2 – A Critical Juncture
If **3403.2** is reached during the Asian session or London session, it could present a good shorting opportunity on Monday.
If the price doesn't break **3403.2** during early sessions, then we expect this level to be taken out by Wednesday's NY session.
📊 Order Blocks – Zones to Watch
Understanding these institutional areas of interest can provide valuable insights into potential reversals or continuations.
Timeframe Order Block Zones Bias
H1 3352–3340 Bullish
H1 3330–3319 Bullish
H1 3308–3294 Bullish
H1 3452–3432 Bearish
H1 3395–3389 Bearish
H1 3368–3379 Neutral
H4 3452–3430 Bearish
H4 3320–3293 Bullish
H4 3342–3318 Bullish
H4 3375–3338 Neutral
D1 3424–3500 Bearish
D1 3240–3121 Bullish
D1 3019–2953 Bullish
📝 Important Notes for Your Trading Plan:
Always pay close attention to session-wise reactions, especially around the 3403.2 level.
Remember that bearish or bullish biases for order blocks are clearly indicated for each specific timeframe.
These identified zones are critical turning points that can significantly aid your trade planning.

XAUUSD Analysis todayHello traders, this is a complete multiple timeframe analysis of this pair. We see could find significant trading opportunities as per analysis upon price action confirmation we may take this trade. Smash the like button if you find value in this analysis and drop a comment if you have any questions or let me know which pair to cover in my next analysis.

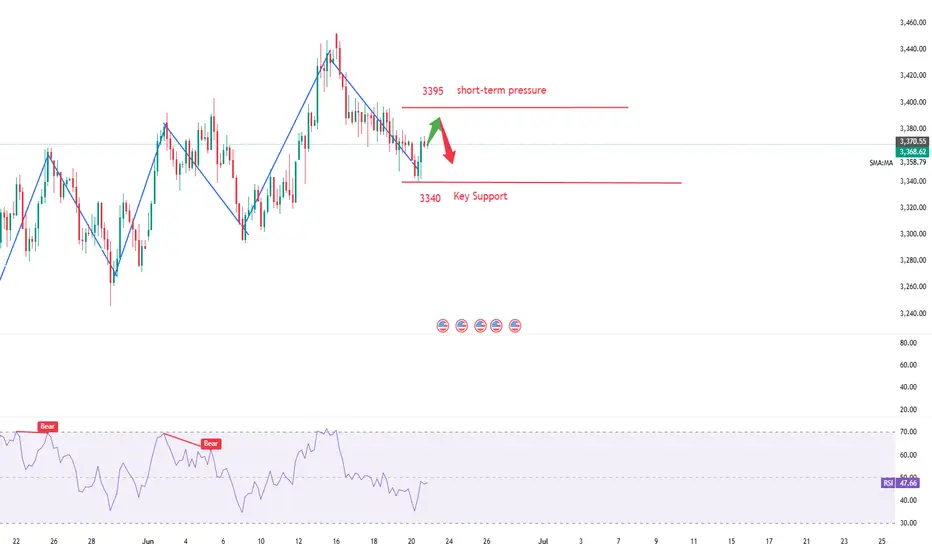
Analysis of Gold's Trend for Next WeekThe gold price peaked at the all-time high of 3,500 and then corrected to 3,120. After consecutive rallies, it faced resistance again at 3,452 due to the fading of market risk aversion. The week opened at around 3,433, hit a low of 3,340 on Friday, rebounded, and closed at around 3,368. The weekly candlestick closed bearish, but still above the 5-week moving average. The daily chart formed a doji star, with the candlestick pattern leaning bearish, while holding the middle 轨 (middle Bollinger Band) support. The 4-hour chart maintains an upward channel. As the market failed to break below the lower channel line this week, the downside space was not further opened. The price rebounded near the lower channel support at 3,340, showing temporary signs of stabilization. The short-term trend may continue to rebound, with key resistances at 3,380 and 3,404. If these resistances cannot be broken, the market will remain range-bound with a bearish bias. If broken upward, the bullish momentum of gold will truly emerge. Next week, if the opening strongly breaks through 3,380, we will go long on pullbacks. If there is no obvious change and it remains pressured at 3,380, we will continue to expect a decline.
you are currently struggling with losses,or are unsure which of the numerous trading strategies to follow,You have the option to join our VIP program. I will assist you and provide you with accurate trading signals, enabling you to navigate the financial markets with greater confidence and potentially achieve optimal trading results.
Trading Strategy:
sell@3390-3380
TP:3340-3350
21/06/2025 || GOLD prediction || Bullish MomentumThrough my weekly Episode multi time frame analysis , you will get deep insights .
Market in on rising channel since last year and did not respect the 2960 milestone after breaking it,Seconldy the weekly candle rejected at 3335-3338 and closes above its previous structural support at 3330-3335.
our eyes will be at 3430 first then 3520 milestone on this next weekly candle


USDJPY ANalysis week 26Fundamental analysis
The Fed kept interest rates unchanged and forecast only a small cut in 2026-2027 due to concerns about high inflation. The number of officials opposing a rate cut this year increased. The Israel-Iran conflict escalated, the US may attack Iran but is waiting for Tehran's response, causing the Japanese Yen to appreciate thanks to its safe-haven role.
Japan and the US have not reached a trade deal, the risk of higher tariffs before the July 9 deadline. The US dollar is near a one-week high, supporting the USD/JPY pair, but investors remain cautious due to the lack of new economic data.
Technical analysis
USDJPY is rising quite strongly and reacting at the resistance zone of 146.200. There is a possibility of a price gap next week, so trading early will be quite risky. The trading range is expected to be clearer at the resistance and support zones. 146,800 and 147,700 are noted as the two important upper boundary zones. 145,400 and 144,400 will be important support zones with a very strong buyer force waiting.
Trading Signals

XAU/USD Bearish Pattern Analysis XAU/USD Bearish Pattern Analysis 📉
The chart presents a potential bearish continuation setup in the XAU/USD pair, highlighted by technical structures and key price levels:
📊 Technical Breakdown:
🔸 Bearish Rejection from Resistance
Price rejected strongly from the 3,440.000 resistance zone, marked with a red arrow.
This area has acted as a historical supply zone, triggering repeated reversals.
🔸 Descending Channel Formation 📉
A clear bearish flag/channel structure is visible post-rejection.
Price action broke down from the channel, signaling potential trend continuation.
🔸 Target Level 🎯
The expected target is around 3,304.374, aligning with previous support zones and structure lows.
This level coincides with a measured move from the channel breakdown.
🔸 Higher Lows Pattern Before Reversal ⭕
Prior to the current decline, the market formed a series of higher lows, highlighted with orange circles — suggesting a buildup before reversal.
🧭 Key Levels to Watch:
Resistance: 3,440.000 – 3,420.000 🔼
Current Price: 3,368.750
Short-Term Target: 3,304.374 🎯
Major Support: 3,140.000 – 3,160.000 🛡️
📌 Outlook:
The rejection from resistance coupled with the descending channel breakdown indicates bearish momentum. If the market maintains below the recent high, further downside towards 3,304 is expected. Break below this may expose deeper support zones.
📉 Bias: Bearish
⏳ Short-term Action: Watch for breakdown confirmation and momentum continuation.

GOLD[XAUUSD]: Breakthrough the bearish pressure, What next?Evening Everyone,
Hope you are doing great, price recently breakthrough the current price inducement, showing a strong bullish volume emerging in the market. Long term approach remain bullish ultimately taking the price towards the new high.
Good luck
Team Setupsfx_
