USDJPY Trading StrategyUSDJPY is looking to break the resistance zone of 147,000. The current bullish force of USDJPY is too strong, so jumping in to catch the top at the present time will be quite risky. If you want a SELL signal, you must wait for the confirmation of the sellers jumping into the market by the confirmation of the red closing m30 candle.
There will be a beautiful SELL signal if the h4 candle shrinks its wick below 147,000. If it closes above the SELL point, you must wait for 148,100, or if you want to BUY, wait for the retest and create a beautiful bullish wave in the small time frame.
On the other hand, if the currency pair declines back to the support zone of 146,000 and 145,200, it will give us a long-term BUY signal.
Support 146,000-145,200
Resistance 117,100-148,100
Xauusdanalysis

Gold price analysis June 23The last two D1 candles have continuously withdrawn their wicks. The Sellers may no longer be interested in dominating the market.
Currently, Gold is moving sideways in a wide range. 3345 and 3375 are the two Breakout zones of the gold price in today's trading day. When breaking out of the breakout zone, the price will continue its strong trend. Limit trading against the trend when the price breaks out.
Trading signals may also appear if there is confirmation from the candle that does not break out of this breakout zone.
The resistance and support zones remain the same as last week. The upper limit is at 3400 and 3415. The lower limit is still at 3322 and 3296

DROP ON CEASEFIRE H4 Timeframe Analysis
Gold is currently holding the Rising wedge pattern on H4 Today we have volume opening Gap on OANDA which is still pending.
Market is holding the Range of 3330-3380
What's possible scanarios we have?
I'm expecting the upside move towards my Targets.
if gold sustained with this rising Parallel channel and H4 remains above 3332-3335 then target will be 3360 then 3380 on mark
On the otherhand if The H4 candle closes below 3328-3320 buyying will be limited and market will again the rangbound 3290-3330
#XAUUSD

Gold Spot / U.S. Dollar (XAU/USD) 2-Hour Chart2-hour chart from OANDA shows the price movement of Gold Spot (XAU/USD) against the U.S. Dollar. The current price is $3,344.210, reflecting a decrease of $24.965 (-0.74%). The chart highlights a recent upward trend with a shaded area indicating a potential price range between $3,324.354 and $3,380.000, with key support and resistance levels marked. The timeframe spans from June 12 to July 3, 2025.

GOLD- at CUT n REVERSE Region? What's next??#GOLD - perfect drop after Iran Israel casefire and now market just reached at his current ultimate swing region.
That is around 3343 to 3346-47
Keep close that region and only hold buying positions above tha.
NOTE: we will go for cut n reverse belowt that in confirmation .
Good luck
Trade wisely

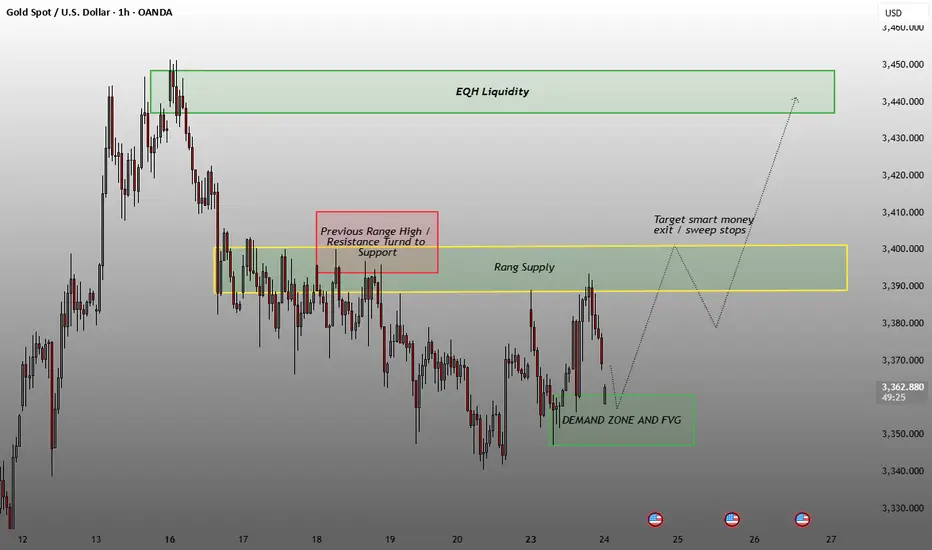
Demand Zone and FVG (Fair Value Gap) (Green Box at the bottom)This is identified as a potential buy zone where institutional demand may lie.
Price recently tapped into this zone, indicating a potential reversal or long entry area.
Rang Supply / Resistance Area (Yellow Box in the middle):
Previous range high that acted as resistance, and now may turn into support upon retest.
Labeled as "Previous Range High / Resistance Turned to Support".
EQH Liquidity (Equal High Liquidity) (Green Box at the top):
A liquidity pool where equal highs suggest buy-side liquidity.
Price is expected to move up to grab liquidity, targeting this zone.
📈 Market Structure:
Price made a higher low at the demand zone, suggesting potential bullish continuation.
Expected movement:
Bullish move from the demand zone.
Temporary reaction or rejection from the supply zone.
Final liquidity sweep toward EQH (Equal Highs) at the top.
🎯 Target & Strategy:
Target: 3,440–3,450 range — aligned with the EQH Liquidity zone.
Smart Money Exit: Noted near 3,400 — a zone where stop losses and liquidity might be collected.
Strategy Implication: Ideal for buy setups from the demand zone toward the EQH liquidity zone, with a potential scale-out near mid-supply.
Market Structure AnalysisMarket Structure Analysis
HH (Higher High) and HL (Higher Low) labels indicate the prior uptrend structure.
The recent price action shows consolidation and potential trend reversal or correction.
🟦
Highlighted Zones
Supply Zones (resistance): Marked in light teal rectangles near the top of price action (e.g., around 3,400).
Demand Zones (support): Marked below the current price (e.g., around 3,360 and lower near 3,320).
🔄
Ch0CH (Change of Character)
A “Ch0CH” label is marked — this typically signals a potential shift in market structure (e.g., from bullish to bearish).
This is further supported by the price breaking below a previous higher low.
📉
Trade Setup
Red Zone: Indicates the stop-loss region.
Green Zone: Indicates the take-profit target.
A short (sell) position is implied here, expecting price to drop from the current level to the lower demand zone.
🔁
Projected Price Path
A dotted white line projects a potential bearish move, with a minor retracement before continuation down to ~3,328.

Gold is in the bullish direction after correcting the supportHello Traders
In This Chart GOLD HOURLY Forex Forecast By FOREX PLANET
today Gold analysis 👆
🟢This Chart includes_ (GOLD market update)
🟢What is The Next Opportunity on GOLD Market
🟢how to Enter to the Valid Entry With Assurance Profit
This CHART is For Trader's that Want to Improve Their Technical Analysis Skills and Their Trading By Understanding How To Analyze The Market Using Multiple Timeframes and Understanding The Bigger Picture on the Charts

Gold bottoms out and tests resistance, long positions at night📰 Impact of news:
1. Bowman hinted at a July rate cut
2. Fed Governor Kugler and FOMC permanent voting member and New York Fed President Williams hosted the "Fed Listening" event.
📈 Market analysis:
Gold will maintain a short-term volatile trend. Although the United States intervenes in the conflict between Iran and Israel, the geopolitical situation will affect the market trend to a certain extent. However, the remarks of Federal Reserve Board member Bowman hinting at a rate cut in July have eased market volatility to a certain extent. Gold maintains a narrow range of fluctuations at the 4H level, and the technical pattern is gradually adjusted. The K-line stands firmly on the short-term moving average. The short-term trend shows that it is necessary to observe the second opportunity for pull-up after the confirmation of the retracement. At the hourly level, the short-term moving average diverges upward, and the short-term volatile and strong pattern is maintained. In the evening, pay attention to the upper resistance area of 3395-3405, focus on the suppression of the 3405 line, pay attention to 3375-3365 below, and further pay attention to the 3345 support line if it breaks through.
🏅 Trading strategies:
SELL 3385-3395-3405
TP 3370-3365-3345
BUY 3375-3365-3355
TP 3390-3400-3405
If you agree with this view, or have a better idea, please leave a message in the comment area. I look forward to hearing different voices.
TVC:GOLD FXOPEN:XAUUSD FOREXCOM:XAUUSD FX:XAUUSD OANDA:XAUUSD

XAUUSD:Sharing of the Latest Trading StrategyAll the trading signals today have resulted in profits!!! Check it!!!👉👉👉
Today's opening gapped up to 3396, then fell all the way back to 3347 before stabilizing and rallying to 3380—our long strategy at 3350 achieved perfect profits. The basic trend aligns with last week's pattern, dominated by pullback rebounds.
Channel Resistance: Key pressure lies at 3397–3404.
Support Zones: Monitor rebounds at 3360–3365 and 3355–3350; maintain a bullish bias on dips.
Trading Strategy:
buy@3350-3360
TP:3380-3400
Share accurate trading signals daily—transform your life starting now!
👇 👇 👇 Obtain signals👉👉👉

Conflict breaks out, risk aversion rises, can 3400 be broken?Bowman's dovish comments in the afternoon eased the market, by which time risk aversion was deepening as sudden geopolitical conflicts continued to deepen. Will the USA make a corresponding response to this matter? This series of events has once again put gold into a complicated situation. Can gold hit the 3,400 mark today?
Free trading strategies are updated daily🌐. All trading strategies released since this month have been verified and can serve as a good reference📈.👇 I sincerely hope that these strategies can be helpful to you👇.
OANDA:XAUUSD FX:XAUUSD FOREXCOM:XAUUSD FXOPEN:XAUUSD TVC:GOLD

Gold Market Analysis: Key Levels and Trends 23/June/2025 Core Themes
1. Geopolitical Drivers: Escalating tensions in the Middle East, particularly U.S. airstrikes on Iranian nuclear facilities, are fueling gold's "flight to safety" narrative. Analysts anticipate sustained demand for gold amid potential regional conflict.
2. Technical Bullish Bias: Gold is in an uptrend, respecting key support levels and forming higher lows within an ascending channel. Breakouts above resistance (e.g., $3,439–$3,501) could validate further gains.
3. Correction vs. Continuation: While short-term pullbacks are expected (e.g., testing $3,320–$3,200), the broader bullish structure suggests corrections are temporary.
---
Key Technical Levels
Support:
- Immediate: $3,320 (lower channel boundary)
- Deeper: $3,200 (critical level; break could extend corrections)
Resistance:
- Short-term: $3,378–$3,382 (upper channel boundary)
- Mid-term: $3,439 (previous resistance; target for bullish continuation)
- Long-term: $3,501 (potential next resistance; requires strong momentum)
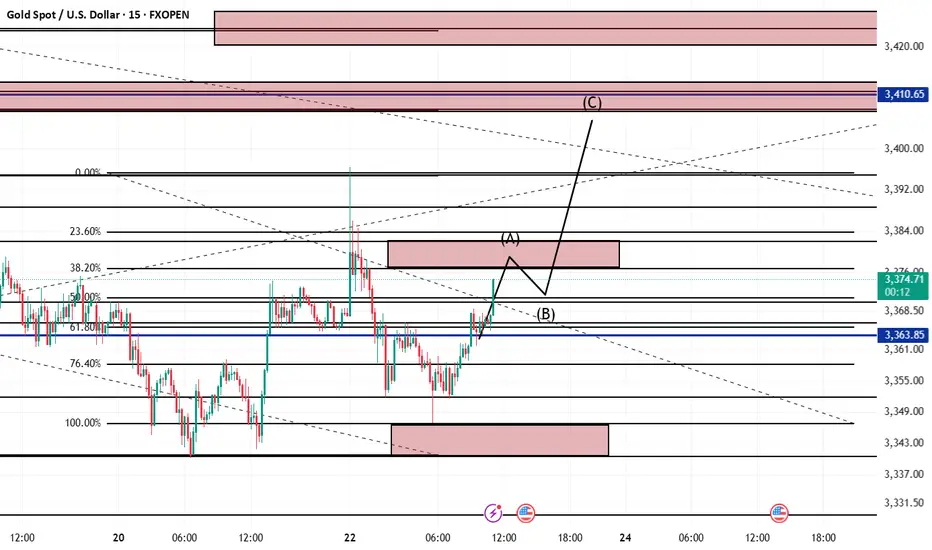
Fibonacci Retracements:
- 23.6%: $3,360–$3,370 (support zone for long entries)
- 50.0%: $3,400 (conservative take-profit target)
- 61.8%: $3,415 (key golden ratio level; likely Wave (5) peak)
- 100%: $3,435–$3,440 (aggressive target; upper channel line)
---
Trade Setups & Strategies
1. Long Entry:
- Target: $3,400–$3,435 (Fibonacci extensions)
- Stop-Loss: Below $3,315 (break of key support)
- Entry Zone: $3,360–$3,370 (near ascending channel support and 23.6% Fib)
2. Bullish Confirmation:
- Breakout Above $3,378: Validates continuation toward $3,439 and $3,501.
- Volume Increase: Confirms strength at key levels (e.g., $3,360–$3,370).
---
Risk Management & Key Risks
- Stop-Loss Placement:
- Longs: Below $3,315 (protects against deeper corrections).
- Shorts: Above $3,350 (avoids false breakouts).
- Volatility: Monitor geopolitical developments (e.g., U.S.-Iran escalation) that could trigger rapid price swings.
- Correction Risks: If gold fails to hold $3,320, a drop to $3,200 may occur, requiring tighter stops.
---
Fundamental Outlook
- Safe-Haven Demand: Rising tensions are likely to sustain gold's appeal.
- Inflation & Rate Outlook: Persistent inflation concerns and potential rate cuts (if economic data weakens) could further support gold.
- Negotiation Risk: De-escalation or Iran's concessions may pause the bullish momentum, leading to a reversal toward $3,340–$3,320.
---
Conclusion
Gold is in a strong bullish phase, driven by geopolitical risks and technical structure. Traders should focus on buying dips near $3,320–$3,370 with targets toward $3,439–$3,501. However, monitor the $3,320 support and geopolitical developments closely. If the trend breaks, a retest of $3,200 could follow. Always use stop-losses to manage risk.
Final Note: The market is highly volatile, so position sizing and risk management are critical. Stay alert for news updates and technical confirmations (e.g., closes above $3,378)

XAUUSD Analysis todayHello traders, this is a complete multiple timeframe analysis of this pair. We see could find significant trading opportunities as per analysis upon price action confirmation we may take this trade. Smash the like button if you find value in this analysis and drop a comment if you have any questions or let me know which pair to cover in my next analysis.

Gold Strongly Builds a Bottom to Test ResistanceDespite the U.S. air strikes on three Iranian nuclear facilities intensifying geopolitical tensions on Monday, the U.S. dollar stabilized at high levels supported by hawkish expectations of the Federal Reserve, restricting gold bulls. Although geopolitical risks should theoretically boost gold's safe-haven demand, the market showed relative caution, partly due to recent hawkish remarks from Fed officials. While the dot plot implies two possible rate cuts this year, only one rate cut is expected for 2026 and 2027 respectively, a prospect that limits gold's upside potential.
The market is currently focused on the upcoming release of U.S. June PMI data, which will serve as a key barometer for the economic outlook. If the data comes in strong, it will further strengthen the long-dollar stance, and gold may continue to be under pressure. Conversely, if the PMI falls short of expectations, gold is expected to gain short-term support. Gold opened gap-up today but then trended lower, stabilizing and rebounding after touching $3,346, and once again hovering around the high of $3,388. The market outlook still focuses on high-level adjustments.
you are currently struggling with losses,or are unsure which of the numerous trading strategies to follow,You have the option to join our VIP program. I will assist you and provide you with accurate trading signals, enabling you to navigate the financial markets with greater confidence and potentially achieve optimal trading results.
Trading Strategy:
buy@3350-3360
TP:3380-3390

GBPUSD Trading Strategy for the WeekGBPUSD is reacting at the support zone of 1.34000. This is the last important support zone that the pair is facing. If this support zone is broken, the pair will enter a prolonged Downtrend phase. 1.325 could be the target for this decline.
If the 1.34000 zone is pushed up by buyers, the pair will touch the 1.35000 border zone. If this zone is broken, the pair will form a double bottom pattern and continue to increase back to the peak of last week around 1.36000. In case the buying force is not strong enough to break 1.35000, the pair will return to the sideway in the rectangular border.
Support: 1.32500
Resistance: 1.36000
Break out: 1.34000-1.35000
Recommended good trading strategy:
Trade when price confirms in Break out zone.
BUY 1.32600-1.32400 Stoploss 1.32000
SELL 1.35900-1.36100 Stoploss 1.36400

Gold price PMI positive, slight increase⭐️GOLDEN INFORMATION:
Gold prices (XAU/USD) edge higher toward $3,375 in early Asian trading on Monday, driven by heightened geopolitical tensions following US President Donald Trump’s decision to intervene militarily in the Israel-Iran conflict. The move significantly escalates the situation in the Middle East, fueling demand for safe-haven assets like gold.
The US launched airstrikes on three Iranian nuclear facilities early Sunday, marking a direct entry into the conflict despite Trump’s prior pledges to avoid new overseas wars. The intensifying turmoil has sparked a wave of risk aversion, supporting bullion prices amid rising uncertainty. Meanwhile, investors will closely monitor the preliminary S&P Global US Purchasing Managers’ Index (PMI) for June, due later in the day, for further market direction.
⭐️Personal comments NOVA:
Gold prices continue to be supported around the 3340 mark, positive with today's US PMI news data
⭐️SET UP GOLD PRICE:
🔥SELL GOLD zone: 3380- 3382 SL 3387
TP1: $3370
TP2: $3360
TP3: $3350
🔥BUY GOLD zone: $3318-$3316 SL $3311
TP1: $3326
TP2: $3338
TP3: $3349
⭐️Technical analysis:
Based on technical indicators EMA 34, EMA89 and support resistance areas to set up a reasonable BUY order.
⭐️NOTE:
Note: Nova wishes traders to manage their capital well
- take the number of lots that match your capital
- Takeprofit equal to 4-6% of capital account
- Stoplose equal to 2-3% of capital account

Gold Spot / U.S. Dollar (XAUUSD) 2-Hour Chart2-hour candlestick chart displays the price movement of Gold Spot (XAUUSD) against the U.S. Dollar, with the current price at 3,373.97, reflecting a +5.99 (+0.18%) change. The chart highlights recent price trends, including a notable upward movement, with key support and resistance levels marked around 3,366.81 and 3,410.25, respectively. The time frame spans from approximately 6:00 AM to 3:35 PM CEST on June 23, 2025.

GOLD Analysis 23/6/2025Based on gold analysis using digital analysis, gold is rising to target the 3377-3387 zone,
then rebound and then target the 3410-3426 zone .
Short gold, gold still has at least one chance to pullback!At present, gold has rebounded to the 3370-3380 area again, which largely confirms that 3350-3340 is the bottom area at this stage. However, what we still cannot underestimate is that even with the support of safe-haven, gold has still failed to effectively break through the resistance of 3385-3395-3405 area, and even fell under pressure several times. To a certain extent, it weakened the willingness and confidence of bulls, so it aggravated the trend of wide fluctuations in the short term. During this period, we must pay attention to the rhythm change of gold.
According to the current bullish strength of gold, I think gold does not have the conditions to directly break through the heavy resistance of 3385-3395-3405 area for the time being, so gold still needs at least one retracement expectation, so I think we can still try to short gold in the 3375-3385 area, but the retracement expectation should not be too large, 3365-3355 is enough!

Gold opens high and moves lower, focus on 3340 support📰 Impact of news:
1. Federal Reserve Board member Bowman speaks on monetary policy and the banking industry
2. The United States intervenes in the Iran-Israel conflict and pays attention to the geopolitical situation
📈 Market analysis:
In the early Asian session, gold prices surged but failed to break through the key watershed of 3405. The current risk aversion conflict failed to break through the key resistance level, so the short-term trend is still weak and bearish. On the hourly chart, gold continues to retreat. As the current short-selling momentum continues to gain momentum, we will first look at whether the double bottom support of 3340 is effective. If it fails to break through while retreating, we can consider a short-term upward rebound in the support and consider going long. Looking at the second decline point at 3370-3375, unless the news stimulates the gold trend, you can still consider placing short orders if it touches the 3370-3380 line! On the whole, pay attention to the resistance line of 3370-3380 above and the support line of 3345-3335 below.
🏅 Trading strategies:
BUY 3350-3345-3335
TP 3360-3370-3380
SELL 3370-3380
TP 3360-3350-3345
If you agree with this view, or have a better idea, please leave a message in the comment area. I look forward to hearing different voices.
OANDA:XAUUSD FX:XAUUSD FOREXCOM:XAUUSD FXOPEN:XAUUSD TVC:GOLD

Trade Idea: Long XAUUSD (BUY STOP)1️⃣ Multi-Timeframe Structure
• 1 Hour (Macro):
• Trend: Bullish. 20 SMA is riding above the 50 SMA .
• Price has broken above the prior resistance at 3374.50 and is now retesting it as support.
• 15 Minute (Tactical):
• After a clear push down into 3340.37, price rallied back above 3374.50.
• SMAs have flipped back bullish, and volume during the retest shows absorption of selling pressure.
• 3 Minute (Entry Precision):
• Micro-green candle wicks show a small scratch of buyers stepping in just above 3374.50.
• Momentum is picking up to the upside, but we want confirmation of strength before committing.
⸻
2️⃣ Trade Execution
▶️ Entry: Buy Stop at 3379.50
• Wait for a clean 3 m/15 m push above the short-term swing high (~3379) to confirm buyers are in control.
✂️ Stop Loss: 3374.50
• Just below the broken resistance-turned-support level.
• True structural invalidation of this bullish thesis.
🎯 Take Profit: 3394.50
• Targets the next logical resistance cluster (round number area and prior swing highs) for ~15 pt gain.
Risk-Reward ≈ 1:3 (SL = 5 pts, TP = 15 pts)
⸻
3️⃣ Invalidation & Expiry
❌ Cancel the pending Buy Stop at 3379.50 if either:
1. A full 15 m candle closes below 3374.50 before entry.
2. It’s not triggered by 8:30 AM PST.

Gold Spot Price Trend Analysispresents a detailed analysis of the gold spot price trend against the U.S. dollar, captured over a four-hour interval. The chart displays a fluctuating pattern, with prices ranging from approximately $3,320 to $3,383.74 USD. A notable decline is observed, marked by a red box indicating a support level at $3,332.53, while a green box suggests a resistance level at $3,383.74. The current price stands at $3,353.94, with a slight decrease of 0.42%. The chart provides valuable insights for investors and traders seeking to understand the dynamics of the gold market.

XAUUSD and USOILHesitation Geopolitical factors have led to the escalation of relations between several countries. The Middle East is in chaos. Although this is a trading market, the relationship between the two is too close. This is why the Asian market XAUUSD reached a high of 3400.
But it is not stable. Because after the news that stimulated the rise in gold prices over the weekend, there were some negative news. For example, peace talks, time differences, negotiations and other factors have eased the tense atmosphere. Then the gold price fell with the trend, reaching a low of 3347.
From the overall situation, the market still has the momentum to rise in the short term. But this depends on Iran's response. Including the impact of the Strait of Hormuz. This is the key factor in the rise or fall of oil prices. Investors with larger funds can arrange long orders in advance.
The view on XAUUSD is to buy at low levels. The impact of geopolitics is too huge. On the basis of interest rate cuts, buying is the key to profit. But everyone's financial situation is different, so when trading, remember to control the position ratio. Prevent trading errors from leading to account liquidation.
