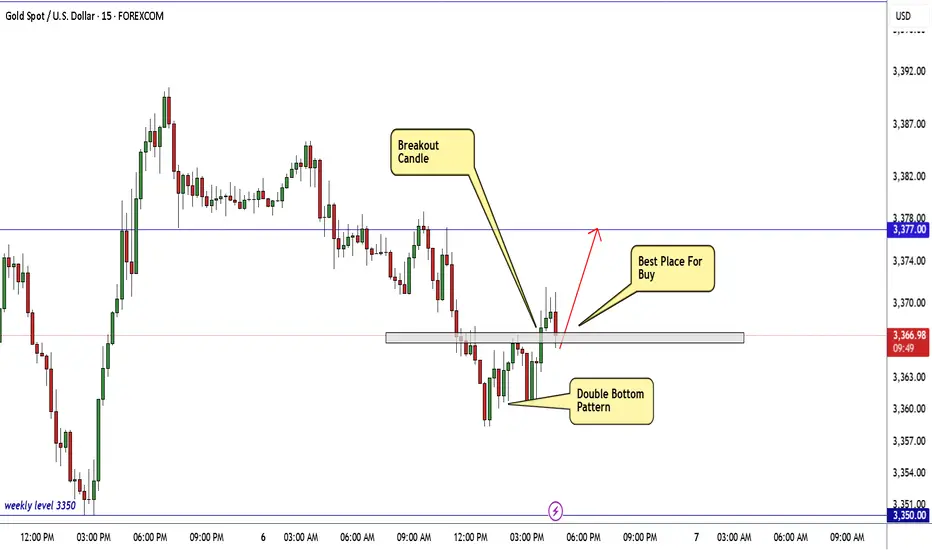
GOLD Ready To Go Up From Current Price , 150 Pips WaitingHere is My 15 Mins Gold Chart , and here is my opinion , we finally above 3365.00 and we have a 30 Mins Candle closure above it And Perfect Breakout , so we have a good confirmation now to can buy it and we can targeting 100 to 150 pips .
Reasons To Enter :
1- New Support Created .
2- Bullish Price Action .
3- Bigger T.F Giving Good Bullish P.A .
4- Clean Breakout .
5- Reversal Pattern .
Xauusdbuy
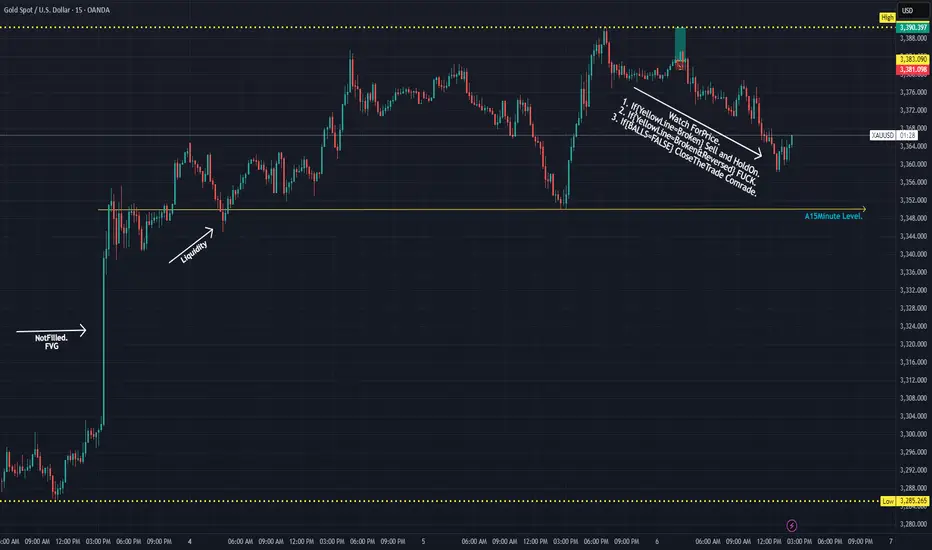
GOLD 15MInute PLan. Enjoy..So the Image is Simple as it is.
Currently @15$ gonna keep trading it.
Started @10$ Last Night.
8/6: Watch for a Potential Double Top FormationGood morning, everyone!
Yesterday, gold experienced its first significant supply pressure around the 3386 level, but with support near 3350—helped by positive data—prices rebounded and climbed back toward 3390, resulting in solid overall gains.
From the 1-day chart (1D) perspective, the technical structure remains bullish, with MA20 providing firm support. Although short-term moving averages are currently converging, the overall bias remains towards a bullish divergence, suggesting further upside potential. There's a possibility for price to test the 3400–3420 zone in today’s session.
That said, the 3386–3398 region may still pose minor selling pressure, although it is not expected to be particularly strong. Key intraday support is seen in the 3378/3372–3362 range. If the market encounters another wave of heavy selling that damages the daily bullish setup, then the 3343–3348 area will become a critical battleground between bulls and bears.
📌 Trading Strategy for Today:
Maintain a sell-on-strength approach, especially if prices approach the 3418–3438 resistance area, where short opportunities become more attractive;
If a pullback occurs, monitor the aforementioned support zones for potential buy-on-dip opportunities, contingent on stability.
⚠️ Market Risk Reminder:
There will be key economic speeches during the US session, which could trigger heightened volatility. Ensure proper risk management and stop-loss settings are in place.

Correction first and then rise during the day, TP3400Yesterday, gold hit the bottom near 3350 and then quickly rose to break the high. It fell back slightly in the evening and closed with volatility. The daily line closed with a long lower shadow bullish line. The short-term correction process has been completed, and there is still momentum for an upward impact. The overall structure is still a bullish trend. Focus on 3365-3355 below. As long as the bullish thinking above this level remains unchanged, any decline will provide an opportunity to enter the market. The target can be around yesterday's high of 3390. Once it breaks through 3390, the gold price is expected to reach 3405-3415.
OANDA:XAUUSD

Gold: Yesterday’s Surge & Today’s Session StrategyDuring yesterday’s U.S. trading session, gold surged to around 3390 🚀, driven by a series of tariff-related remarks from Trump, Fed personnel changes, and market expectations that the probability of a September rate cut has risen to 91% ⚡️. We successfully took profit near 3355 yesterday, locking in close to maximum gains 💰.
Today’s trading strategy:
Go short at highs during the Asian session 📉
Go long at lows during the European session 📈
Go short at highs again during the U.S. session 📉
⚡️⚡️⚡️ XAUUSD ⚡️⚡️⚡️
🚀 Sell@ 3390 - 3380
🚀 TP 3375 - 3366 - 3356
Daily updates bring you precise trading signals 📊 When you hit a snag in trading, these signals stand as your trustworthy compass 🧭 Don’t hesitate to take a look—sincerely hoping they’ll be a huge help to you 🌟 👇
XAUUSD The beginning of large-scale growthCurrent picture and structure
The instrument is trading in a narrow range of $3,360-3,375, demonstrating low volatility - ADX is at the low of 2025, which confirms consolidation
The price is held inside a long-term ascending channel, with an increase of about 27% since the beginning of 2024
Indicators and signals
RSI (14): around 58-59, indicates moderate overbought, but remains in the bullish momentum zone
Stochastic (%K ~61%) and MACD (value ~3.8): Buy signals - short-term upward momentum is confirmed
ADX (14): around 23-24 - range, weak trend without a clear direction
Moving averages on different timeframes give a common signal indicator "Strong Buy" in daily and weekly frames
Support and resistance levels
Key support:
$3,360 — current lower stop range
$3,330–3,293 — swing low zone, critical for short-term sales
Main resistance:
$3,400–3,415 — profit acceptance zone and possible reversal pressure
$3,450 — psychological and technical barrier upon breakout of current zone
GOLD RAID ON – Bullish Limit Orders Are LIVE! XAU/USD💰GOLD HEIST IN PROGRESS! XAU/USD BULLISH RAID BEGINS! 🏴☠️📈
Asset: XAU/USD – Gold vs U.S Dollar
📊 Plan: BULLISH ROBBERY
🎯 Target: 3460.00
🛑 Stop Loss: 3330.00
📥 Entry: ANY level – vault is wide open!
👑 THIEF MODE ACTIVATED – Time to raid GOLD like a pro. We’re stacking multiple limit orders (layering entries) just like setting traps for those greedy bears 🐻💥
🚪💼 Entry strategy:
“The vault is unlocked – grab your bag and go!”
Place buy limits at recent swing lows (15m/30m) or jump in live with your bullish crew. Use alerts to catch price at key pullback zones.
🛑 SL placed at: 3330 – Just below thief territory. Adjust based on your lot size + number of entries 🔐
🎯 Target: 3460 – Hit and run, or trail that SL and let the gold rain! ☔💸
🧠 Thief Tactics for GOLD:
Only trade Long-side – scalpers, swing traders, all aboard 🚂
Use trailing SL to protect your loot
Avoid trading during high-impact news (CPI, NFP, Fed, etc) ⚠️
Stay alert for manipulations + fake-outs at key levels – it's a trap game out here 🎭
📰 Before the Heist:
🧾 Read Fundamentals • COT Report • Sentiment • Macro Outlook
📌 Always stay updated, news can flip the market faster than a backstab 🗡️
🗣️ Boost this idea if you’re robbing with us!
💥 Smash that LIKE if you believe in the heist
🚨 Follow for more high-voltage thief trades
💎 Daily playbooks. Clean getaways. All signals, no noise.
Join the crew. Trade like a THIEF. Get rich or get smarter.
🕵️♂️💰🚀🔥🐱👤📈

GOLD Breakout Done , Long Setup Valid To Get 150 Pips !Here is My 15 Mins Gold Chart , and here is my opinion , we finally above 3350.00 and we have a 30 Mins Candle closure above it And Perfect Breakout , so i`m waiting the price to go back and retest this res and new support and give me a good bullish price action to can enter a buy trade and we can targeting 100 to 150 pips .
Reasons To Enter :
1- New Support Created .
2- Bullish Price Action .
3- Bigger T.F Giving Good Bullish P.A .
4- Clean Breakout .

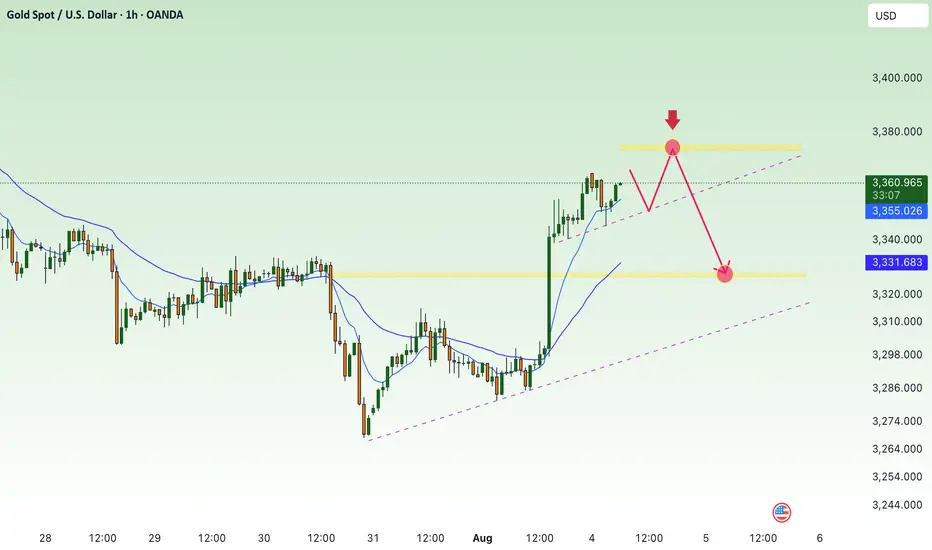
Gold Technical Analysis - Bullish Momentum or Pullback Ahead?Gold (XAU/USD) is trading around $3,371, showing a bullish bias within an ascending channel. Price is consolidating below key resistance at $3,384, and a breakout above this level could lead to a rally toward $3,400–$3,429. On the downside, support lies at $3,340 and $3,312; a break below these could trigger a deeper pullback toward $3,268. The trend remains bullish above $3,340, with buy interest expected on dips, while a confirmed breakdown below $3,268 would shift momentum in favor of bears.
🔑 Key Levels to Watch:
- Resistance: $3,384 → $3,396 → $3,429
- Support: $3,360 → $3,340 → $3,320
📈 Potential Scenarios:
- Bullish: If gold holds above $3,340 and breaks above $3,384, it may rally toward $3,400–$3,429, with potential to reach $3,450+. This keeps the uptrend intact.
- Bearish: If rejected from $3,384, gold could dip to $3,340–$3,312 for a healthy correction before possibly bouncing again. Trend remains bullish unless lower supports break.
📊 Trend Outlook:
- Short-Term Trend: Bullish while inside or above the rising channel
- Medium-Term Trend: Neutral to Bullish; watch for breakout confirmation above $3,384
- Momentum: Consolidating, with potential for a breakout after current sideways structure
Note
Please risk management in trading is a Key so use your money accordingly. If you like the idea then please like and boost. Thank you and Good Luck!

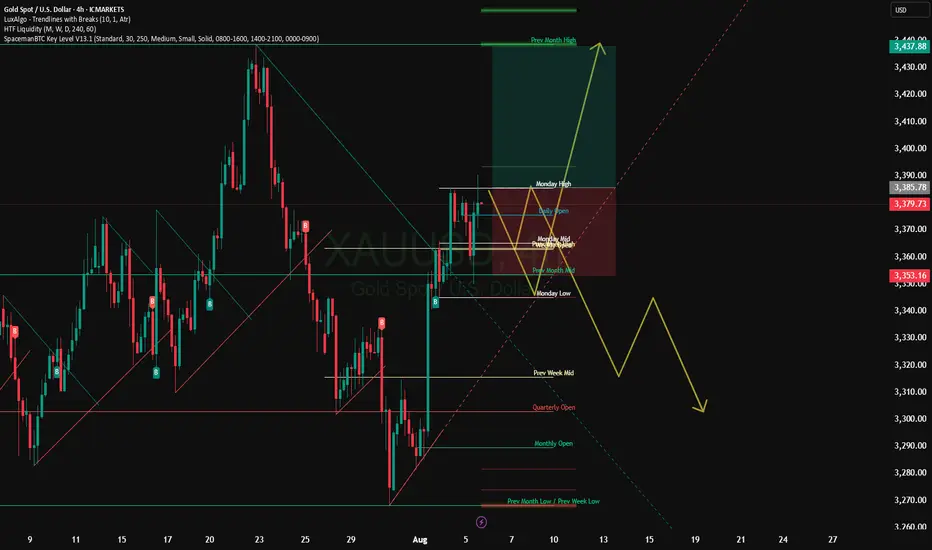
Wait for a pullback and then test the previous high#XAUUSD
The gold market closed positively on the daily chart, with strong support near 3345-3340 below. The market trend is still dominated by bulls,🐂 but the daily moving average support is too far from the high point. It is not ruled out that it may retreat to the moving average support near 3345-3340,📊 and then rise again.🚀
From the monthly chart, 🌙although the monthly chart closed positive, the market is generally converging at a high level. Upper resistance remains, and a breakout is unlikely without breaking through this resistance level (no further discussion will be given).📉
Judging from the weekly chart, the Bollinger Bands have shrunk, and the MACD indicator has formed a death cross with large volume, indicating weak fluctuations at the weekly level.😩
Judging from the daily chart, 📊the current technical indicators are tending to the zero axis, and the rapid upward correction of the smart indicator indicates that the price fluctuation tends to rebound. The current focus is on yesterday's high around 3385. It is expected to break through 3430. The lower support Bollinger band middle track and moving average tend to stick together around 3346-3340.🌈
Judging from the hourly chart and 4H chart, 📊the overall rhythm tends to fluctuate and fall. The short-term pressure from above is around 3375-3385, and a break above will definitely lead to an increase.📈
On the whole, pay attention to yesterday's NY starting point near 3365-3360, and the strong support below is 3346-3340. The hourly and 4H charts tend to fluctuate and fall, so for short-term trading we need to short on rallies. 📉
Intraday trading suggestions are as follows:
1. Consider going long currently around 3365-3360📈, targeting 3374-3380🎯. If it breaks through, look for 3400.
2. Go long if it retraces below 3355-3340, targeting 3375-3385. Wait for further adjustments.🐂
3. If the price first reaches the resistance level of 3375-3385 and holds, consider going short with a small position and anticipate a pullback towards 3365-3355.🐻
XAUUSD Critical movement !!!The 3351 4h frame was so critical as I said and showed the movement will make the decision.
Flying now with
tp : 3385
tp:3400
tp : 3413
Better wait for another confirmation on the breaker block 3370 closing above it with green candle . push the price higher as showed

8/5: Watch for Short Opportunities Near 3400Good morning, everyone!
On Wednesday, gold held above the key support area at 3343–3337, and subsequently broke through the 3372–3378 resistance zone, leading to a strong bullish move and solid long-side gains.
Today, attention should shift to the major resistance around 3400. If bullish momentum continues, price may approach the secondary resistance near 3420. However, from a technical perspective, signs of bearish divergence have begun to emerge. Should price continue rising while momentum weakens, the risk of a short-term correction increases accordingly.
Key levels to monitor:
Primary resistance zone: 3404–3416
Intermediate supply area: around 3398
Crucial support zone: 3372–3363 (a hold here could support further upside)
⚠️ Cautionary Note:
The US PMI data release during the New York session could introduce volatility. Be sure to maintain strict risk management and stop-loss discipline during periods of increased uncertainty.
🔁 Trading Bias for Today:
Prefer selling into strength near resistance, while cautiously considering buying on dips near support.
The 3343–3337 area continues to serve as the primary support zone, and price action around this level will be critical in determining the next directional move

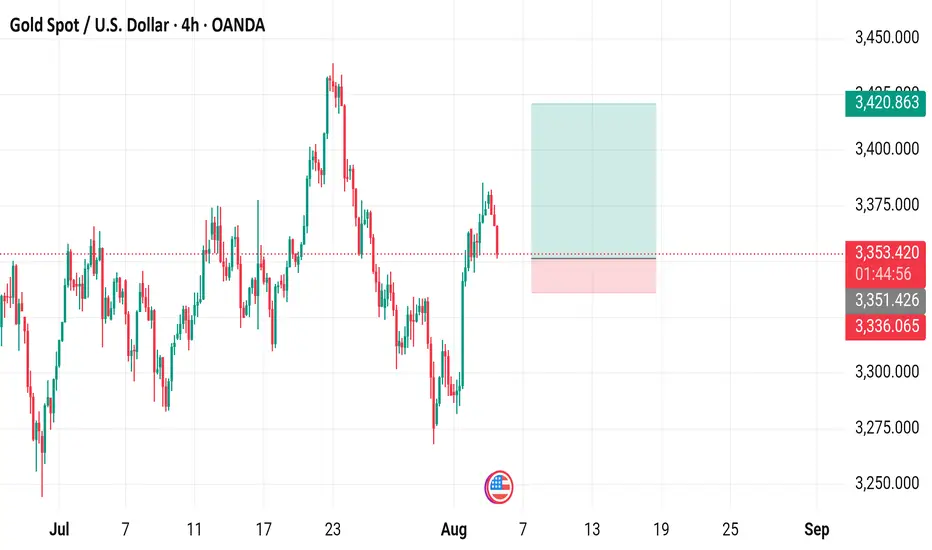
Gold Spot / U.S. Dollar (XAU/USD) - 4 Hour Chart (OANDA)4-hour chart from OANDA shows the recent price movement of Gold Spot (XAU/USD), currently at $3,353.240, down $20.395 (-0.60%). The chart highlights a sell price of $3,353.010 and a buy price of $3,353.450, with a shaded area indicating a support/resistance zone around $3,351.426 to $3,353.240. The data reflects trading activity from July to early September 2025.
XAUUSD Intraday Signal Analysis – Gold Price Momentum & RSI SetuIn today’s 1-hour chart of XAUUSD (Gold vs USD), we observe a strong upward momentum supported by technical indicators, suggesting a well-defined bullish trend in the short term. Traders looking to capture short-term profits may find this chart setup especially favorable. Here's a breakdown of the price action and what it could mean for intraday traders.
Price Action Overview
The price of gold has surged past the $3,320 mark, showing a clear bullish breakout with a series of higher highs and higher lows. Currently, the market is trading near the $3,378 level, consolidating slightly after a strong upward movement.
The SMA 9 (Simple Moving Average) is providing dynamic support, curving upward and closely hugging the candlesticks. This is typically a sign that buyers are actively pushing the price higher and dips are being bought up quickly.
Additionally, the spread between the Buy ($3,378.78) and Sell ($3,378.51) prices is extremely narrow, suggesting tight liquidity and fast execution potential — ideal conditions for scalpers and short-term traders.
RSI Analysis
The RSI (Relative Strength Index) 14 is hovering around the 68–70 level, which traditionally indicates the asset is approaching overbought territory. However, it hasn’t crossed into the 70+ danger zone yet, which implies there could still be room for further upside.
One key observation is the RSI divergence forming on the right-hand side. While price has been climbing steadily, RSI has started to curve down slightly — this could hint at a minor pullback or consolidation phase before the next big move. Smart traders may consider watching for bullish RSI bounces or hidden divergences before re-entering long trades.
Trade Idea
Trend: Bullish
Support: $3,360 / $3,340
Resistance: $3,400 / $3,420
Signal: Wait for a minor pullback toward the SMA, and look for bullish candlestick confirmation near $3,360 before entering long.
Conclusion
This XAUUSD 1H chart presents a strong case for continued bullish momentum with cautious optimism due to RSI nearing overbought levels. A pullback could offer fresh entry opportunities before a push toward the next resistance zone. Intraday traders and swing traders alike can benefit from closely monitoring price action around the SMA 9 line.

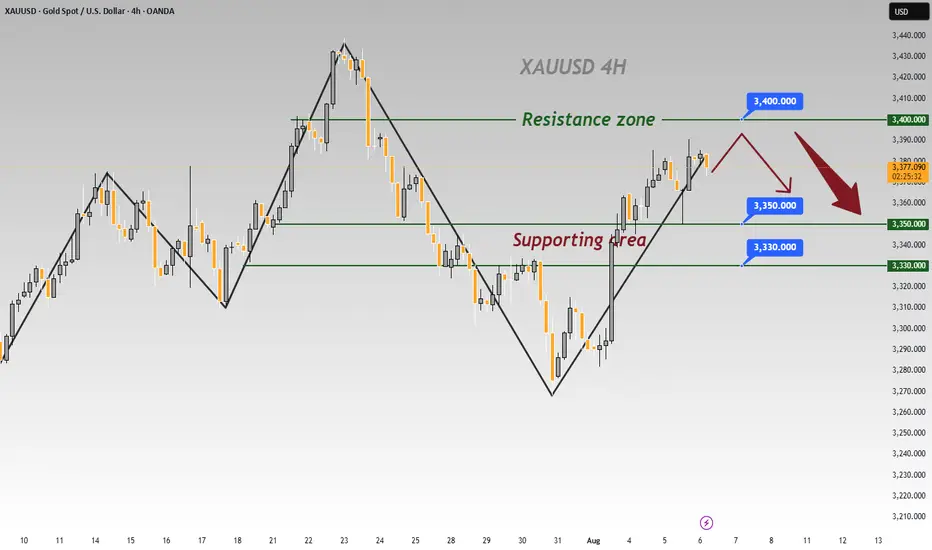
Gold Spot / U.S. Dollar (XAUUSD) 4-Hour Chart - OANDA4-hour performance of the Gold Spot price against the U.S. Dollar (XAUUSD) from late July to early August 2025. The current price is 3,362.895, reflecting a +72.775 (+2.21%) increase. Key levels include a sell price of 3,362.200 and a buy price of 3,363.590. The chart highlights a recent upward trend with a notable resistance zone around 3,395.716 and a support level near 3,336.129, as indicated by the shaded areas.

XAUUSD:BUYThere is no need to worry about holding long orders mentioned last Friday. Gold prices continued to rise this week after a pullback. The price has risen to 3372. According to the research team of our swing trading analysis team, the bullish trend will continue.
Earlier I informed members that some buy orders were closed at high levels. At that time, the short-term high was around 3370. After closing the long orders, the price subsequently fell. This is the advantage of swing trading. You can use accurate trading signals to trade in batches in the short term, thereby creating opportunities for quick profits.
After the pullback, there is still good room for buying and opportunities.

8/4: Watch Support at 3343–3337 and Resistance at 3372–3378Good morning, everyone!
Last Friday, gold rallied strongly, driven by a combination of favorable economic data and bullish technical signals, decisively breaking above the 3337–3343 resistance zone. During the subsequent pullback, price action remained firm above 3337, followed by a secondary upward move.
From a technical standpoint, the structure suggests the potential for continued upward consolidation, with the possibility of filling the gap near 3396. However, significant resistance remains between 3372 and 3378 — failure to break through this zone decisively may result in a short-term pullback before further gains.
Key levels to watch:
Initial support: 3348 and 3337–3343 zone
Major support: 3312–3300 zone (a break below could signal deeper downside risk)
Trading Strategy:
Focus on intraday setups around these critical areas. Look for buy opportunities on dips as long as support holds, while remaining cautious of sharp pullbacks near strong resistance.

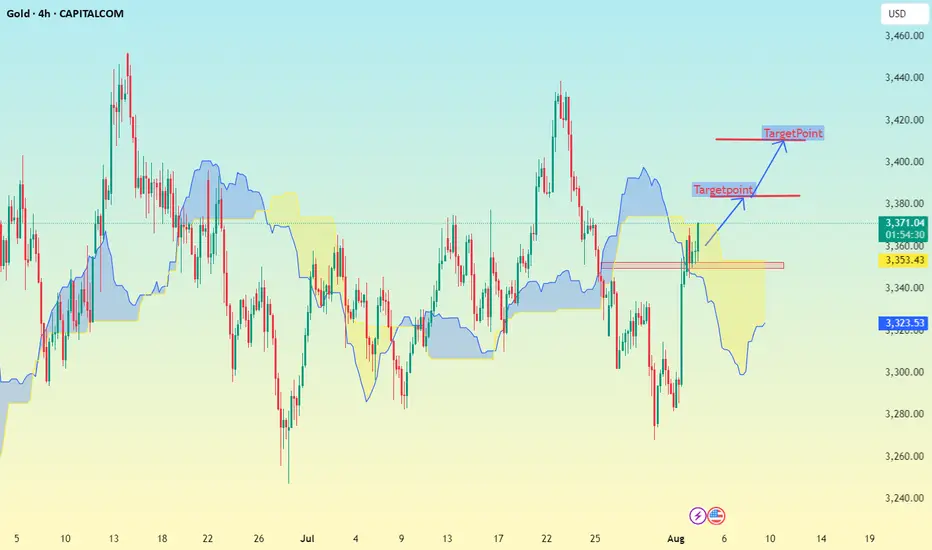
Gold 4H timeframe Based on the chart my shared (Gold 4H timeframe with Ichimoku cloud), here are the identified target points:
📈 Upside Targets:
1. First Target: 3380
This is marked just above the Ichimoku cloud breakout.
It is a short-term resistance zone.
2. Second Target: 3420
This is the higher target zone indicated in the chart.
It aligns with a previous high and potential resistance area.
---
🟡 Key Support:
Support Zone: Around 3322 – 3353
Price needs to hold above this zone to maintain the bullish momentum.
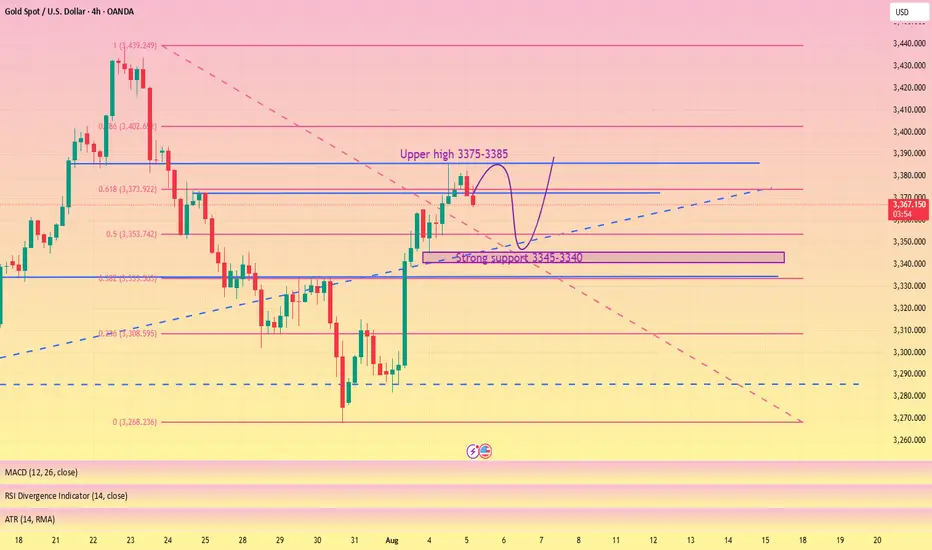
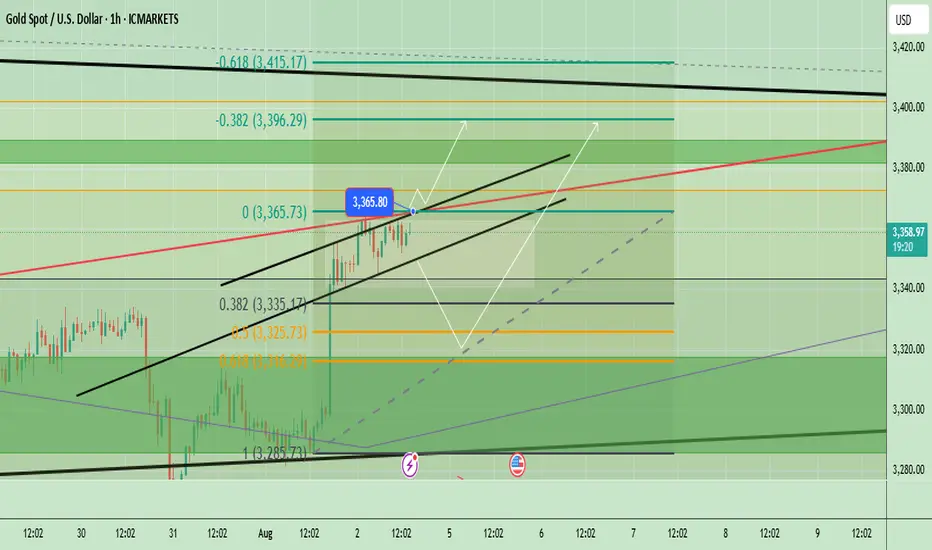
Gold Technical Analysis - Testing Key ResistanceGold has been showing a short-term bullish momentum after bouncing from the 3285 support zone, forming an ascending channel visible on the chart. The price is currently trading near 3361, close to the upper boundary of the channel and a key horizontal resistance level at 3365–3370. If the bullish momentum continues and price breaks above 3365–3370, we could see further upside toward 3396 and potentially 3400+. However, a failure to hold above this level could trigger a short-term retracement toward 3335–3325 support.
📈 Potential Scenarios:
- Bullish: If price sustains above $3,365, we could see an upside push toward $3,396 and possibly higher to $3,410 resistance.
- Bearish: A rejection near the channel top or $3,365 may lead to a pullback toward $3,325 (Fib 0.5) and then $3,285 support.
🔑 Key levels to watch:
- Upside: $3,365 → $3,396 → $3,410
- Downside: $3,335 → $3,325 → $3,285
- Trend Bias: Short-term bullish as long as price stays above 3325
Note
Please risk management in trading is a Key so use your money accordingly. If you like the idea then please like and boost. Thank you and Good Luck!
gold on sell reverse#XAUUSD on price reverse, base on the double rejection between 3345-3357. We await for breakout below 3351.6 before selling.
Entry 3351.6, target 3340-3315, SL 3361.
Above 3367 on 2 times breakout holds bullish till 3377 which have sell reject to fall below 3360-3350.

Maintain the bullish theme and go long on pullbacks#XAUUSD
Gold fell to a low of around 3345 during the day and then rebounded rapidly. It is currently repeatedly testing the 3355-3353 line.👨💻
Although Federal Reserve Chairman Powell has not given clear instructions, the market is generally optimistic about the September interest rate cut. 📈The bullish sentiment in the market still exists, and the moving average continues to spread upward, laying a solid foundation for market bulls🐂
If gold cannot effectively fall below 3355-3353 during the European session, then gold is expected to rise again during the NY session. First, if the gold price breaks through the intraday short-term high of 3365,🚀 the gold price may reach a rebound of 61.8%, which is around 3373. 🎯
If the European session hits the resistance level of 3365 and is rejected,🙅♂️ it may trigger a small pullback to 3345-3340 to provide long trading opportunities.🐂 Once it falls below 3340, 🐻it is necessary to stop loss in time and pay attention to the first-line defense situation of 3333

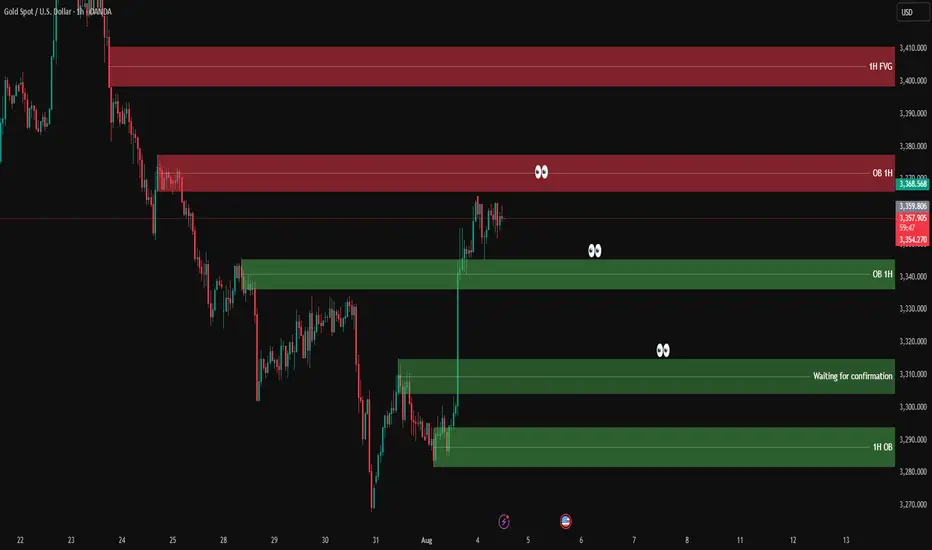
XAUUSD analysis - 1H FVG and OB setupsOn the 1H chart, price has made a sharp bullish move from the lower 1H OB zone (3,275 – 3,285) and is now hovering just below the 1H supply zone.
🔴 1H Supply Zone (OB):
3,354 – 3,368 → Price is consolidating here with no strong rejection yet.
🟢 1H Demand Zone (OB):
3,337 – 3,344 → First area to watch for potential bullish reaction.
👁 Mid-level support zone (waiting for confirmation):
3,310 – 3,320 → If price pulls back here and gives confirmation on lower timeframe, we’ll look for long setups.
📌 Trade scenarios:
1️⃣ Bullish: Wait for a retracement into 3,310 – 3,320, and if confirmed on LTF (3M–5M), go long.
2️⃣ If price drops deeper into the lower OB zone 3,275 – 3,285 and gives strong bullish reaction → potential long setup again.
3️⃣ Bearish: If price rejects the current OB zone (3,354 – 3,368) with confirmation → short entry targeting the green zones below (~3,320 or 3,310).
✅ Entry only after confirmation on lower timeframe
❌ No confirmation = no trade
Bulls continue to be active following NFP data⭐️GOLDEN INFORMATION:
Gold (XAU/USD) slips toward $3,360 in early Asian trading on Monday, snapping a two-day winning streak. However, disappointing U.S. job data and lingering tariff concerns could pressure the U.S. Dollar and help cushion the downside for the Dollar-denominated metal.
The yellow metal is under pressure from a recovering Greenback, though gains may remain capped as weaker-than-expected Nonfarm Payrolls (NFP) data has strengthened expectations of a Federal Reserve rate cut in the near term.
⭐️Personal comments NOVA:
Buyers maintained early in the week, continuing to move towards higher resistances: 3374, 3387
⭐️SET UP GOLD PRICE:
🔥SELL GOLD zone: 3374- 3376 SL 3381
TP1: $3365
TP2: $3350
TP3: $3333
🔥BUY GOLD zone: $3328-$3326 SL $3321
TP1: $3335
TP2: $3348
TP3: $3360
⭐️Technical analysis:
Based on technical indicators EMA 34, EMA89 and support resistance areas to set up a reasonable BUY order.
⭐️NOTE:
Note: Nova wishes traders to manage their capital well
- take the number of lots that match your capital
- Takeprofit equal to 4-6% of capital account
- Stoplose equal to 2-3% of capital account