Gold (XAU/USD) - 2H Wave Setup + Scalp Opportunities# 🔻 Gold (XAU/USD) - 2H Wave Setup + Scalp Opportunities Ahead
**By: Mohsen Mozaffarinezhad**
📅 August 7, 2025 | ⏰ Valid through August 8 (End of NY Session)
⏱ Timeframe: 2H
📌 Method: Elliott Wave + Supply/Demand + SSL Hybrid Confirmation
---
## 🧠 Market Context:
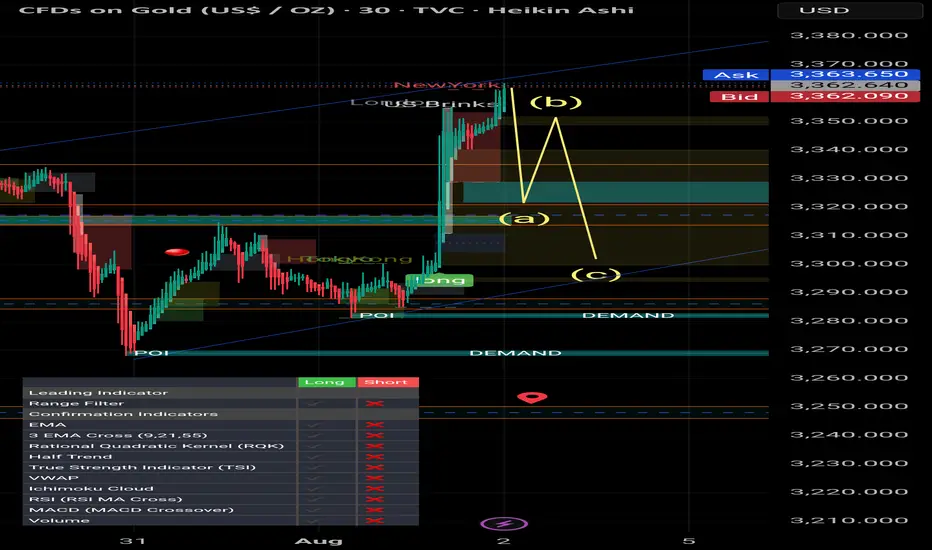
Price has completed a **strong bullish leg** and is currently forming a classic **(a)-(b)-(c)** corrective pattern. We are now between **point (b)** and the potential completion of **(c)**. The broader market is expected to **retest the lower demand POI**, possibly before resuming the uptrend.
---
## 🔎 Technical Highlights:
- 📉 Bearish correction in progress: (b) → (c)
- 📦 Major **Supply** above 3,390 – acted as rejection point
- 🟦 Strong **Demand Zone**: 3,345 – 3,320
- 🔁 Price forming a potential **ABC correction**
- 🔔 **Point of Interest (POI)** near 3,350 may offer entry confirmation
- 💠 **SSL Channel**: Currently bearish crossover
- 🔄 **RQQ, HT, MACD, RSI**: Bearish/neutral, waiting for reversal signals
- 📊 **Volatility (Vol %ile)**: 67%
- 🎯 **ATR**: 13.52 (2H – medium range)
- 🧯 **Risk Level:** Normal
---
## 🟢 Scalp Strategy:
Scalp traders can take advantage of both micro-swings at **points (a) and (b)** using lower TF (M5/M15) confirmations:
### 🎯 Scalp Buy:
- 📍 Entry: Near 3,345–3,350
- 🛑 SL: Below 3,340
- 🎯 TP: 3,365–3,370 (short-term liquidity sweep)
- ⚠️ Only on bullish SSL + RSI divergence (M5)
### 🎯 Scalp Sell:
- 📍 Entry: Near 3,375–3,380 (**point b rejection**)
- 🛑 SL: Above 3,385
- 🎯 TP: 3,360 then 3,350
- ⚠️ Use Heikin-Ashi reversal + SSL confirmation
---
## 📌 Mid-Term Outlook (Swing):
If price reaches **point (c)** around the **lower demand zone** and reacts with bullish structure (BOS, CHoCH), we anticipate a strong rally toward:
- **TP1:** 3,385
- **TP2:** 3,400
- **TP3:** 3,420 (next macro supply)
---
## ⚠️ Notes:
> This setup remains **valid until the end of NY session, August 8**.
> Wait for **clear confirmation** before execution.
> All scalps are suggested with **tight risk management**.
_Analysis by Mohsen Mozaffarinezhad | Educational Purposes Only_
---
#gold #xauusd #elliottwave #supplydemand #sslhybrid #scalping #smartmoney #tradingview #forexanalysis
Xauusdforecast

gold awaiting breakout#XAUUSD we wait for breakout below 3363-61 to sell, expected target 3335.
Below 3363-61 on m15-m30 closure holds bearish continuation, target 3335, stop loss 3373.94.
Possible move above 3378 then we await for 2 times breakout to buy, target 3399.

Gold - Intraday Long Setup (5M TF) | Smart Money + Elliott Struc# 🟢 Gold - Intraday Long Setup (5M TF) | Smart Money + Elliott Structure
**Pair:** Gold Spot / USD
**Timeframe:** 5M
**Session:** London / NY Overlap
**Type:** Intraday Long Idea
**Concepts:** Smart Money, Supply & Demand, Wave Analysis, SSL Confirmation
---
## 🔍 Market Context
The market is currently reacting inside a **key Demand Zone** on the 5-minute timeframe, following a strong bearish move during the London session. The structure suggests a corrective **ABC wave formation**, where the **(c) point** appears to be forming a potential higher low at demand.
- Point **(a)**: Marked the first impulse down
- Point **(b)**: Rejection at minor **Supply Zone**
- Point **(c)**: Retest of **POI at Demand**, showing signs of exhaustion in selling pressure
---
## 📈 Technical Confluences
- 🟦 **Demand Zone** active and respected
- 📏 Potential BOS (Break of Structure) upon break of the recent high
- 📊 **Vol %ile** = 83% → Above average participation
- ⚠️ Risk Level: High (tight structure, requires confirmation)
- 🧭 Entry Distance: Near
---
## 🔧 Indicators Status (SSL Hybrid)
| Indicator | Status |
|--------------------------|----------|
| SSL Channel | ✅ Bullish cross (supporting reversal)
| RSI (50) | ✅ Holding above midpoint
| MACD | ✅ Bullish crossover (early signal)
| BB Oscillator / HT / RQK | ❌ Still bearish (lagging)
---
## 🎯 Trade Idea
**Bias:** Long
**Trigger:** Break above **minor Supply** and formation of BOS
**Target Zones:**
1. **TP1:** 3,370
2. **TP2:** 3,378 (supply edge)
3. **TP3:** 3,385 (upper supply zone)
**SL:** Below point (c) @ **~3,357**
---
## 🧠 Notes
This setup is valid as long as price holds above the Demand Zone and confirms a bullish shift via BOS. Wait for clear confirmation before entering.
_This is an educational idea based on Smart Money + Elliott Wave principles – not financial advice._
---
#gold #smartmoney #supplydemand #elliottwave #sslhybrid #intraday #5mtf #tradingview

gold on sell#XAUUSD price third range have been broken, now we wait for reverse below 3355.
Sell from 3375-3373 on H1 closure, target 3355, SL 3384
If price touch 3371 and reverse back close, bullish range between.

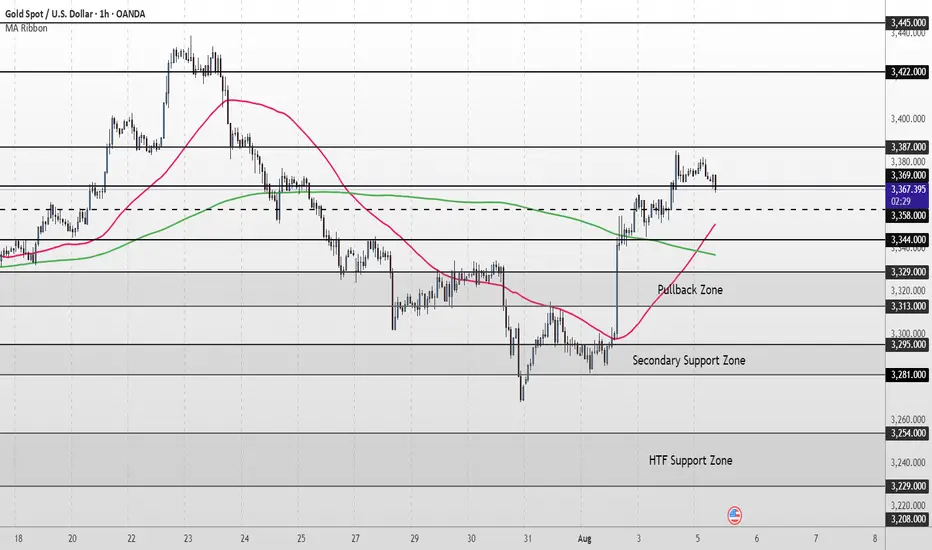
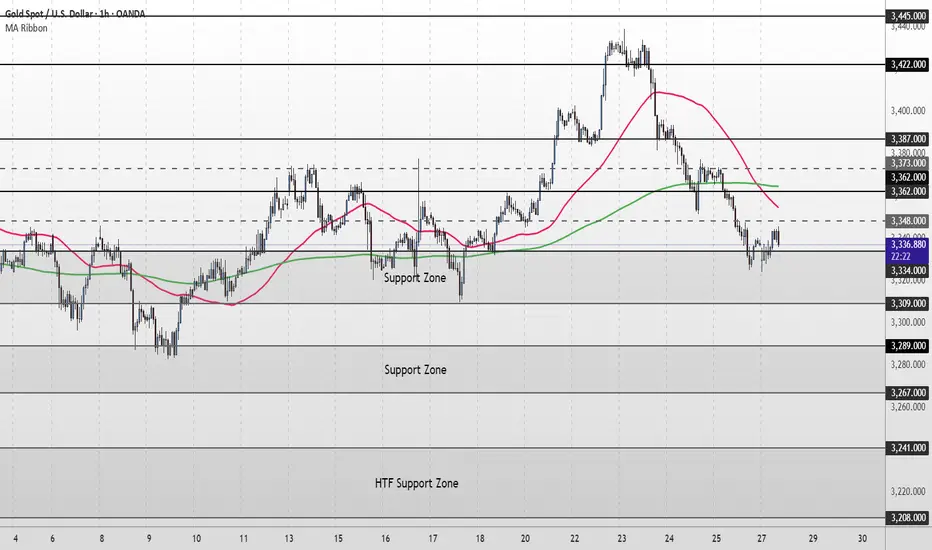
XAU/USD Intraday Plan | Support & Resistance to WatchGold remains in a bullish structure after breaking above the $3,348 level late last week. Price has since advanced into the $3,368–$3,387 resistance zone and is currently consolidating just beneath $3,387.
A clean break and hold above $3,387 would open the path toward the next upside level at $3,422, with $3,445 as the higher target above.
If price rejects here, watch for a pullback into the $3,358–$3,344 zone. This area is now acting as the first support, backed by the rising 50MA which may act as dynamic support. If buyers fail to hold that zone, focus shifts to the $3,329–$3,313 pullback zone — a deeper support where the 200MA is also positioned, adding confluence.
Failure to hold that area would open the door to a drop into the Secondary Support Zone around $3,295–$3,281, followed by the HTF Support Zone at $3,229–$3,208 if bearish pressure accelerates.
📌 Key Levels to Watch
Resistance:
‣ $3,387 ‣ $3,422 ‣ $3,445
Support:
‣ $3,358 ‣ $3,344 ‣ $3,329 ‣ $3,313 ‣ $3,295 ‣ $3,281 ‣ $3,254
🔎Fundamental Focus:
Today’s key event: ISM Services PMI (4:00pm) – high-impact for USD and gold volatility.
Earlier data (Trade Balance, PMI) may cause intraday spikes.
⚠️ Risk Reminder:
Avoid chasing. Let price react, then confirm. Stay sharp around news.
gold on sell reverse#XAUUSD on price reverse, base on the double rejection between 3345-3357. We await for breakout below 3351.6 before selling.
Entry 3351.6, target 3340-3315, SL 3361.
Above 3367 on 2 times breakout holds bullish till 3377 which have sell reject to fall below 3360-3350.

Smart Money / Price Action 5min scalping road map# 📈 ABC Pattern Explained for TradingView (Smart Money / Price Action)
The **ABC pattern** is a 3-leg corrective move in market structure, commonly used in price action, Elliott Wave, and Smart Money trading. It's mainly used to identify **pullbacks** or **correction zones** before a continuation of the main trend.
---
## 🔹 Structure of the ABC Pattern:
- **Point A**: The beginning of the move — often the end of a strong impulsive wave.
- **Point B**: The first retracement or pullback from Point A.
- **Point C**: The second corrective move that often goes beyond A, forming the completion of the correction phase.
The ABC legs can be:
- **A to B**: Impulsive or corrective.
- **B to C**: Generally a counter-trend retracement.
---
## 🔸 How to Identify on Chart:
1. **Find a strong trend** (uptrend or downtrend).
2. **Look for the first correction** — mark it as Point A to B.
3. **Next wave** that attempts to continue the trend but fails — mark the end as Point C.
4. **Use Fibonacci tools** to measure:
- **B retracement of A** (typically 50%–78.6%)
- **C extension** of AB (typically 127.2%–161.8%)
---
## 🔧 How to Draw on TradingView:
> You can use the `Trend-Based Fib Extension` tool or draw manually using the `Path` or `ABC pattern` tool.
### Step-by-Step:
1. Select the `ABC Pattern` tool from the **left toolbar** under “Prediction and Measurement Tools”.
2. Click on **Point A** (3320$).
3. Click on **Point B** (3350$).
4. Click on **Point C** (final corrective wave 3300$ ).
5. TradingView will automatically plot the shape with labels.
---
## 🧠 Pro Tips:
- Look for **liquidity sweep** or **order blocks** near Point C.
- Entry opportunity is often **after C**, targeting a **continuation** of the main trend.
- ABC is often part of **larger structures** like **complex pullbacks** or **smart money retracements**.
---
## ✅ Example Use:
- **Buy Scenario**:
- Strong uptrend → Price drops from A to B (retracement).
- Then price rises to C, failing to break above A → Possible new higher low formed.
- Enter long if price breaks above Point B again.
- **Sell Scenario**:
- Strong downtrend → A to B is a pullback.
- C attempts new high, fails → short entry after break of B.
---
## 📌 Settings Tip for Mobile Users:
- Zoom in for better point control.
- Use “Lock” feature to prevent accidental move.
- Customize color and label visibility in the style tab.
---
## 🔍 Keywords:
`ABC Pattern`, `Elliott Correction`, `Smart Money`, `Liquidity Grab`, `Break of Structure`, `Trend Continuation`, `Price Action Trading`, `Market Structure`
---
gold on third pattern breakout#XAUUSD have multiple test the third pattern, now price forming needs to breakout the 3308 before any further movement.
Buy entry 3301.4, TP 3308-3323.
Below 3291 holds a very strong bearish continuation, if breakout price will fall till 3269

gold on buy retrace#XAUUSD price have reformed back above 3306, now we are expecting bullish from 3309 on 2 times breakout.
Entry 3309 2 times breakout, target 3326-3335, SL 3297.
Below 3297 holds bearish reversal, target 3270. 3317 will reject, H1 closure there will continue bullish.

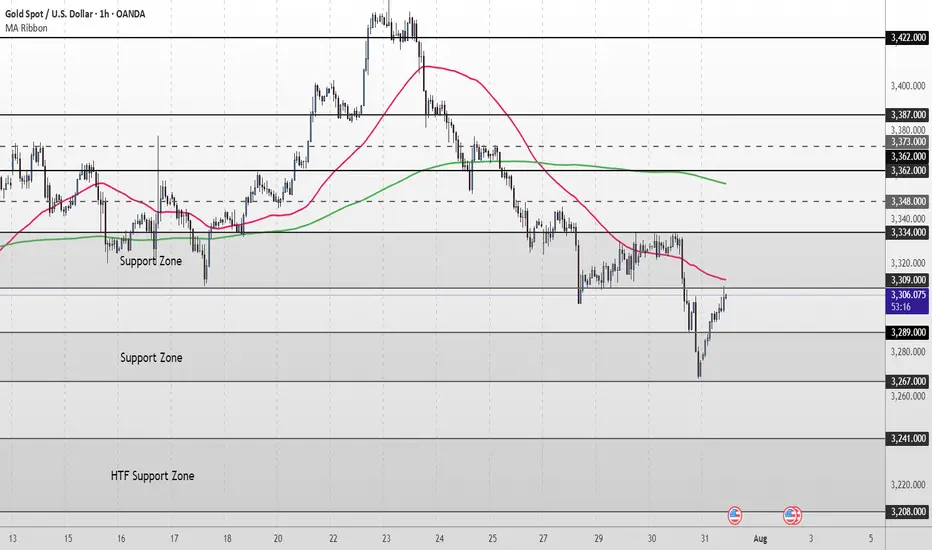
XAU/USD Intraday Plan | Support & Resistance to WatchGold staged a minor recovery overnight after bouncing from the 3,267 Support Zone, and is now trading around 3,305. Price remains below both the 50MA and 200MA, which continue to slope downward—confirming short-term bearish structure.
This current move is still corrective unless bulls manage to reclaim the 3,309–3,334 resistance zone. A clean break and hold above 3,334 would be the first sign of strength, opening up potential retests of 3,348 and 3,362.
Until then, any rallies into the 3,309–3,334 zone should be viewed with caution. If the bounce loses steam, watch for a retest of 3,289 - 3,267. A break below that would expose the 3,241 and 3,208 levels, with the HTF Support Zone (3,241–3,208) acting as a broader downside cushion.
📌 Key Levels to Watch
Resistance:
‣ 3,309
‣ 3,334
‣ 3,348
‣ 3,362
Support:
‣ 3,289
‣ 3,267
‣ 3,241
‣ 3,208
🔍 Fundamental Focus – Thursday, July 31
Big day for data.
🟥 Core PCE, Employment Cost Index, and Unemployment Claims — all critical for Fed outlook and could move gold sharply.
⚠️ Volatility expected around 2:30pm. Stay nimble and manage risk carefully.
XAUUSD ideaWe are waiting for our asset to reach our action zone, and based on the reaction, we’ll decide on our next moves.ALWAYS WAIT FOR A CONFIRMATION TO SEE IF THE PRICE VALIDATES THE ZONE.and you what is your vision of the EURUSD its interests me! i wait you in the commentary

Gold’s Biggest Day of 2025: Collapse or New High Incoming?🟡 Gold Pre-FOMC Update | Patience Paid Off
In my previous analysis released on Monday, we highlighted the significance of the 3310 key red level on gold. I mentioned that if we got a daily candle close below this zone, it could trigger further downside.
That scenario didn’t play out — price closed above 3310, and that’s exactly why we stayed out of any short positions. No guessing, no forcing. Just patience.
On the flip side, I also said we need a daily close above 3350 to even consider going long. And as you can see, for the past two days, price has been ranging tightly between 3310 and 3330 — with relatively low trading volume across the board.
After 9 years of optimizing this strategy, one core principle remains unchanged:
🛡️ Capital protection and maximum risk control always come first.
And I can confidently say — those filters are working beautifully. I hope you’re benefiting from this approach too.
Now technically speaking, everything is lining up for a bullish DXY and bearish gold —
But tonight’s FOMC meeting and Powell vs. Trump drama will be the final trigger.
Let’s watch closely. Smart trading is patient trading. 🧠⚖️
🔁 This analysis will be updated whenever necessary.
Disclaimer:This is not financial advice. Just my personal opinion.

XAU/USD Intraday Plan | Support & Resistance to WatchGold remains in a bearish structure, consolidating in a narrow range after the sharp drop earlier this week. Price is trading around 3,330, testing the 3,334 resistance zone while still below the 200MA (3,362), which may act as dynamic resistance.
As long as price stays below 3,348–3,362, the bias remains to the downside, with a break below 3,309 likely exposing the 3,289–3,267 support zone.
A clean reclaim above 3,334- 3,348 would neutralize the immediate downside pressure and open the path back toward 3,373–3,387.
📌 Key Levels to Watch
Resistance:
‣ 3,334
‣ 3,348
‣ 3,362
‣ 3,373
‣ 3,387
Support:
‣ 3,309
‣ 3,289
‣ 3,267
‣ 3,241
🔎Fundamental Focus – FOMC
The FOMC rate decision and Powell’s press conference later today will be the key driver for gold. Expect sharp volatility and potential whipsaws around the release.
⚠️ Manage risk carefully, avoid chasing initial spikes, and wait for clear direction once the event dust settles.

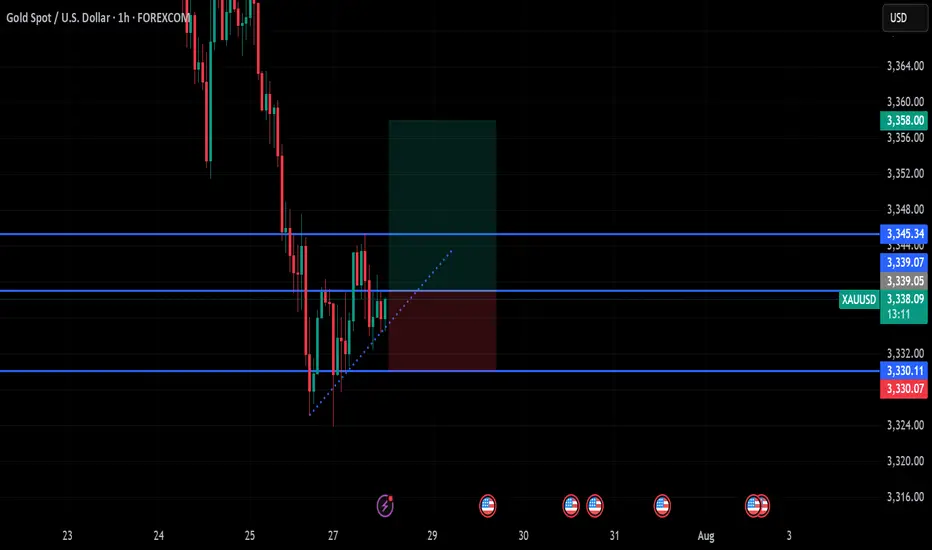
Sell Analysis – 30M Smart Money Concept Sell Analysis – 30M Smart Money Concept
📊 Chart Context:
Timeframe: 30M
Market: Gold (XAUUSD)
Bias: Bearish – Scalp Sell
---
🔍 Key Observations:
Premium Zone Rejection:
Price tapped into a premium supply zone formed after a clear break of structure (BoS) to the downside. This confirms seller dominance at higher pricing levels.
FVG (Fair Value Gap) Fill:
The price filled a previous FVG imbalance and showed rejection without closing above the origin of the impulse. This shows liquidity grab behavior typical in smart money moves.
Bearish Order Block Confirmation:
A bearish OB was respected and reacted to. The latest candle shows strong rejection with a long upper wick and volume tapering — an early confirmation of potential entry trigger for scalp short.
---
🧨 Entry Strategy (Scalp Sell):
Entry Zone:
Inside the reaction to the OB and FVG (just below the premium zone)
✅ 3325 ~3330
Stop Loss:
Just above the last high or FVG origin
✅ 3340
Take Profit:
TP1: Towards the equilibrium of the recent impulse leg
✅ 3300
TP2: Below the discount zone, targeting liquidity under recent lows
✅ 3280
---
⚠️ Risk Note:
This is a scalping setup, not a swing trade. Higher timeframes still show mixed signals, so risk management is key. Avoid over-leveraging.
---
🏁 Summary:
> A high-probability scalp sell setup confirmed by smart money concepts: BOS → FVG Fill → OB Rejection → Liquidity Grab → Bearish Continuation.

gold on sideways#XAUUSD price await double breakout above 3328.6 for bullish to take place. But now we await for any breakout to take trade.
Below 3314 holds sell continuation, target 3296, stop loss 3324.
Above 3328.6 on 2 times breakout will start bullish till 3340.

XAU/USD Intraday Plan | Support & Resistance to WatchGold remains under pressure, currently trading around 3,312. Price is holding just above the 3,309–3,289 Support Zone, but remains below both the 50MA and 200MA, which continue to slope downward—indicating short-term bearish pressure.
As long as price remains below the 3,334–3,348 resistance zone, the bearish momentum is intact. A clean break above this area would be the first sign of recovery, opening the path toward 3,362 and 3,373, where the next round of supply may emerge.
If price fails to reclaim 3,334 and breaks below 3,309, the 3,289–3,267 Support Zone becomes the next key downside target. Failure to hold that level would expose the HTF Support Zone (3,241–3,208).
📌 Key Levels to Watch
Resistance:
‣ 3,334
‣ 3,348
‣ 3,362
‣ 3,373
Support:
‣ 3,309
‣ 3,289
‣ 3,267
‣ 3,241
🔍 Fundamental Focus – Tuesday, July 29
Heads up — today’s focus is on 4:00pm, when we get JOLTS Job Openings 🟥 and CB Consumer Confidence 🟡
⚠️ Stay light and nimble — bigger moves may come tomorrow with red-folder data stacking up.

gold on buy reverse#XAUUSD price have multiple reject between the third range, now we expect for breakout to buy.
Above 3339 holds bullish reverse, target 3345-3358. 3345 can reverse back on sell.
Below 3330 on 2 times breakout will drop the price till 3320-3300
XAUUSD and AUDUSD Analysis todayHello traders, this is a complete multiple timeframe analysis of this pair. We see could find significant trading opportunities as per analysis upon price action confirmation we may take this trade. Smash the like button if you find value in this analysis and drop a comment if you have any questions or let me know which pair to cover in my next analysis.

XAU/USD Intraday Plan | Support & Resistance to WatchGold starts the new week attempting to recover after last week’s drop, now trading around 3,339, just above the 3,334 intraday support.
Price remains below both the 50MA and 200MA, which are now turning downward—signalling a shift to short-term bearish structure. To regain upside momentum, bulls need to reclaim the 3,362 resistance zone. A confirmed break above this area would re-open the path toward 3,373, 3,380, and 3,387.
Until then, structure favors the bears, and any rejection below 3,362 keeps risk tilted to the downside. A break back below 3,334 would expose price to the lower Support 3,309.
If that gives out, watch for deeper downside toward 3,289-3,267 and the HTF Support Zone (3,241–3,208).
📌 Key Levels to Watch
Resistance: 3,348 ‣ 3,362 ‣ 3,373 ‣ 3,380 ‣ 3,387
Support: 3,334 ‣ 3,309 ‣ 3,289 ‣ 3,267 ‣ 3,241
🔍Fundamental Focus:
This is a high-impact week for gold traders.
Expect spikes in volatility, especially around FOMC and NFP. Use wider stops, reduce position sizes, and trade only confirmed setups.
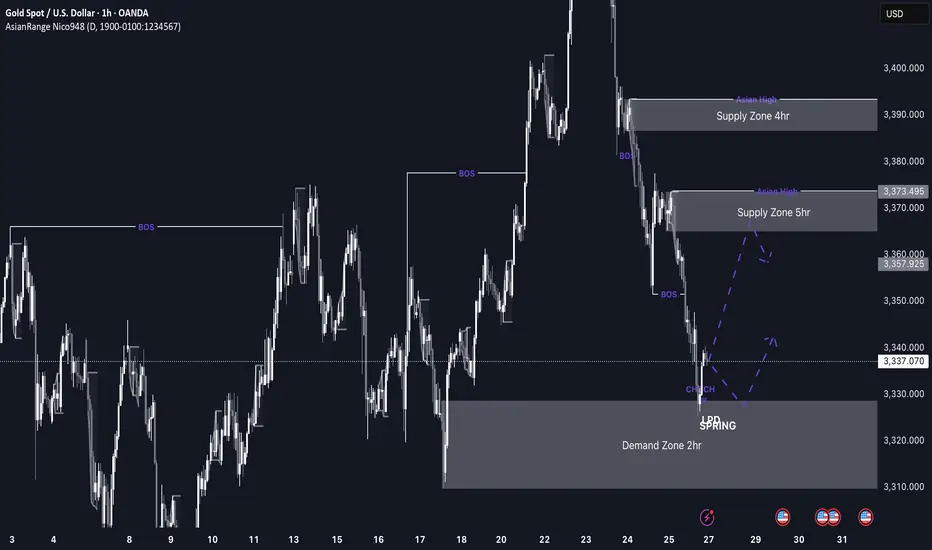
GOLD imminent possible buys up to 3,370 This week’s price action on GOLD is shaping up to be very interesting. After weeks of sustained bearish pressure, price has now entered a discounted 2hr demand zone sitting at a swing low, which makes it a high-probability area for a bullish reaction, especially as markets open.
If we do get the expected bullish reaction from this level, I’ll be watching the 3,370 region, where there’s a clean 5hr supply zone. If price reaches that level, I’ll be looking out for distribution and a potential short setup from there.
Confluences for GOLD Longs:
Price has been very bearish recently, so a retracement is expected
Currently sitting in a discounted 2hr demand zone
The overall long-term trend is still bullish
Early signs of accumulation and bullish reaction from this zone
P.S. If price fails to hold this current demand zone and breaks lower, then bearish momentum may continue. In that case, I’ll look for new long opportunities around 3,290 where a deeper demand zone exists.
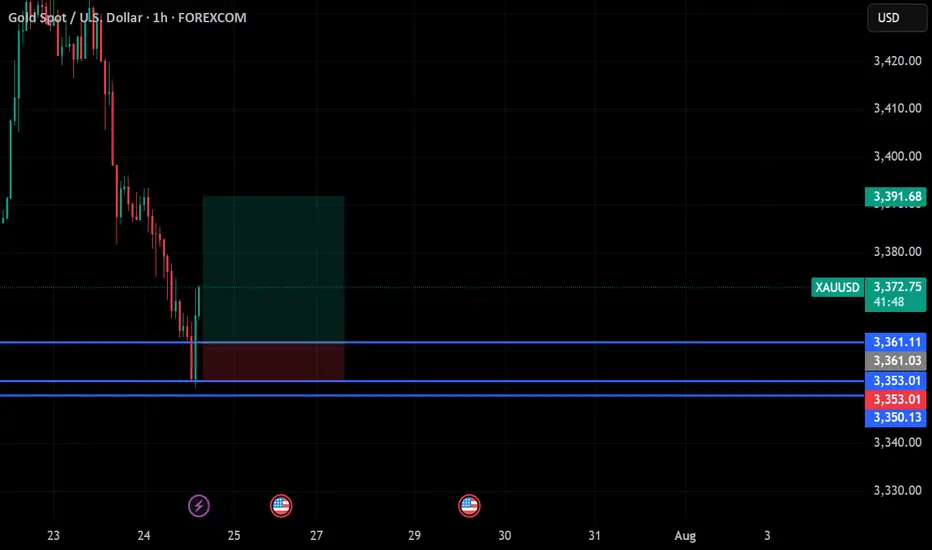
gold on buy reverse#XAUUSD price we await a little retrace below 3361 to continue bullish. Market price can follow
Entry at 3361, target 3391, stop loss 3353.
Bearish can follow depending on if tariff is lower.
LONG Setup - Smart Money Bias (15m)
## 🟢 LONG Setup - Smart Money Bias (15m)
- **Pair**: XAU/USD (Gold)
- **Timeframe**: 15m
- **Entry Zone**: Around **3390.050**
- **Stop Loss (SL)**: **3377.200**
- **Take Profit Targets**:
- **TP1**: 3402.800
- **TP2**: 3410.500
- **TP3**: 3418.800
---
### 📌 Confluences:
- Demand zone respected and tapped.
- Bullish reaction from POI (Point of Interest).
- FVG (Fair Value Gap) filled and reversal initiated.
- BOS + CHoCH in lower timeframe confirmed.
- Forecast projection aligns with upside inefficiency.
---
### 🧠 Strategy:
- Smart Money Concepts (SMC)
- Liquidity Sweep below demand
- Risk-Reward Ratio: ~1:2.3
🚨 **Note**: Trade with caution around US market open hours (volatility expected).
📌 Disclaimer & Reflection
Before we dive into today's mark down, I want to take a moment to address the previous signal that hit stop loss. As traders, we must acknowledge that losses are part of the process—no matter how solid our analysis may be. I take full responsibility for the outcome, and I appreciate the trust and patience of this community.
Every stop is a reminder that perfection doesn't exist in the markets—only probabilities. What matters most is how we adapt, learn, and continue to evolve.
Let's move forward with clarity and discipline.

gold on bullish#XAUUSD price expect bullish range between 3430, breakout there will take the price above 3450-3453.
Entry on buy 3430, target 3453, stop loss 3419.
Below 3416 holds a strong bearish continuation, target 3400.
