Gold: Bullish Gold Holds High GroundThe gold maintained an overall strong upward trend today. After surging in the early trading session, it consolidated at a high level, with prices consistently trading above the recent key resistance levels, reflecting a pronounced bullish bias. Its price action is strongly underpinned by favorable fundamental factors, while technical indicators also signal a clear uptrend.
The price extended its rally in the morning and did not experience a sharp pullback afterward. However, hampered by resistance around the 4290 level in the short term, there was no unilateral skyrocketing movement.
Key Levels:
Resistance Zones: Immediate short-term resistance is concentrated in the 4290–4300 range. A decisive breakout above this zone would pave the way for a further advance toward the next key resistance at 4320–4330.
Support Zones: Support levels have been gradually shifting upward. The 4250 mark, once a resistance level, has now evolved into a key support zone. The core support range stands at 4220–4230, with an additional robust support at the psychological integer level of 4200,a price point that previously triggered a swift rebound, underpinned by ample buying interest.
Trading Strategy:
Buy 4250–4255
SL 4245
TP 4280 - 4290 - 4300
Sell 4295–4300
SL 4305
TP 4280 - 4270 - 4260
Xauusdforecast

XAU/USD Clean Breakout From Consolidation ZoneGold has officially broken out of the long-held consolidation range between 4,200 – 4,240, confirming bullish strength after taking out the internal liquidity resting at ≈4,262. The aggressive impulse that drove price above the blue zone shows a clear shift in order-flow, suggesting buyers are now in firm control.
The breakout also validates the broader bullish narrative: price respected the H4 demand zone around 4,160 – 4,175, accumulated orders within the intraday range, and then expanded upward once liquidity was cleared. As long as price holds above the former consolidation zone, the market structure remains bullish.
With liquidity now taken and momentum clearly favoring the upside, gold is positioned to continue reaching for the next higher zone around 4,310 – 4,330, where major resting orders and a higher-timeframe supply region sit.

Gold Trade Set Up Dec 11 2025Price made a HH yesterday and came back down in Asia session failing to reach demand and leaving internal SSL that got swept to now approach London high, which i will watch to see if price can sweep to then make internal 5m bearish engulfing candle to target Asia lows and demand before continuing its bullish trend

“Support Bounce → Bullish Continuation Toward 4,245🟡 GOLD (XAU/USD) – Bullish Rejection from Support & Breakout Potential 🚀📈
🔍 Key Technical Analysis
Price respected the Support Level (4,185 – 4,190) and bounced strongly ✔️
Price is currently following an ascending Support Line → bullish structure intact 📈
Previous liquidity sweep (POI Points) shows buyers absorbing sell pressure 💰
Multiple breakouts indicate strong bullish momentum returning 🔥
Current consolidation suggests accumulation before next move up
🎯 Suggested Targets (with stickers)
Target Type Price Range Sticker
TP1 → Breakout Target 4,235 – 4,245 🎯
TP2 → Upper Expansion Zone 4,255 – 4,265 🚀💸
📌 TP1 = High-probability target
📌 TP2 = If bullish momentum continues strongly
📌 Trade Idea (Based on Chart Structure)
🟩 Buy Entry Zone:
➤ 4,195 – 4,205
🟢 Take Profit:
➤ TP1: 4,240 🎯
➤ TP2: 4,260 🚀
🧭 Market Outlook
Factor Bias
Trend Bullish above support ✔️
Liquidity Upside liquidity open 💧
Momentum Strengthening 📈

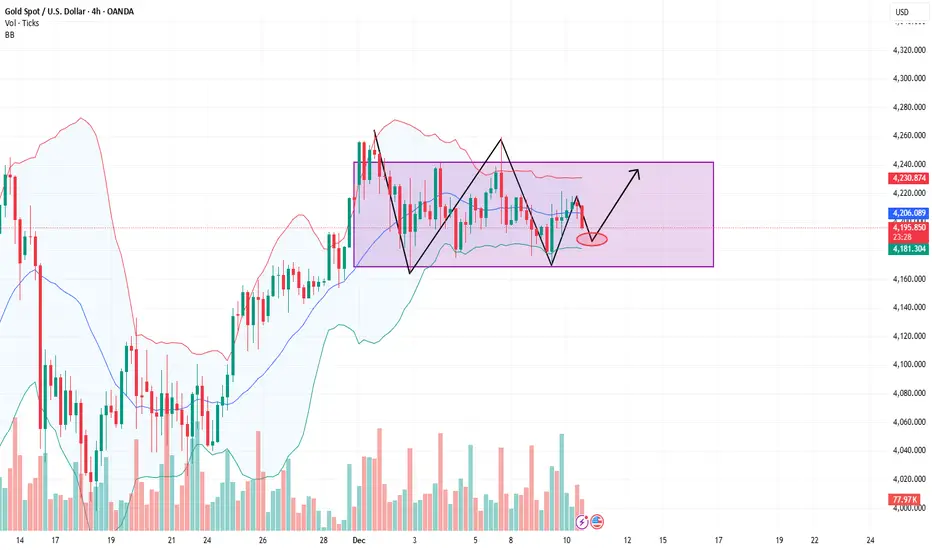
Gold traded within a rangeIn the short term, gold remains range-bound. It's not advisable to chase higher prices before a valid breakout. The recommended strategy is to buy on dips. Consider entering long positions near 4195. If the price breaks through the 4230 resistance level, add to long positions, targeting the 4245-4255 area. This area represents a resistance zone formed by connecting the previous downtrend highs; a break above this level would signal the start of a daily-level rebound in gold.
In the short term, the market will likely continue to trade within a range; the strategy should be to buy on dips.

Precise Strategy AnalysisThe daily chart shows the bullish trend remains intact, while the 4-hour chart maintains a range-bound pattern. Currently, the Bollinger Bands are narrowing within the 4170-4230 range, suggesting a potential range-bound trading strategy of buying low and selling high within this area. However, two points need attention: firstly, after Tuesday's rise, the support level may have moved up to around 4200, not necessarily reaching 4180; secondly, a strong break above the upper Bollinger Band at 4230 would open up further upside potential, with a target of 4260 or higher. Therefore, intraday trading should consider placing long orders in the 4190-4180 range, while short positions can be initiated with small positions at the 4230 resistance level. The focus is on the Fed's decision at midnight, with the market widely expecting interest rates to remain unchanged. Attention should be paid to Powell's tone. If his comments are dovish, it could trigger a sharp rise followed by a fall in gold prices; please exercise strict risk management.
Today's gold trading recommendations:
Short positions can be initiated around 4220-4215, with a stop loss at 4230 and a target of 4190.
Long positions can be initiated around 4190-4185, with a stop loss at 4170 and a target of 4210.
GoldXAUUSD
- Change of Characteristics
- Symmetrical Triangle as an corrective pattern in Short Time Frame
- Consolidation Phase
- Order Block
- Fair Value Gap

Gold Spot – Bearish Setup After Rising Wedge Breakdownold (XAU/USD) on the 1H chart shows a clear rising wedge pattern that recently broke to the downside. Price rejected the upper resistance near 4,237 and is now trading around 4,209, below the wedge support. This breakdown suggests potential bearish momentum toward the next support zone at 4,180.
This is my personal analysis based on price action and structure. Markets can change quickly, so manage risk accordingly.
Targets:
Entry Zone: 4,209
Target: 4,180
Invalidation: Above 4,237
DISCLAIMER : THIS IS JUST FOR EDUCATIONAL PURPOSE I AM NOT A FINANCIAL ADVISOR

XAU/USD (Gold) – Market Structure & Liquidity OutlookGold is currently trading in a well-defined consolidation range within my marked blue zone, showing signs of balance after the impulsive move into this area. Price action over the recent sessions indicates compression, with multiple equal highs and lows forming — a classic sign that liquidity is building.
Key Levels
• Current Price Area: ~4,228
• Range High / Liquidity Pool: 4,255 – 4,265
• Range Low / Support: 4,195 – 4,205
• Higher Timeframe Demand (H4 Zone): 4,155 – 4,165
• Invalidation / Stop Loss: Below 4,175
Trade Bias
My bias remains bullish as long as price holds above the H4 demand zone.
The market has respected the blue range multiple times without a clean breakdown, suggesting stronger hands are accumulating positioning below resistance. I’m expecting price to first sweep the resting buy-side liquidity resting above the recent highs around 4,255–4,265, followed by a decisive break and acceptance above the blue zone.
A strong close above 4,265 would confirm a breakout from consolidation and open the door for continuation toward higher highs.
Execution Plan
• Entry Zone: Within the blue consolidation range on confirmation
• Target 1 (Liquidity Sweep): 4,260
• Target 2 (Continuation): New highs above 4,270
• Stop Loss: Below 4,175 (protecting against a deeper H4 demand sweep)
Risk Thesis
A sustained break and close below 4,175 would invalidate the bullish structure and suggest a deeper retracement into the H4 demand zone near 4,160.

FOMC DELIVERED EXCELLENT PROFITS ON XAUUSD As I discussed throughout my TODAY'S Commentary on XAUUSD
What was my stance & Postions:
I took buy in my early trade before NY session and target was 4230 which XAUUSD delivered
I have waited for Gold to deliver decent pullback from supply supportarea which I mentioned 4190-4180.I have engaged risk management Lot size set of Buying orders ($4275 Stoploss) and closed my orders on $4205 & 4233 in extension. Although I took both buying and selling after Fomc announcement, XAUUSD delivered fantastic Results.
Totally we had today
I want to take this moment to congratulate the traders who followed my calls and patiently held their orders. Great job — enjoy the profits and have a great weekend.
Follow us for more XAUUSD Setups and Detailed analysis

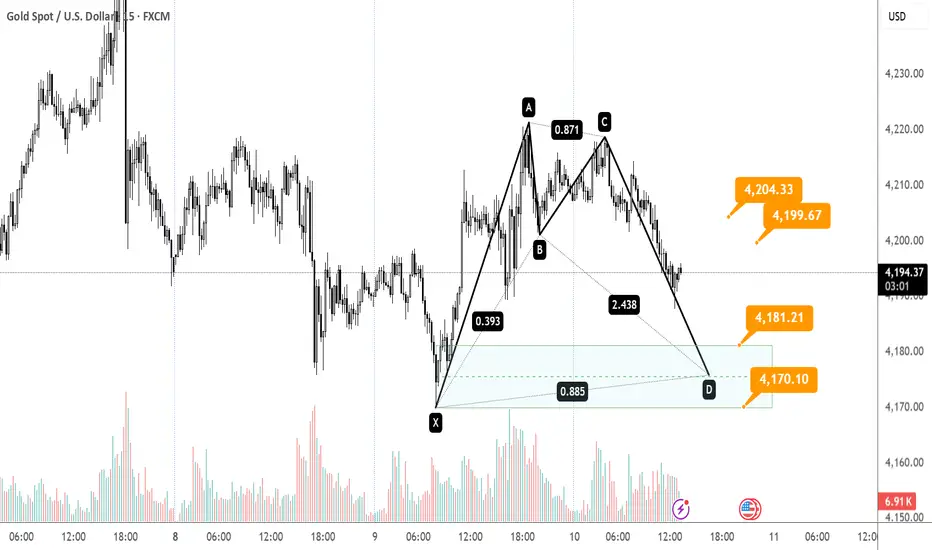
Gold Harmonic pattern Setup ( OANDA:XAUUSD )Once price hits point D, two scenarios:
🟢 Primary Scenario (Bullish Reversal)
Gold reacts upward into the following targets:
🎯 Target 1 → 4,181.21
(Minimum harmonic target = 38.2% of CD)
🎯 Target 2 → 4,199.67
(61.8% retracement target)
🎯 Target 3 → 4,204.33
(Final harmonic TP based on structure)
These orange targets on your chart match perfect harmonic projections.
❌ Invalidation
The Bat pattern becomes invalid if:
❌ Price closes below 4168
(below X point or below PRZ cluster)
A wick is allowed.
A candle body close below invalidates.
Bullish Reversal Setup from Strong Support Zone (4,174–4,182) wi
✅ 1. Support Zone (Highlighted Red Box – 4,174 to 4,182)
The red area at the bottom is a strong support zone.
Price has touched this area multiple times and bounced back, showing buyers are active here.
Lower support: 4,174
Upper support: 4,182
This area indicates demand and potential reversal.
---
✅ 2. Price Action
Recent candles show:
A downward move into the support zone.
A stalling or consolidation near support.
The red curved line indicates a projected upward reversal.
This suggests the chart creator expects a bullish bounce from support.
---
✅ 3. Bullish Scenario
The large green zone and upward blue arrow indicate:
Expected move upward from the support.
A possible target zone near 4,218 – 4,222 (shown at the top).
This is likely the target price for the long position.
---
⚠️ 4. Risk Zone
Price below 4,174 could indicate:
Support break
Possible continuation downward
This would invalidate the bullish expectation.
---
📌 Summary
Strong support: 4,174–4,182
Price is near support, showing potential for a bounce.
Bullish target: Around 4,218–4,222
Bullish scenario only valid if support hold

Gold: consolidation and the search for directionGold has been trading in a range in recent days, maintaining a balance between buyers and sellers. The movement remains restrained: upward impulses are followed by pullbacks, while the price holds within the consolidation zone.
The chart shows the formation of a structure that does not give a clear advantage to either side. On one hand, interest in safe-haven assets supports demand for gold; on the other, dollar strength limits growth.
The current situation points to a waiting phase: the market is accumulating energy, and the next breakout of key levels will determine the further direction. For now, gold remains in a neutral zone, where both continued growth and the development of a correction are possible.

Gold Trade Set Up Dec 10 2025Price has swept PDL already and is approaching London highs, if price sweeps it and makes internal 5m-15m engulfing/CISD to the downside i will look for a continuation down to demand and lower SSL

gold await breakout#XAUUSD price await 2 times breakout below 4192-90, this price act as reverse on buy but if the H1 closes below there then sell will occur.
Buy limit 4192-90 2 times breakout, target 4209-31, SL 4186.
Below 4187.8 D1 low, breakout again will go sell but we await below 4186 to sell. Above 4231 holds sell retrace

Gold (XAU/USD) – Range Consolidation with Bullish Upside Target1. Market Structure
Range → Attempted Breakout:
Price has been moving in a broad consolidation / rising channel, with multiple rejections near the upper boundary.
Higher Lows, Weak Highs:
Buyers are defending higher lows, but sellers are still strong near resistance → this is compression, not a confirmed trend.
Bias: Neutral-to-bullish only if support holds.
---
2. Key Levels (Very Important)
🔴 Support Zone (Red Area)
4,170 – 4,163
This is a major demand zone.
Multiple candle wicks show aggressive buying here.
If this zone fails → structure breaks bearish.
✅ As long as price stays above 4,163, longs are still valid.
---
⚪ Current Price Area
Around 4,190–4,200
Price is sitting mid-range → not ideal for new entries unless confirmation appears.
---
🔵 Resistance / Target Zone
4,250 – 4,260
Clear range high + prior rejection zone
Marked as your TARGET POINT, which technically makes sense.
🚨 Expect selling pressure here on first touch.
---
3. Trade Idea Implied by the Chart
Bullish Scenario (Preferred)
Entry:
Rejection + bullish candle close above 4,170–4,180
Stop Loss:
Below 4,160
Target:
4,250–4,260
✅ Risk–reward is solid only if entry is near support.
---
Bearish Scenario (Invalidation)
A strong 3H close below 4,160
That would:
Break the demand zone
Flip structure bearish
Open downside toward 4,120–4,100
---
4. What I’d Watch Next (Discipline Check)
✅ Bullish engulfing / strong rejection at support → okay to long
❌ Chasing price in the middle of the range → poor trade
🚨 Fake break above 4,250 without volume → likely reversal
---
Bottom Line
This is a range-based long setup, not a breakout yet.
Best trades are patience trades here.

GoldXAUUSD
- Completed " 1234 " Impulsive Waves
- Bullish Channel as an corrective pattern in Long Time Frame
- Fair Value Gap
- Symmetrical Triangle in Short Time Frame
- Order Block

“XAUUSD Bullish Reversal Setup Toward 4252 – Smart Money StructuChart Analysis
1. Market Structure
Price previously formed a strong swing high near 4252, marked with the red circle.
After that, the market corrected downward and consolidated in a sideways range (highlighted box).
Price has since broken out of that range and is now retesting the breakout zone.
2. Current Zone
Price is hovering around 4198–4200, which appears to be:
A support retest level
A higher-low formation, indicating bullish intent
3. Bullish Expectation
Your arrows and markup suggest:
A small pullback
Followed by a bullish move toward:
First target: ~4219
Main target: 4252, the previous liquidity grab area
This aligns with:
Break of structure (BOS)
Imbalance fill
Smart money concepts (liquidity resting at prior highs)
4. Stop Loss
SL marked near 4180
This sits below the retest zone and protected liquidity — a logical invalidation area.
5. Overall Bias
Bullish, with expectation of:
Retest → Higher-low → Move toward major liquidity at previous highs

Gold traded within a rangeIn the short term, gold remains range-bound. It's not advisable to chase higher prices before a valid breakout. The recommended strategy is to buy on dips. Consider entering long positions near 4195. If the price breaks through the 4230 resistance level, add to long positions, targeting the 4245-4255 area. This area represents a resistance zone formed by connecting the previous downtrend highs; a break above this level would signal the start of a daily-level rebound in gold.
In the short term, the market will likely continue to trade within a range; the strategy should be to buy on dips.
Gold - The Calm Before the StormGold's hesitant price action is digesting expectations of a hawkish rate cut by the Federal Reserve and a easing of geopolitical tensions. Currently, bullish and bearish factors are intertwined, with expectations of a Fed rate cut, a weakening dollar, geopolitical developments, and US economic data collectively dominating short-term gold price movements. The range-bound trading pattern remains unbroken. The core focus of gold trading this week is undoubtedly the Federal Reserve FOMC meeting. Investors will closely monitor the latest economic projections (including the "dot plot") and Powell's post-meeting press conference, hoping to glean clear clues about the future path of rate cuts—a signal that will directly influence changes in dollar demand and inject new directional momentum into gold.
Before the Fed's decision is announced, gold is likely to fluctuate between $4170 and $4210, with trading volume expected to remain thin. Blindly chasing highs and lows carries significant risk. Traders should pay close attention to the following two points: First, breakout signals at key price levels: If the Fed releases dovish guidance, clarifying the easing path until 2026, gold is expected to break through the $4200 mark, potentially opening up further upside potential. If Powell makes hawkish comments, emphasizing a higher threshold for rate cuts, gold may break below the $4170 support level, triggering short-term stop-loss orders. Second, the linkage between data and policy: Tonight's US labor force data can serve as a supplementary reference. If the data resonates with the Fed's policy tone, it will amplify gold's volatility. Furthermore, sudden changes in geopolitical risks could become black swan events, requiring hedging preparations. Overall, gold is currently in a "waiting for confirmation" trading phase, and the range-bound trading pattern before the Fed's decision is expected to continue. For traders, the safest strategy at present is to maintain a light position and wait for clear policy signals before making any moves, avoiding blindly betting on the direction in a range of intense battle between bulls and bears.

Gold Trade Set Up Dec 9 2025Price swept PDL in Asia session and pushed up, now i expect price to push to PDH, sweep London high, tap into 1h FVG before making 5m-15m bearish structure to continue bearish down to lower SSL

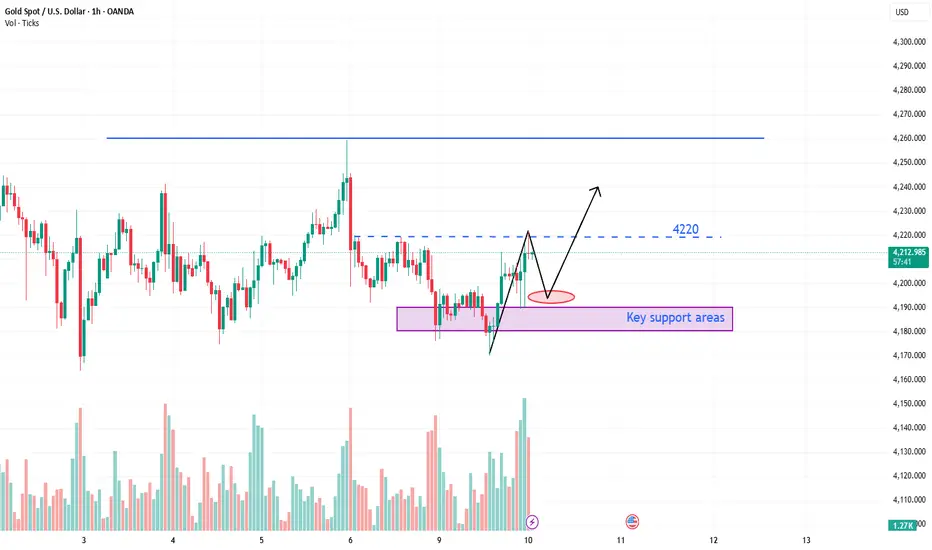
XAUUSD is on Swing HighXAUUSD H1- M30 Timeframe SETUP
As I mentioned in my previous setup I'm expecting the buy trade from 4200-4195 as retest of BOS .
Aming target at 4220 - 4230 I'm extension
Caution:
H1-H4 candle closes should be above 4200

gold await breakout#XAUUSD base on price movement and H4 past candle, we need retest above 4226-35 for sell to reverse back.
Await buy on valid breakout 4209.4, SL 4196, TP 4226-35
Below the rectangle on M15-30 closure price will fall back till 4175 or more.
