XAUUSD/GOLD 1H BUY PROJECTION 06.11.25XAUUSD (Gold/USD) on the 1-hour timeframe, dated 06.11.25. Here’s a clear breakdown of what the analysis suggests:
🟢 Overall Bias: BUY Projection
The setup shows a bullish outlook for Gold, following a trendline breakout and retest.
🔍 Key Technical Details:
Trendline Break & Retest:
A downward (bearish) trendline was broken to the upside.
Price retested the broken trendline, confirming potential for upward continuation.
Temporary Resistance:
Around 3989–3990 level (current price area).
If this zone is broken cleanly, further upward movement is expected.
Uptrend Line (1H):
An ascending trendline is drawn, suggesting the current bullish momentum.
The projection follows this uptrend structure.
Resistance Levels:
Resistance R1: Around 4000–4010
Resistance R2: Around 4020–4030
These are potential target zones for buyers.
Support / Stop-Loss Area:
Below 3970, marked in the red shaded region, is the invalidation level if price drops below it.
🧭 Projected Path:
The arrows indicate the expected movement:
Minor pullback from temporary resistance.
Bounce off the trendline.
Continuation up through R1 and potentially toward R2.
💡 Summary:
Bias: Bullish (Buy)
Entry Zone: Near 3980–3990 after retest confirmation.
Targets:
TP1 = 4000–4010 (R1)
TP2 = 4020–4030 (R2)
Stop-Loss: Below 3970 support.
Would you like me to calculate the risk-to-reward ratio (RRR) based on these zones
Xauusdforecast

Gold Trade Set Up Nov 5 2025Price has pulled back up during the Asia session from yesterdays drop. On the 4h we are still bearish but on the 1h and 15m we are making HH/HL. We got a 15m supply price is close to testing so i want to see price either respect it and make internal 5m bearish structure to go lower to take out SSL/London lows or break and close above it to continue higher to PDH

GOLD AWAIT BREAKOUT BEFORE ENTRY#XAUUSD price still bearish unless 2 times breakout occurs above the 3989 limit which will go bullish till 4015.
Now we await for retest above 3974 to sell. Target 3936, stop loss 3989.
Below 3956 on M15-H1 closures holds continuation on sell.

Gold Bearish Continuation After Range BreakdownThe chart shows that gold (XAUUSD) recently broke down from a clear consolidation range highlighted by the red rectangle. This range acted as a distribution zone where price repeatedly failed to break higher. Once the lower boundary of that range broke, sellers gained momentum, pushing price downward.
Price has now pulled back toward the broken structure, forming a corrective bullish move — likely a retracement before further downside. The projection on the chart suggests a lower-high formation followed by continuation to the downside.
Key observations:
Breakdown from consolidation: The range around 3960–4000 was rejected multiple times, confirming strong resistance.
Pullback to structure: Current bullish candles appear corrective, not impulsive.
Bearish projection: The chart shows expected continuation toward levels around 3929, 3900, and potentially lower.
Stop-loss area: The SL is clearly marked at 4000.234, above the former resistance zone.

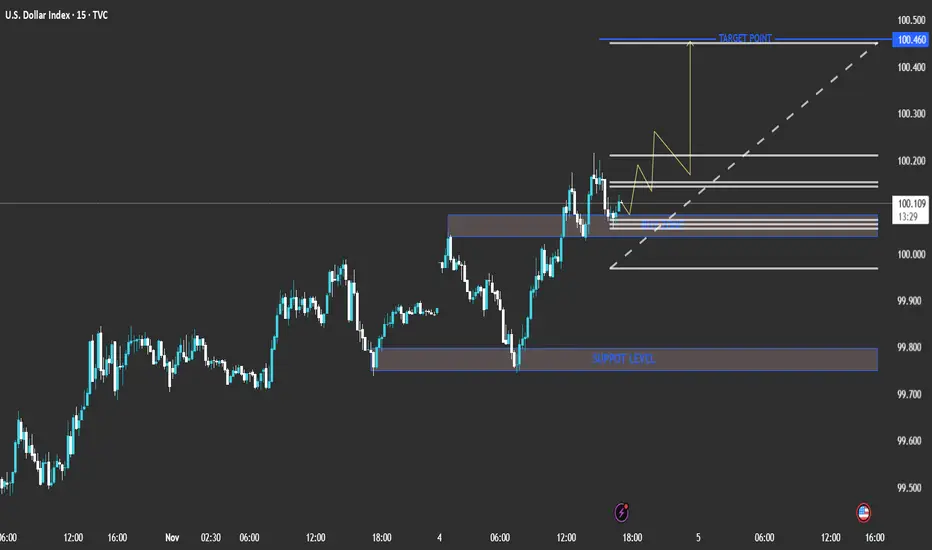
technical analysis of the chart you shared (U.S. Dollar Index Current Price: 100.112
Bias: Bullish short-term
Timeframe: 15-min
The chart shows a clear bullish structure with higher highs and higher lows forming. The price recently bounced from a minor support zone around the 100.00 level and is showing momentum to the upside.
📊 Key Levels
Support Level: 99.750 – 99.850 (major zone from previous lows)
Buy Zone: 100.000 – 100.050 (minor support/entry zone)
Target Point: 100.460
⚙️ Analysis Summary
Price has broken above short-term resistance and is now retesting the buy zone, suggesting a possible continuation higher.
The ascending trendline (dotted white line) supports this bullish bias.
The yellow zigzag projection indicates expected consolidation before a push upward.
🎯 Trading Plan (Based on Chart Setup)
Entry Zone: Around 100.000 – 100.050
Stop Loss: Below 99.900 (below structure support)
Take Profit: 100.460 (target zone)
Risk/Reward Ratio: Approximately 1:3
🔍 Conclusion
The chart suggests a short-term bullish scenario for DXY (U.S. Dollar Index). A successful bounce from the 100.00 zone could lead to a move toward the 100.46 target point. However, a break below 99.90 would invalidate the setup and shift bias to neutral or bearish. TVC:UKX FTSE:UKX FTSE:MCX FTSE:FBMKLCI FTSE:AIM1 FTSE:ASX FTSE:NMX FTSE:AW01 FTSE:JAPAN FTSE:GEISAC FTSE:FBM100 FTSE:AIM5 CBOEEU:BUK100P FTSE:XIN0 FTSE:AXX FTSE:XIN0U
XAU/USD (Gold) 15-Min Chart AnalysisCurrent Price: $4,005
Resistance Zone: $4,020 – $4,040
Gold is approaching a strong resistance area that previously triggered a pullback.
Trend Structure:
The market is moving inside a short-term ascending channel, but momentum shows signs of exhaustion near the upper boundary.
Key Observation:
A false breakout or rejection at the resistance could initiate a downward correction.
Bearish Signal Setup:
Entry Zone (Sell): $4,015 – $4,035 (look for rejection candles or bearish engulfing near resistance)
Target 1: $3,960
Target 2 (Main Target): $3,913
Stop Loss: $4,045 above resistance zone
Risk/Reward Ratio: Approx. 1:2.5
Confirmation:
Wait for bearish confirmation candle on 15M or 30M timeframe.
Break below $3,980 will strengthen bearish momentum toward target.
Signal Summary (📉 Sell Setup):
Direction Entry TP1 TP2 SL
🔻 SELL 4,015 – 4,035 3,960 3,913 4,045 TMX:SXF1! TMX:CRA1! TMX:SXA1! TMX:FHO1! TMX:CGF1! TMX:CGZ1! TMX:FBA1! TMX:FSH1! TMX:SXM1! TMX:SXM1! TMX:FFL1! TMX:FOP1! TMX:FRW1! TMX:FFV1! TMX:FEQ1! TMX:FRQ1!

XAU/USD Technical Analysis – Bearish Rejection at ResistanceXAU/USD) is currently trading around the $4,009 level after rebounding from a recent intraday low. The price action shows a clear rising channel structure, with the upper boundary acting as a significant resistance zone near $4,040 – $4,050.
The chart highlights a resistance level where price has repeatedly failed to sustain upward momentum, indicating a potential double-top or distribution pattern forming in this area.
If price fails to break and hold above the $4,020 – $4,040 resistance zone, bearish momentum may resume, potentially pushing gold toward the $3,950 area initially, followed by a deeper correction to the target level near $3,913.
Conversely, a decisive breakout and close above $4,050 could invalidate the bearish outlook, opening the way for further bullish continuation.
Key Levels:
Resistance Zone: $4,020 – $4,050
Immediate Support: $3,990
Target Level: $3,913
Trend Bias: Short-term bearish under resistance
Conclusion:
Gold is approaching a critical resistance area, and a rejection could confirm a short-term bearish reversal pattern. Traders should watch for confirmation near $4,020–$4,040 for potential short entries targeting $3,913. CME_MINI:NQ1! CME_MINI:MNQ1! CME_MINI:ES1! CME_MINI:MES1! COMEX_MINI:MGC1! CBOT_MINI:YM1! NYMEX:CL1! CME:BTC1! COMEX:SI1! NSEIX:NIFTY1! CME_MINI:RTY1!

Gold Trade Secured 250 Pips!Our sell set up played our perfectly, broke structure on the 15m, swept 5m BSL, took sells to SSL. What a clean set up

GoldXAUUSD
- Symmetrical Triangle as an corrective pattern in Long Time Frame
- RSI - Divergence
- Change of Characteristics
- Falling Wedge in Short Time Frame
- Fair Value Gap

Gold Trade Set Up Nov 4 2025Price is making LL/LH on the 1h and 15m so i am still bearish but first i want to see a sweep of internal BSL followed by 5m bearish candle close to target SSL/PDL

gold still bearish#XAUUSD price have multi reject the 3999 limit which shows bearish strength is still strong. Now we await for breakout below 3988 to sell.
3988 sell stop, target 3948, stop loss 4000.
Above the 4006-10 on M15-H1 closures shows bullish continuation, target 4028-35

XAUUSD/GOLD 1H SELL PROJECTION 04.11.25sell limit projection for XAU/USD (Gold) on the 1-hour timeframe, dated November 4, 2025.
Here’s the breakdown of the setup:
Trend Context:
The blue diagonal line labeled “BROKED 1H UPTREND CHANNEL” indicates that the price has broken below a previous uptrend, suggesting a potential bearish reversal.
Sell Entry Zone:
The “BREAKED ZONE” (around 4,007.863) is the projected sell limit entry area. The trader expects price to retest this level before continuing downward.
Stop Loss:
Placed above the resistance zone at approximately 4,023.449, protecting against a false breakout.
Target / Take Profit Levels:
Support S1: Around 3,984.000, likely the first take-profit (TP1).
Support S2: Around 3,966.380, the main target price (TP2) for the sell setup.
Trade Plan Summary:
Entry: ~4,007.86
Stop Loss: ~4,023.45
Take Profit: ~3,966.38
Bias: Bearish (sell after retest of broken trendline and resistance)

XAU/USD BULLISH CONTINUATION SETUPAnalysis:
On the XAU/USD (Gold vs USD) chart, price action shows a strong bullish structure forming after multiple Change of Character (CHoCH) and Break of Structure (BOS) confirmations. The market recently created an equal low (EQL) around the 3990–3995 zone, indicating potential liquidity build-up below.
Price has since rebounded from this demand area and is currently trading near the entry zone (around 4007–4008), suggesting a possible bullish continuation if structure holds.
Key observations:
Demand Zone: 3990–3995 region — a high-probability area where buyers previously stepped in.
Entry Level: Around 4007 — ideal for a long setup upon bullish confirmation.
Target Zone: 4060–4066 — aligning with the previous weekly high, acting as a strong liquidity target.
Stop Loss (Implied): Below 3988 zone, under equal lows for risk management.
Bias:
Bullish — as long as price holds above 3990 and maintains structure, the next push toward 4060–4066 remains likely.

Gold Trade Set Up Nov 3 2025Price is making HL/HH on the 1h and is now testing 15m Supply so i will only be looking for buys if price continues to make a HH but if price can respect this supply and make bearish internal structure on the 5m-15m i will look for sells down towards SSL

XAUUSD/GOLD 1H BUY PROJECTION 03.11.25🟩 Technical Summary:
Structure: Price has broken out of a 1H downtrend line, signaling a potential bullish reversal.
Pattern Confirmation: A Bullish Engulfing candle confirms buying momentum.
Zones Marked:
Resistance R1: Around 4,020 zone
Resistance R2: Around 4,030–4,035 zone
4H Target Price: ~4,075–4,080 zone
Support Zone: Near 3,995–4,000 (Stoploss area).
📈 Projection Logic:
Price breaks 1H downtrend.
Retests near the trendline breakout zone (~4,000–4,010).
Pushes towards R1 and R2.
Final 4H target projected near 4,075–4,080.
🎯 Buy Setup Example:
Buy Entry: 4,005 – 4,010 (after retest)
Stoploss: 3,985 – 3,990
Target: 4,075 – 4,080
Risk–Reward: Roughly 1:3+

XAUUSD is on Rangebound currently market is bullish biased and Rangebound from 3995-4040 -zone.
Although it's upside at 3998 was to quick.
What are my conditions For This setup?
- I'm waiting for buy from 3990-3980 area & expecting the reversal move towards 4028- 4047 target although currently I took bu6 from 3995-3990 area and holding till my Targets
- Second if H1-H4 candle closes above 4045 area I will straight Buy and target 4070-4090 .
✳️Secondly if H4-H1 candle closes below 3975-3970 our buying will be compromised

GoldXAUUSD
- Bullish Channel as an corrective pattern in Short Time Frame
- RSI - Divergence
- Completed " 12345 " Impulsive Waves and " ABC " Corrective Waves
- Falling Wedge as an corrective pattern in Long Time Frame
- Order Block

XAUUSD 4H Technical & Fundamental Weekly ForecastGold remains consolidative after strong rejection at the 4H Resistance Area near 4,100, with a visible break of structure to the downside confirming a shift in short-term momentum. The price is currently stabilizing near the 4H Support Zone at 3,965–3,980, as the market awaits high-impact U.S. data later in the week.
Key Levels
Support: 3965 — 3980
Resistance: 4010 — 4035
liquidity zone: 4000
Reasoning:
Technically, the 4H structure shows a clear lower-high formation after the resistance rejection, signaling that sellers are regaining control. The support zone between 3,965–3,980 will act as a key decision area — a break below could extend the bearish leg, while a bounce might trigger a short-term recovery.
Fundamentally, this week’s focus is on U.S. economic data, including the ISM Manufacturing & Services PMI, ADP Employment, and Non-Farm Payrolls (NFP) reports. Stronger-than-expected numbers could strengthen the U.S. dollar and pressure gold prices, while weaker data might support a short-term rebound.
Disclaimer:
This analysis is for educational purposes only and not financial advice. Always confirm your own entries and apply proper risk management before trading.

XAUUSD Analysis todayHello traders, this is a complete multiple timeframe analysis of this pair. We see could find significant trading opportunities as per analysis upon price action confirmation we may take this trade. Smash the like button if you find value in this analysis and drop a comment if you have any questions or let me know which pair to cover in my next analysis.

XAUUSD BEARISH REVERSAL SETUP FROM SUPPLY ZONE🔍 Key Observations:
1. Market Structure Shift:
A Change of Character (CHoCH) has occurred near the upper boundary of the ascending channel.
This indicates a potential shift from bullish to bearish momentum.
2. Liquidity & Supply Zone:
The red zone near $4,044 – $4,018 acts as a supply zone or bearish order block.
Price has reacted from this level, rejecting higher prices.
3. Entry & Targets:
Entry: Around $4,011 – $4,018 (current zone)
Stop Loss: Above the recent high near $4,044
First Target (TP1): $3,977 – local liquidity zone
Second Target (TP2): $3,930 – $3,915 major demand area / imbalance fill zone
4. Channel Breakdown Potential:
If the price closes below the lower trendline of the ascending channel, a strong bearish continuation toward the lower targets is expected.
5. Smart Money Concept (SMC) View:
The chart aligns with liquidity grab above highs, followed by CHoCH, suggesting smart money selling pressure.
A retracement to premium zones has already happened, and distribution is likely underway.
📉 Bearish Outlook Summary:
Bias: Bearish
Entry Zone: 4,011 – 4,018
Stop Loss: 4,044
Target 1: 3,977
Target 2: 3,930 – 3,915
Invalidation: Break and close above 4,045 would negate bearish setup.

GoldXAUUSD
- Resistance Level
- Bullish Channel as an corrective pattern in Long Time Frame
- RSI - Divergence
- Symmetrical Triangle as an corrective pattern in Short Time Frame
- Completed " 12345 " Impulsive Waves and " ABC " Corrective Waves

gold await breakout to buy or sell#XAUUSD we await price to fall below 4017 on 2 times breakout before selling. The price is reforming a new trend.
Sell below 4017 2 times breakout, target 3982, stop loss 4028.
H1 closure above 4030-32 will continue bullish till 4050.
Await for breakout before trading
