XAUUSD/GOLD SELL LIMIT PROJECTION 27.10.25Pattern Context
There’s a descending triangle or M-pattern that has been broken to the downside.
Labels such as “BREAKED M PATTERN NECKLINE HERE” and “BREAKED TRIANGLE PATTERN” indicate bearish structure.
Trade Setup
The chart projects a sell limit order in the region around 4,062–4,083 (highlighted red zone).
Stop loss is above the recent high — around 4,083.185.
Entry appears to be at the retest zone near 4,062.189 (“BREAKER ZONE RETEST & SELL”).
The target (take-profit area) points toward temporary support at approximately 4,031.150, suggesting a bearish continuation.
Trend Lines
A broken uptrend line and triangle breakout support the short bias.
The blue uptrend line and black triangle structure confirm the confluence zone where the retest and rejection may occur.
Summary of Bias
Direction: Bearish (Sell setup).
Confirmation: Triangle & M-pattern breakdown, retest expected.
Risk Management: Stop above 4,083; target near 4,031 (risk-reward ratio ≈ 1:2 depending on entry).
Xauusdidea

Elliott Wave Analysis – XAUUSD (October 27, 2025)Elliott Wave Analysis – XAUUSD (October 27, 2025)
🔹 Momentum
• D1 Timeframe:
D1 momentum remains clustered, suggesting that a bullish reversal could occur at any time. However, since momentum has not yet separated clearly, short-term downside pressure still exists.
• H4 Timeframe:
H4 momentum is currently declining, meaning that the downtrend could continue. We need to wait for H4 momentum to reach the oversold area and observe the market’s reaction there to determine whether the current drop is complete.
• H1 Timeframe:
H1 momentum is rising slightly, indicating the potential for a short-term rebound. However, since H4 is still in a down phase, any upward movement could face resistance near the 4098 level.
________________________________________
🔹 Wave Structure
• D1 Timeframe:
Price is currently moving sideways while D1 momentum remains stuck together, signaling a possible upcoming 5-day rally once D1 momentum turns upward into the overbought zone.
o If price fails to break above wave (3) yellow, this move is likely a wave (4) yellow correction.
o Conversely, if price breaks above wave (3) yellow, the current correction may only be a minor wave within wave (3) yellow.
________________________________________
🔹 Two Main Scenarios
1️⃣ Bullish Scenario (WXY blue completed):
If the WXY blue corrective structure has finished, the market may start a new wave (5) purple uptrend.
In this case:
• As H4 momentum moves into the oversold area, price should not fall deeply toward 4004.
• A sharp and decisive rebound from that zone would confirm this bullish scenario.
2️⃣ Bearish Scenario (Correction still in progress):
If the correction is not yet complete, the H4 decline could continue:
• Price might break below 4004, or at least retest it.
• If that happens, the downtrend could extend toward 3953 or 3927.
________________________________________
🔹 H1 Structure – Triangle Formation
On the H1 chart, price is consolidating within a contracting triangle, suggesting sideways accumulation with two possible interpretations:
• Scenario 1:
The triangle represents wave X of the WXY black structure.
When H4 momentum reaches the oversold zone and price holds above 4004, we may see an impulsive breakout toward the previous high at 4381, completing a flat correction of wave (4) yellow (D1).
• Scenario 2:
The triangle is wave (4) of wave Y blue, meaning that once completed, price could decline further toward 3953 or 3927 to finish wave Y. After that, a more stable upward wave is expected.
________________________________________
🔹 Trading Plan
Currently, price remains inside the triangle pattern:
• For experienced traders:
Wait for a breakout of either side of the triangle for direct entry.
• For more conservative traders:
Wait for Buy opportunities near strong support below.
🎯 Buy Zone: 3930 – 3927
🛑 Stop Loss: 3917
🎯 TP1: 4004
👉 If price breaks above 4149, we can look for Buy entries upon breakout, expecting an extended upward move toward 4268 or higher.

GOLD Finally Bearish , Short Setup Valid To Get 300 Pips !Here is My 30 Mins Gold Chart , and here is my opinion , we finally Below 4050.00 With 4H Candle And this never happened for a long time ! and we have a 4H Candle closure below it And Perfect Breakout and this give us a very good confirmation , so we have a good confirmation now to can sell after the price go back to retest the broken area 4050.00 , and give us a good wicks as previous wicks ! and we can targeting 100 to 200 pips . if we have a daily closure above this area this mean this idea will not be valid anymore .
Reasons To Enter :
1- Perfect Touch For The Area .
2- Clear Bearish Price Action .
3- Bigger T.F Giving Good Bearish P.A .
4- Over Bought .
5- Perfect 30 Mins Closure .

Gold Bearish Rejection from Supply Zone (OB + FVG Confluence)Key Observations and SMC Components:
Market Structure Shift (MSS): The label "MSS" suggests that the previous bullish market structure has been broken to the downside, indicating a potential shift to a bearish trend.
Order Block (OB): A bearish Order Block is identified (labeled "OB"), which is typically the last up-close candle before the strong move down. This zone is a high-probability area where institutional selling pressure is expected to resume.
H1 FVG (Hourly Fair Value Gap): Within the Order Block, an H1 FVG (or Inefficiency) is identified. This is an area where price moved strongly without overlapping all three candles, leaving a gap. Fair Value Gaps are often used as targets for price to retrace and "fill" before continuing the dominant move.
CRT-L and CRT-H:
CRT-L (Current Range Top/High) marks the top of the range before the sharp drop.
CRT-H (Current Range Low/Bottom) marks the low point of the current swing leg.
Projected Move: The large green arrow and the curved line indicate the anticipated price action: a retracement (pullback) upwards into the H1 FVG and the OB zone, followed by a rejection and a continuation of the downward move towards and potentially below the CRT-H low.
Current Price Action: The price is currently at the very bottom of the sharp drop, hovering around $4,041.48. The dotted line and arrow show the expectation of a rally into the shaded resistance zone.
Trading Bias and Expectation
The overall bias is bearish. The analyst expects price to:
Rally (short-term bullish retracement): Move up to the area between approximately $4,065 and $4,080 (the OB and H1 FVG zone).
Reject and Trend (long-term bearish continuation): Find strong resistance in the OB/FVG zone, and then reverse to continue the downtrend, aiming to break the CRT-H low.

XAUUSD 4H Short Setup: Selling the FVG RetraceKey Observations:
Recent Structure: The price has experienced a strong move down (impulse leg) followed by a small retracement and then further downside movement. The overall momentum is currently bearish.
Fair Value Gap FVG: The key focus is the Fair Value Gap FVG, marked by the blue/gray box. This is an area of price inefficiency left behind during the strong bearish move. It typically acts as a target for price to retrace to before the dominant trend continues.
Setup Rationale: The analysis suggests the current price movement (around 4,064.9 will see a retracement higher (green arrow up) to fill the FVG and potentially touch the liquidity zone marked by the red box (often representing an optimal entry or order block within the FVG.
Trade Projection: After reaching this inefficiency zone ($\sim\text{4,085}$ to $\sim\text{4,105}$), the projection is for a strong bearish continuation (green arrow down), aiming for the downside target in the green shaded area 4,045.
Conclusion:This setup anticipates a bounce into resistance FVG zone before a continuation of the selling pressure. The core strategy is selling a retracement in a short-term bearish market.

XAU/USD | Day Trade Bullish Map – Can Gold Reach 3800 This Week?🏆 XAU/USD | Metal Market Wealth Strategy Map (Day Trade) 🥇
🎯 Plan: Bullish Wealth Heist
The thief’s map is drawn — and today, the gold vault is our target.
🔑 Strategy Style (Thief Layering Method):
Instead of a single-entry, this plan uses layered limit orders (multiple entry levels). Think of it as planting “buy traps” across the chart to secure the best loot.
📥 Entry Layers (Buy Limits):
3660 💰
3670 💰
3680 💰
3690 💰
3700 💰
(⚡ Add more layers if your style allows — the thief never comes with just one key!)
🛑 Stop Loss (Escape Door):
SL @ 3630 (⚠️ Reminder: This is MY thief escape hatch. You’re free to place your own exit plan depending on risk appetite.)
🎯 Target (Loot Point):
TP @ 3800 (near strong resistance, overbought zone & police patrol 🚨)
— Remember: take profits where you feel safe. The thief escapes when the bag is full!
📊 Thief’s Key Notes
This is a layering strategy, designed for dynamic entries & better position cost-averaging.
XAU/USD often reacts strongly around resistance bands — watch for liquidity hunts before the move.
Don’t marry the trade — grab profit, exit quick, and live to raid another day.
🔗 Related Pairs to Watch (Correlation Check)
OANDA:XAGUSD (Silver): Moves in sync with Gold, but can be more volatile.
TVC:DXY (US Dollar Index): Inverse correlation — if USD weakens, gold often rallies.
FX:EURUSD : Another inverse play against USD, gold strength may reflect here.
SP:SPX / PEPPERSTONE:NAS100 : Risk sentiment cousins — equity weakness often boosts gold.
✨ “If you find value in my analysis, a 👍 and 🚀 boost is much appreciated — it helps me share more setups with the community!”
⚠️ Disclaimer: This is a Thief Style Strategy, shared for educational & fun purposes only. Not financial advice — trade at your own risk.
#XAUUSD #Gold #Forex #DayTrading #TradingStrategy #ThiefTrader #FXCorrelation #Metals #Scalping #TradingView

technical analysis for Gold (XAU/USD) based on your provided chaPrice: Around $4,112.53
Timeframe: 30-minute
Trend Structure: Gold is trading within a rising channel, suggesting short-term bullish momentum after rebounding from a support level.
🧭 Key Technical Zones
Support Level: $4,060 – $4,080
→ This zone has held price multiple times and aligns with the channel’s lower boundary.
Immediate Resistance: $4,125
→ Minor horizontal resistance, currently being retested.
Mid-term Resistance: $4,175 – $4,200
→ The upper boundary of the short-term consolidation range.
Main Target Zone: $4,381
→ Marked as the projected bullish target; aligns with the top of the ascending channel.
📊 Pattern & Projections
The chart shows a bullish continuation setup (possibly a flag or channel breakout in progress).
Price recently bounced from support and is respecting the ascending trendline, hinting at a possible push toward higher resistance levels.
A break above $4,125 could trigger momentum toward $4,175, then $4,225, and finally the target at $4,381.
⚠️ Risk Management
Invalidation: A close below $4,075 (support zone) would invalidate the bullish scenario and could push price back toward $4,025 – $4,000.
Stop-Loss (for buyers): Below $4,070.
Take-Profit Levels:
1️⃣ $4,175
2️⃣ $4,225
3️⃣ $4,381
🟢 Summary Signal
Bias: Bullish
Entry Zone: Around $4,100 – $4,115 (after confirmation of support hold)
Target: $4,381
Stop-Loss: $4,070 NASDAQ:TSLA NASDAQ:AAPL CME_MINI:NQ1! CME_MINI:ES1! COMEX:GC1! CBOT_MINI:YM1! COMEX_MINI:MGC1! NYMEX:CL1! COMEX:SI1! CME_MINI:RTY1! CBOT_MINI:MYM1!

Gold at a Critical Crossroads: Surge to $4700 or Drop to $3500?If the price breaks through the yellow zone, it could reach the red zone range. And if it doesn't cross the yellow zone, there's a chance it could head toward the 4700 range

Elliott Wave Analysis – XAUUSD (October 24, 2025)
1️⃣ Momentum
D1 Timeframe:
• D1 momentum is closing within the oversold zone → bearish strength has clearly weakened.
• The probability of a bullish reversal is now very high.
• A strong bullish D1 candle close is needed to confirm the reversal.
• Once confirmed, price may enter a 5-day bullish rally.
H4 Timeframe:
• H4 momentum is still declining.
• If the current H4 candle closes as it is now, we may see a main bearish move today (around 5 H4 candles).
• Since today is Friday, a deeper decline remains possible.
→ Therefore, careful observation and analysis are required before entering any trades.
H1 Timeframe:
• H1 momentum continues to decline.
• Price may drop toward the 4098 liquidity zone.
• If this level breaks, the next potential target is 4050.
________________________________________
2️⃣ Wave Structure
D1 Structure:
• Price has been moving sideways for several days.
• In Elliott Wave theory, when price reaches its target, it often needs time symmetry before the wave completes.
• Therefore, this prolonged sideways phase helps maintain time balance.
• It’s still too early to confirm whether this is yellow Wave 4 or just Wave 4 within yellow Wave 3.
H4 Structure:
• There are two possible scenarios:
1. The blue Y wave is still unfolding.
2. The purple Wave 5 has already started forming.
• To determine which scenario is valid, we monitor the current
H4 bearish phase:
o If price does not break the previous low, and H4 momentum enters the oversold zone, it likely indicates purple Wave 5 has begun, with an upside target near 4476.
o If price breaks the previous low, the blue Y corrective wave is still in progress, or a larger corrective structure is unfolding.
o In that case, we’ll watch the lower liquidity zones, with the ideal completion target for Wave Y around 3927.
H1 Structure:
• On the H1 chart, Wave C appears to have completed in the form of an Ending Triangle.
• According to Elliott theory, after an ending triangle, price should drop sharply and quickly.
• However, such a strong drop hasn’t appeared yet, so we continue to observe the price action carefully.
There are two main scenarios to consider:
1. If price declines slowly toward the 4050 liquidity zone, showing overlapping waves while H4 momentum moves into the oversold region, it’s likely that Wave 5 has already started.
→ In this case, we’ll look for buying opportunities.
2. If price falls rapidly and steeply, it suggests that the blue Y wave is still unfolding, or that the market is inside a larger corrective phase.
→ In this case, price may break below 4004, and we will patiently wait for buy setups around 3953 or 3927.
________________________________________
3️⃣ Trading Plan
• Sell Setup:
o Yesterday’s sell zone at 4149 has already reached about +400 pips.
o No new ideal sell zone for now → wait for liquidity breaks to look for the next sell setup.
• Buy Setup:
o Monitor potential buy reactions at:
4050
3953
3927
⚠️ Note:
Price is currently at a sensitive zone, with each candle showing a range over 200 pips.
→ Therefore, limit orders are highly risky at the moment and could easily get stopped out.

Gold Trade Set Up Oct 24 2025Price has shifted to bearish structure in London session so for CPI i am expecting a run of SSL first to induce sellers, followed by internal 5m-15m bullish structure to then run up to sweep BSL and fill the daily FVG

GOLD ON SELL#XAUUSD price will continue bearish on 2 times breakout below 4058, we expect price to multiple break there before more dropping.
Entry 4058 2 times breakout, target 4022, stop loss 4075.
Price can sell from Market price also. The bullish depends on the cpi data release.

XAUUSD Geoplolitical move?Hello traders, this is a complete multiple timeframe analysis of this pair. We see could find significant trading opportunities as per analysis upon price action confirmation we may take this trade. Smash the like button if you find value in this analysis and drop a comment if you have any questions or let me know which pair to cover in my next analysis.

XAUUSD on consolidation ready for again upside XAUUSD is cool down & captured the consolidation zone from 4090-4140 .
What are my conditions For Today's session?
Currently i m looking for buy trade from 4085-4175 zone ,I'm expecting H4 and H1 Candle closing will be above 4100 .
Targets: 4145- 4175.
✳️Secondly if H4-H1 candle closes below 4070
our buying will be postpond and market will test 4045.

XAU/USD 10-23-25After the recent runup with gold it has pulled back to the 23.6 fib level on the daily timeframe and actually pushed below showing strong support in the 3975 - 4040 daily zone.
I would like to think that price will run right back up to retest the recent ATH of about 4382Gbut if I know gold in all her trickiness she will coast along at this 23.6 level then perhaps dip to the 38.2 or even the 50 then get a strong push back up to retest the high and from there probably come back down or push thru depending on macro economic and political events at that time.
Going back a few months to May of this year you can kind of see how price experienced similar behavior when it was breaking thru the 3430 - 3505 daily zone which obviously is that real push thru the previous psychological ATH level of 3500. Now history is repeating itself as we push to stay above the recent psychological ATH of 4000 towards 4500.
We shall see...

Elliott Wave Analysis – XAUUSD (October 23, 2025)
1️⃣ Momentum
D1 Timeframe:
• The D1 momentum is now in the oversold zone, suggesting a potential bullish reversal at any moment.
• Once we see a D1 candle close with a bullish confirmation, it could trigger 3–5 consecutive bullish days ahead.
H4 Timeframe:
• The H4 momentum is currently overbought, indicating a possible downward correction during today’s session.
H1 Timeframe:
• The H1 momentum is now turning upward, meaning price may rise slightly or move sideways in the short term.
• Watch two key liquidity zones: 4098 and 4143.
If H1 momentum reaches the overbought zone around these levels, it will align with the H4 bearish momentum, creating a strong resistance area.
________________________________________
2️⃣ Wave Structure
D1 Structure:
• The D1 momentum is preparing to reverse, showing that the current decline is weakening.
• A short-term recovery wave is likely to appear soon.
• As discussed in yesterday’s plan, we must observe the upcoming bullish move to confirm whether the recent downtrend has completed.
H4 Structure:
• The H4 momentum is overbought, meaning a bearish reversal may happen soon.
• Price movement is slow and overlapping, suggesting that the next decline could be either:
o Wave 4 of Wave Y (blue), or
o A larger corrective phase if momentum fully shifts downward.
H1 Structure:
• The current formation may be developing as a Flat or a Triangle correction.
o If it’s a Flat, the 4143 level is a potential completion zone for Wave C (black), after which price could resume its decline.
o If it’s a Triangle, the pattern is not yet complete — confirmation will come when price breaks below the lower boundary, offering a Sell opportunity.
🎯 Target zone if the decline unfolds:
• Based on the H4 momentum cycle (typically lasting 4–5 candles),
• And according to Fibonacci projection, Wave 5 of Wave Y (blue) targets around 3927.
________________________________________
3️⃣ Trading Plan
• The current H1 candle range is very wide (300–400 pips), while my typical stop-loss size is 100–150 pips.
• This makes limit orders risky in the current environment.
• Therefore, it’s better to wait for clear confirmation before entering trades, rather than placing early limit orders.
🔹 Sell Zones:
• 4143 and 4190 – expected top areas of this correction.
• Additionally, if price breaks above liquidity zones and then retests, these can serve as Sell entries aligned with the H4 downward momentum.

GOLD BREAK AND RETEST RECOVERY TOWARDS $4270 Overall Structure
The chart shows a rising channel pattern (ascending parallel channel) that gold had been trading within for several days.
Recently, price broke below the channel, found support, and is now retracing upward toward potential resistance levels.
🧭 Key Observations
1. Trend Context
Previous trend: Bullish, as seen from the steady higher highs and higher lows inside the yellow channel.
Recent move: Sharp bearish breakout below the channel, followed by a strong recovery bounce.
Current structure: Gold is attempting to retest the lower boundary of the broken channel — a common “break and retest” setup.
2. Support Zone
The green arrow marks the support zone around $4,018–$4,040, where the last drop reversed sharply.
This area held as strong de…
📊 Trading Outlook
Bias: Short-term bullish recovery within a medium-term corrective structure.
Buy zone: Above $4,140–$4,150 with confirmation candle.
Targets: $4,206 / $4,253 / $4,271.
Stop-loss: Below $4,100 (for short-term trades).

XAUUSD:Keep an eye on the 4,000 support mark📈The current price of London gold is 4,116.87 per ounce, up 28.36 from the previous trading day, with a percentage increase of 0.64%. So far today, the highest price has reached 4,137.35 per ounce, and the lowest is 4,065.47 per ounce. Currently, the price is in a state of fluctuating increase.
📝Market sentiment and fund flow:
Judging from the recent market performance, the price of London gold has fluctuated violently. On October 21st, the price of London gold once dropped by more than 6%, and the decline continued on the 22nd, with the lowest reaching 4,002.89 per ounce during the Asian session.
The significant decline in these two days was mainly due to the weakening of risk - off sentiment. The joint statement by the relevant parties in the Russia - Ukraine conflict in support of a cease - fire and the easing signals in Sino - US relations have weakened the safe - haven demand for gold.
At the same time, the previous large increase in the price of gold had accumulated a large number of profit - taking positions, and the pressure on investors to take profits was relatively high. However, the price rebounded on the 23rd, indicating that market sentiment has recovered to some extent, but overall it is still relatively cautious.
📝Technical analysis:
From the perspective of the 4 - hour cycle trend, the gold shows a trend of shifting from a bullish to a bearish rhythm in the short and medium term, forming a typical M - top pattern, which indicates that there may still be room for the price of gold to decline in the near future. However, the large - integer - level support of 4,000 per ounce is currently relatively clear, and in the short term, it may fluctuate within the range of 4,000 - 4,150. In terms of operation, it is mainly advisable to go short on rallies. The upper resistance level is in the range of 4,135 - 4,150, and the short-term support around the 4,065-4,070 range,then the key support level is in the range of 4,010 - 4,000.
💡In conclusion, the price has rebounded today, but due to the impact of the previous significant decline, it may fluctuate within the range of 4,000 - 4,150 per ounce in the short term, and the trend is uncertain. Investors need to closely pay attention to the changes in factors such as the geopolitical situation, Sino - US relations, and the Federal Reserve's policy.
💎Trading Strategy:
BUY 4010 - 4015
SL 4000
TP 4030 - 4020 - 4070
Sell 4120 - 4125
SL 4130
TP 4100 - 4080 - 4060
Daily-updated accurate signals are at your disposal. If you run into any problems while trading, these signals serve as a reliable reference—don’t hesitate to use them! I truly hope they bring you significant assistance

Price still in upwards channelAlright, here's the thing with gold. Recently, the price dropped sharply, which might look alarming. But when we look at the bigger picture, gold is still in an upward channel or a rising trend. What does that mean? It shows that, despite this dip, gold still holds its value in the long run. Think of it like a staircase—sometimes you step down a bit, but you're still climbing higher overall. This is good news for investors because it means gold continues to act as a safe haven and a reliable hedge against things like inflation or economic uncertainty. The short-term drop could be due to temporary factors, but the long-term trend gives confidence that gold remains strong.

Gold Trade Set Up Oct 23 2025Gold is still overall in a bearish trend making LH/LL on the 4h so until we close above 4264 i will still be looking for sells under internal HL targeting SSL/PDL but if price breaks above HH price can possible make a run up for the 4h FVG and 15m supply

Gold (XAU/USD) Technical AnalysisAnalysis:
Gold is currently trading around 4,120, showing a minor bullish correction within a descending channel. The price has bounced from the support buy zone (4,040–4,060), indicating buyer activity at this level. However, the structure remains bearish in the short term as long as the price stays below the descending trade line.
A possible scenario is a short-term pullback toward the upper trade line before another retest of the support zone. If the support holds again, a bullish reversal could target the 4,383 level, aligning with the upper boundary of the previous high.
Key Levels:
Support Zone: 4,040 – 4,060
Resistance (Trade Line): 4,180 – 4,200
Target (Bullish): 4,383
Outlook:
Neutral-to-bullish in the medium term if the support zone remains intact. A break below 4,040 would invalidate the bullish setup and signal further downside continuation. QSE:MRDS QSE:NLCS QSE:ERES QSE:QNBK QSE:FALH QSE:BLDN QSE:DUBK QSE:IGRD QSE:QIBK QSE:IQCD QSE:MEZA QSE:AKHI QSE:WDAM

Gold Rebounds from Extreme POI – Bullish Move Building UpGold?Analysis:
Gold (XAU/USD) has shown a strong recovery after tapping into the Extreme Point of Interest (POI) zone, signaling the potential start of a bullish reversal.
The chart indicates an SMC Trap (Smart Money Concept Trap), where liquidity was swept below previous lows to trigger sell stops before reversing upward — a classic smart money accumulation pattern.
Price reacted sharply from the Extreme POI, forming higher lows, which confirms renewed buyer interest.
The immediate target area lies around $4,180 – $4,200, aligning with the projected bullish arrow.
Below, the High Probability POI remains as a deeper demand zone — a strong confluence area if price retests.
📊 Conclusion:
Gold is showing signs of bullish structure recovery after liquidity sweep. Holding above the Extreme POI zone strengthens the case for continued upside movement toward $4,200 and possibly higher.

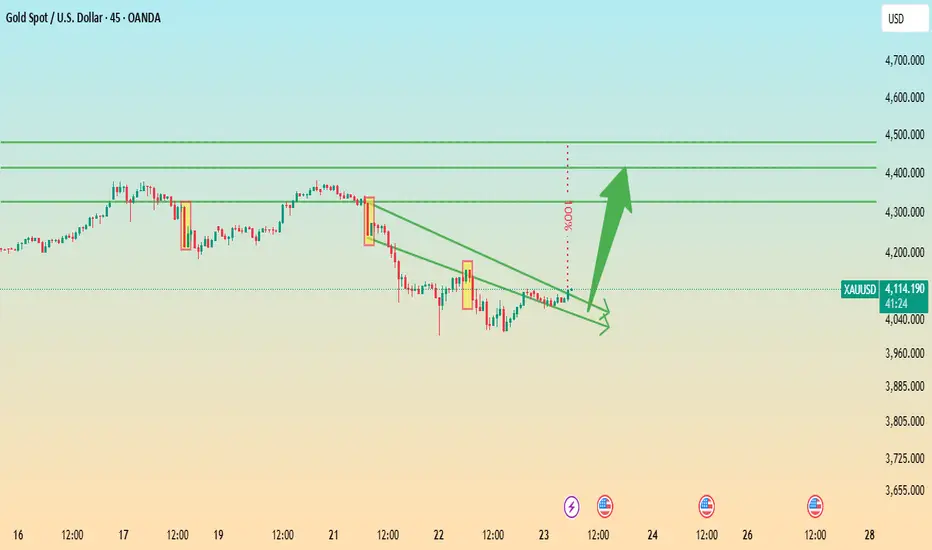
Gold Breakout Potential: Descending Wedge Signals Bullish ReversAnalysis:
The XAU/USD (Gold vs. USD) chart on the 45-minute timeframe shows price action forming a descending wedge pattern, a typically bullish reversal formation. The price has been compressing between lower highs and lower lows but is now testing the upper trendline resistance, indicating a possible breakout.
Key observations:
Trendline Breakout Zone: The narrowing wedge suggests weakening bearish momentum. A confirmed breakout above the trendline could trigger strong upward momentum.
Targets: The projected upside targets are around 4,300, 4,400, and 4,500, aligning with previous resistance zones.
Support Zone: Immediate support remains near 4,050–4,000, where the lower wedge boundary provides buying interest.
Momentum Indicator: Gradual bullish recovery and decreasing downside pressure indicate renewed buyer strength.
GoldXAUUSD
- Change of Characteristics
- Strong Bullish Trend Line
- Completed " 12345 " Impulsive Waves and " ABC " Corrective Waves
- Order Block
- RSI - Divergence
