Gold (XAU/USD) Potential Bullish Reversal Setup – Entry Zone For**Analysis:**
The chart illustrates a possible bullish reversal scenario after a recent downward move in Gold (XAU/USD). The marked *Change of Character (ChoCH)* indicates an early sign of a trend shift from bearish to bullish momentum.
Price has entered a **consolidation zone** near the support area, where the **entry level** is highlighted. This zone suggests accumulation and potential preparation for an upward move.
The setup shows:
* **ENTRY:** Around current support, within the highlighted range.
* **STOP:** Below the recent low, providing risk control if the reversal fails.
* **TARGET:** The projection points to a **100% measured move**, aligning with a strong bullish continuation potential toward 4,700 levels.
If price maintains structure and confirms a breakout above the short-term resistance, it may initiate a new **bullish impulse phase**.
Xauusdidea

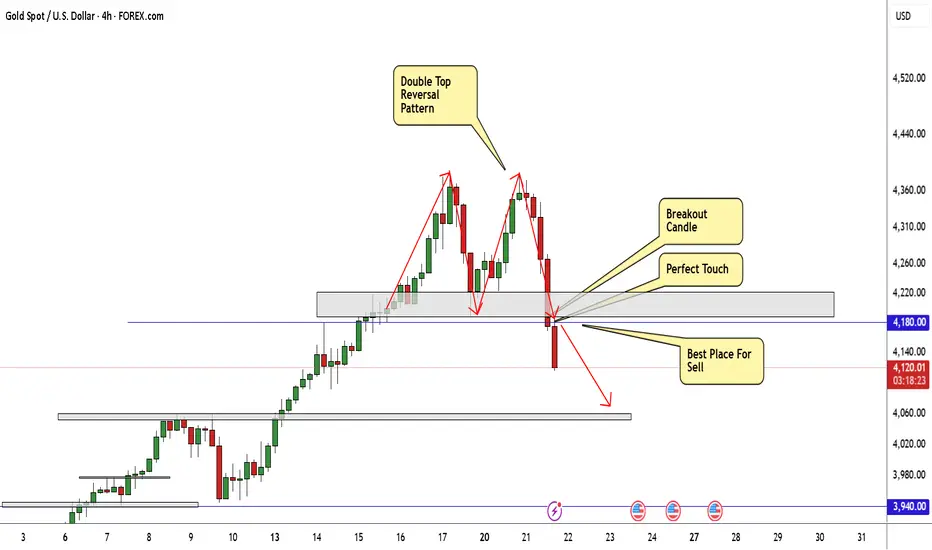
GOLD Finally Made Reversal Pattern , Short Setup To Get 400 PipsHere is my 4H Chart On GOLD , And finally the chart made a reversal pattern The price creating a very clear reversal pattern ( double top) and the price made a very good bearish price action now from good res area so we can enter a sell trade after the price back to retest the neckline to can use a small stop loss and targeting 200 to 400 pips , this is a good bearish movement after this massive movement to upside without any correction , so we will sell this pair for the next weeks .
Gold Trade Set Up Oct 21 2025Gold failed to create ATH last night during Asia session and dumped hard shifting to a bearish structure during London session. So now i will mostly be looking for sells. If we get a 15m close under most recent swing low 4214 i will want to see 5m BSl swept at at 4233 before looking for sells but if price closes above 4214 and makes HL on the 15m i will look for short term buys into 5m supply and BSL at 4260 before looking for sells again

4365 Achieved Excellent profits Booked [1350 PIPS Gained]Thanks to traders who followed and stay Active with me on bullish rally
As highlighted in yesterday’s session update:
My Position:
The ongoing bull rally has played out perfectly, with both of my targets achieved ahead of schedule. I identified strong support around $4,220 & 4190 along condition H4 Candle for bullish rally. Iinitiated aggressive swing buys from that zone. When $4,190 was retested, I held off for a healthy pullback before re-entering.
At $4205& $4,225, I scaled in aggressively (four entries) aiming for $4,345, which was reached — locking in solid overnight gains.
I’m pleased with the overall performance during this multi-month bullish phase and plan to keep accumulating on dips until the $4,490 level is reached from my main re-entry zones.
Additional Tip:
Once again, I caution traders — avoid counter-trend selling.
Many get trapped trying to short Gold in a strong uptrend. Stay aligned with the trend — it’s still firmly bullish.🚀

Elliott Wave Analysis – XAUUSD (October 21, 2025)
🔹 1. Momentum
H4:
H4 momentum is currently turning bearish, indicating that the main trend for today is downward.
H1:
H1 momentum is stuck in the oversold zone, suggesting that price could continue to fall, but at the same time, there’s a risk of a short-term bullish reversal — this should be monitored carefully.
M15:
M15 momentum is also turning bearish, confirming the potential for short-term downside continuation.
🔹 2. Wave Structure
H4 timeframe:
The current price structure likely forms a Flat correction (W–X–Y in blue) as part of wave 4 (in purple).
The X wave appears completed, and price is now in the declining phase of wave Y.
Wave Y may develop in three possible forms:
Zigzag
5-wave impulsive
Triangle
👉 In Zigzag or 5-wave formations, the target is usually equal to wave A.
👉 In a triangle, price may build higher lows, respecting the upper boundary connecting wave 3 and wave X.
H1 timeframe:
The H1 structure mirrors H4, but note that H1 momentum remains in the oversold zone, meaning an upward reversal could occur anytime.
M15 timeframe:
Used mainly for entry timing.
Since H4 momentum trend is bearish, we will prioritize Sell setups, especially after liquidity retests or breakdowns on the M15 chart.
🔹 3. Trading Plan
Main bias: Bearish (following H4 momentum)
Strategy:
Focus on Sell setups when price retests or breaks below liquidity zones.
Consider Buy setups only if price reaches the 4190 support area, signaling a potential end of wave 4 (purple) and the start of wave 5 (bullish).
Buy setup (if wave 4 completes):
Buy zone: 4193 – 4190
Stop loss: 4180
Take Profit: 4236
🔹 4. Alternative Scenarios
If price breaks sharply above 4381, the current wave count will be invalidated, and price could head toward 4451.
If price forms a triangle, with 4381 as the upper boundary and higher-low supports forming the lower edge, a breakout above 4381 would signal a Buy opportunity.

Gold Trade Set Up Oct 20 2025Price has pushed up during London and swept BSL and is now testing a resistance area and 75 fib. If price stays closes under and make bearish structure on the 15m i will look for sells down towards SSL but if price closes above resistance and continues to make bullish structure on the 15m the target will be PDH

XAUUSD extennded Setup [already up 390 pips]XAUUSD holding the Rangebound from 4230-4270. As we mentioned in our morning Setup we took buy from 4225 and 390 pips floating in profits.
What are my conditions For Today's NY session?
Currently if we look for another buy trade we have to wait for closing of m30-H1 candle above 4270 and on retest we can took buy .
Targets: 4305 - 4328-4345.
Additional Tip:
Keep in mind H4 closed below 4230 then stay away from Buy

Elliott Wave Analysis XAUUSD – October 19, 2025
1️⃣ Momentum
D1 Timeframe:
Daily momentum is showing early signs of bearish reversal.
As mentioned in the previous plan, a daily reversal could occur on Friday or Monday.
The strong bearish D1 candle on Friday reinforces this signal.
If another bearish D1 candle appears on Monday, it will confirm that the main trend for the coming week is likely to turn bearish, pushing D1 momentum toward the oversold zone.
H4 Timeframe:
H4 momentum is preparing to turn upward, suggesting that the initial downside movement on Monday may not be too strong.
A short-term recovery bounce is likely.
However, if this bounce fails to break the previous high and momentum reverses downward again, it will confirm the start of a more stable downtrend.
H1 Timeframe:
H1 momentum is currently in the overbought zone, which indicates a short-term pullback may occur early in Monday’s session.
2️⃣ Wave Structure
D1 Structure:
We can see a strong bearish candle — the largest since the beginning of the uptrend, signaling the first warning of exhaustion.
Together with the D1 momentum reversal, this suggests the yellow wave 3 is likely coming to an end, and yellow wave 4 is starting to form.
In terms of time, wave 4 could take more than a week to complete.
H4 Structure:
A sharp decline has pushed the price back inside the ascending channel, indicating that the extended wave 5 may have already ended.
If confirmed, the market could continue down toward at least the previous blue wave 4 area.
However, because H4 momentum is preparing to rise, a short-term upward correction may occur early Monday.
If this upward move is slow and overlapping, fails to break the previous high, and H4 momentum turns down again, that will confirm the completion of blue wave 5.
H1 Structure:
On the H1 chart, the blue wave 5 from H4 is detailed into five smaller red waves.
The recent steep and fast decline suggests a five-wave bearish pattern, possibly wave 1 of a new downtrend or wave A of a corrective move.
There is also a possibility of a Flat correction, where wave C extends to 1.618 × wave A (as discussed in the October 17 plan).
Overall, the market may present a short-term recovery bounce, providing a buy opportunity early in the week.
3️⃣ Trading Plan
Buy Zone: 4153 – 4151
Stop Loss: 4141
Take Profit: 4193
Alternative Scenario:
If price fails to break below 4193, monitor H1 momentum as it enters the oversold zone and turns upward — that will be a potential buy signal.
In that case, key support areas to watch include: 4243 – 4226 – 4207 – 4194.

XAUUSD EXTENDS BULLISJH MOMENTUM TOWARDS $4350 & $4450 TARGET.Technical Overview
Current Price: $4,292.85
Support Zone: $4,000 – $4,050
Resistance Zone: $4,450 – $4,500
Trend: Bullish (ascending channel)
🔹 Chart Analysis
The price is moving steadily inside the upward channel, respecting both upper resistance and lower support trendlines.
A short-term retracement may occur near the $4,350 zone (first target), aligning with mid-channel resistance before continuing toward the final target around $4,432–$4,450.
The market shows strong bullish candles, confirming buying pressure with limited corrective dips.
The support base near $4,150 remains strong — as long as this zone holds, the bullish trend is expected to continue.
🔹 Price Targets
First Target: $4,350
Final Target: $4,432 – $4,450
Stop-Loss (if trading): Below $4,200 (trendline support)

Elliott Wave Analysis – XAUUSD (17/10/2025)🔹 1. Momentum
D1 Timeframe:
The D1 momentum is now fully in the overbought zone → the probability of a reversal is very high.
A corrective move could occur either today or on Monday next week.
H4 Timeframe:
H4 momentum has been sticking together in the overbought zone.
Currently, there are about 5 candles holding the oscillator at this level — typically, 5 to 8 candles mark a potential reversal cycle.
H1 Timeframe:
H1 momentum is still rising → price may extend slightly higher or move sideways to accumulate before a clearer signal appears.
________________________________________
🔹 2. Wave Structure
D1 Chart:
The recent D1 candles are steep and impulsive, showing strong bullish pressure — indicating we are likely in Wave 3 (yellow).
I’ve adjusted the wave labels for better accuracy with current price structure.
Once D1 momentum reverses, we can expect the start of Wave 4 (yellow) correction.
H4 Chart:
• Waves (1) and (3) in blue are similar in length → suggesting Wave (5) blue may become an extended wave.
• Since price has broken above the Elliott channel, we should wait for a strong downward reaction together with momentum reversal on H4 to confirm:
✅ Wave (5) blue is complete,
✅ and Wave (3) purple has also finished.
⇒ Then, the market would begin Wave (4) purple correction.
💡 Note: During an extended Wave (5), avoid selling against the trend.
Be patient and wait for the first downward move — if it’s not deep, then buying from the next pullback would be a more reasonable strategy.
H1 Chart:
Within the blue Wave (5) on H1, we can see a five-wave red structure developing, and price is now in red Wave (3).
Inside red Wave (3), there’s another five-wave black sub-structure, currently in black Wave (4).
By drawing the Elliott channel, we can see that black Wave (4) is likely forming a flat correction, and one final small drop may still occur to complete the structure.
🎯 Ideal Target Zone:
• The high-liquidity area around 4297.
• This is a likely completion zone for the current flat pattern.
• If price doesn’t reach that level, we’ll use channel support confluence to identify the next valid entry area.
________________________________________
🔹 3. Trading Plan
Buy Zone: 4298 – 4296
Stop Loss: 4276
Take Profit 1: 4363

Gold Trade Set Up Oct 17 2025Price has tested a strong support for the third time and is respecting it so i am still bullish from this area to target BSL and ATH levels

XAUUSD Analysis todayHello traders, this is a complete multiple timeframe analysis of this pair. We see could find significant trading opportunities as per analysis upon price action confirmation we may take this trade. Smash the like button if you find value in this analysis and drop a comment if you have any questions or let me know which pair to cover in my next analysis.

Gold Bullish Continuation Toward 4,300 TargetTrend Direction: The overall structure is clearly bullish, with price continuing to rise after breaking previous resistance levels.
Price Action: After a strong impulsive move upward, a small corrective phase (pullback) is visible — represented by the zigzag arrow — suggesting a healthy retracement before continuation.
Key Zone: The highlighted blue-green box marks a demand or fair value gap (FVG) region where buyers previously entered strongly, likely acting as a support area for future pullbacks.
Current Price: Around $4,195.84, maintaining bullish momentum.
Target: The projection line points toward a target zone near $4,300, indicating the next resistance or profit-taking level.
Overall Sentiment: Bullish continuation toward the upper target, provided the price sustains above the previous support zone around $4,100–$4,000.

Gold (XAU/USD) Breakout Rally Toward New Highs!Analysis:
Gold (XAU/USD) continues its strong bullish momentum on the 4-hour chart, forming a series of higher highs and higher lows, confirming a sustained uptrend. The recent breakout above the resistance zone near $4,150–$4,170 indicates renewed buying interest and momentum buildup.
After a brief retest of the breakout area, price has started climbing again — a sign of trend continuation supported by bullish candle formations and strong market sentiment.
Technical Outlook:
Support Zone: $4,140 – $4,170 (previous resistance turned support)
Bullish Confirmation: Continuation pattern with clean structure and volume support
Momentum Bias: Strongly bullish while above $4,150
🎯 Target: $4,300 – $4,320 zone
🛑 Stop Loss: Below $4,140 to limit downside risk
📈 Summary:
As long as gold stays above the breakout level of $4,170, the market remains bullish, with upside potential toward $4,300–$4,320, aligning with the next major resistance area.

Gold Trade Set Up Oct 16 2025Gold is trading above PDH and broke structure on the 1h creating a new HH but i first want to see a sweep of SSL/London lows followed by a 15m bullish candle close to then a push higher to ATH

Gold Maintains Upward Channel Toward $4320 TargetAnalysis:
The XAU/USD 45-minute chart shows gold continuing its steady rise within a well-defined ascending channel. The price action maintains higher highs and higher lows, confirming a sustained bullish trend.
Currently, gold is testing the midline of the channel, suggesting a possible minor pullback before resuming upward momentum toward the projected resistance near $4320. This level aligns with the upper boundary of the channel, acting as the next potential target zone for buyers.
As long as the price remains above the lower channel support, the bullish structure remains intact. A breakout above $4320 could open further upside potential, while a drop below the channel could signal early weakness or short-term consolidation.

XAUUSD have two zones of BUYXAUUSD is still on bullish Bias and holding rising wedge pattern although consolidation zone from 4190-4230
What are my conditions For Today's session?
✳️ Currently market is bit tricky for scalpers and retailers
- if H1-H4 candle closes above the mentioned upper zone 4235-4245 then
My target will be $4274 & 4290 In extension !!
✳️ if Market remains low 4235 then we'll have Retracement towards 4190 in the Rangebound market
Additional Tip:
-BUY the Dips
OR

XAUUSD is in buy area!Price level 4205.00 is a strong liquidity sweep showign up a momentum gain on GOLD to reverse from this long term support level gold has started to bounce off the level.
As daily and long term trend continue to be bullish price is highly likely to continue to remian upside with another momentum gain from this support level. A bullish trade is high probable from the long term support level.

XAUUSD Delivered Excellent profits [600 PIPS]
Thanks to those who followed, trusted me, and made profits.
As I mentioned in today’s commentary session:
• I took buy trades around 4190-4180, and I’m expecting the market to test the 4240 benchmark, with an extension towards 4275.
My strategy was to buy the dips, and I’m very happy with the profits so far – .
My first target (4240) is achieved, Alhamdulillah.
**Additional Tip:**
Selling against the current bullish bias isn’t advisable, I will buy the dips and wait for the new Setup

Gold: Breaks through 4200 to hit a new all-time high📈Gold has once again refreshed its all-time high, supported by escalating concerns over U.S.-Asia trade and expectations that the Federal Reserve may cut interest rates twice more within the year.
📝The strong rally of gold this time is mainly driven by two key factors:
First, global trade worries have intensified. U.S. President Trump stated on Tuesday that he might suspend edible oil trade with Asian countries—a move that triggered a sharp surge in market safe-haven demand. In response, Asian countries have warned of retaliatory measures, further worsening trade tensions.
Second, expectations for Fed rate cuts have heated up. Federal Reserve Chair Jerome Powell hinted at another 0.25-percentage-point interest rate cut this month, and the market generally expects two rate cuts to be implemented within the year. The low-yield environment has significantly reduced the opportunity cost of holding non-interest-bearing assets, providing sustained support to the precious metals market.
In today’s early session, gold bulls stabilized in the 4140 zone and gained momentum again. As of now, gold has broken through the $4,200 mark to reach a new all-time high. For gold’s current trend, we remain bullish, with upside targets at 4,300 and 4,500. Do not attempt to predict the top until there are clear signs of a peak. Undoubtedly, the primary trading strategy remains "buying on dips." Key support levels to watch include today’s intraday low and the short-term uptrend support that has been in place since 4,090. If this support holds, the bullish momentum will remain strong and gold will continue to hit new highs. Key resistance zones to focus on above are 4,210–4,215, followed by 4,245–4,240.
Nevertheless, investors must closely monitor changes in geopolitical situations and signals from the Federal Reserve, adjust strategies flexibly, and strictly control risks.
💎Buy 4160 - 4165
TP 4180 - 4190 - 4200
SL 4150
Daily-updated accurate signals are at your disposal. If you run into any problems while trading, these signals serve as a reliable reference—don’t hesitate to use them! I truly hope they bring you significant assistance

Gold Market Update (Easy to Understand!)Gold’s still shining bright; it’s in a bull market, meaning prices are mostly going up 🟢.
But even in a bull market, prices can dip before the next big move. Here’s what could happen next:
📉 If gold falls below 4205, we could see it slide down to 4184 or even 4181.
📈 After that, it might climb again toward 4252, maybe even 4279.
💪 But if gold breaks above 4239, it could keep running up right away!
👉 The big picture: gold still looks strong long-term; just expect a few short dips along the way.
Want to know where I see gold going next and how to trade around these levels?
💬 DM me “GOLD” and I’ll share my next target before it hits the charts. 🚀
Mindbloome Exchange
Trade What You See, Not What You Think

Elliott Wave Analysis – XAUUSD (16/10/2025)
🔹 MOMENTUM
D1:
Currently, the daily momentum has formed five consecutive bullish candles and is now approaching the overbought zone.
👉 This indicates a high probability of a correction within the next 1–2 days.
H4:
Momentum on H4 is still rising.
Today, the price may continue to climb slightly or move sideways to push H4 momentum into the overbought zone before a potential reversal.
H1:
Momentum on H1 is also nearing the overbought zone, suggesting that a short-term pullback could occur during the Asian session.
________________________________________
🔹 WAVE STRUCTURE
D1 Chart:
The structure remains within an extended Wave (5).
With D1 momentum about to enter the overbought area and this bullish phase already lasting for five candles, there is a strong chance of a correction today or tomorrow.
H4 Chart:
The price is currently in orange Wave (5), while purple Wave (3) is still unfolding.
Since H4 momentum is rising, price may extend slightly higher or consolidate sideways before a possible reversal.
H1 Chart:
Price is now in yellow Wave (5), where five minor blue waves have been completed.
The price zone around 4242.89 corresponds to the 0.618 Fibonacci retracement of blue Waves 1–3.
Within blue Wave (5), we can also count five smaller black sub-waves, and interestingly, 4242.89 again aligns with the 0.618 Fibonacci level of black Waves 1–3.
➡️ This creates a strong resistance area, from which a deep correction forming purple Wave (4) is highly possible.
________________________________________
🔹 TRADING PLAN
• Avoid holding long positions for too long — this stage is best suited for short-term scalp trades.
• Focus on observing price action and waiting for a confirmed top formation before planning any Swing setups.
• Sometimes, staying on the sidelines is the best strategy.
👉 I will update the Swing signal once a clearer confirmation appears.

New zone for xauusd Gold (XAU/USD) is showing strong bullish momentum, trading around 4164 with potential continuation toward the 4236 resistance. Price may retest the fair value zone near 4150 before pushing higher, while support remains around 4091.
