XAUUSD: Next - week forecastOver the past week, gold rebounded sharply after a sharp decline, formed a "double-bottom" pattern, and regained the 4,000 level, with clear short-term support.
We predict that next week gold will oscillate upward in the range of 3,960 - 4,080, gradually rise relying on trendline support, and is expected to test the resistance at 4,050 during the week. If it breaks through with increased volume, it will target 4,100 resistance level.
However, at the same time, we need to closely monitor Fed policy and geopolitical risks as core variables, because macro events may become the key to breaking the balance.
Xauusdidea

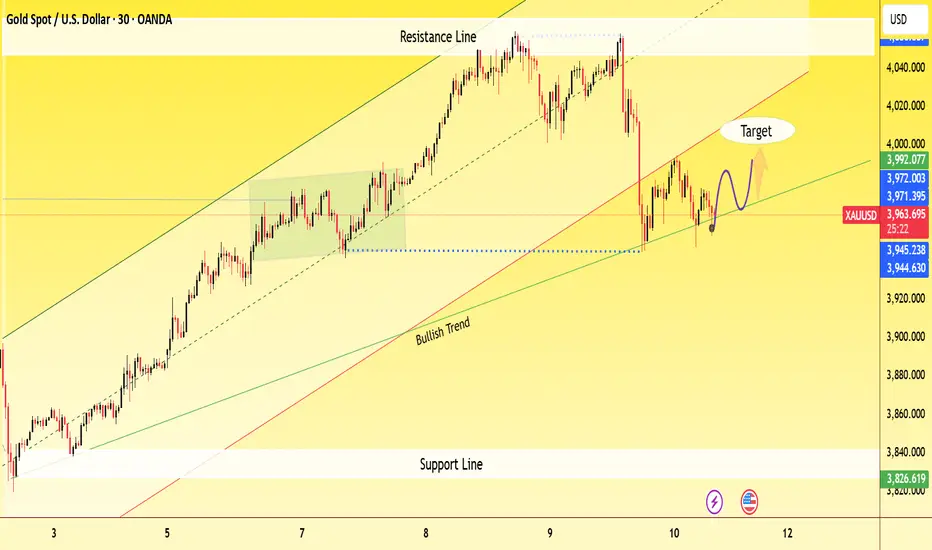
GOLD POISEDFOR BULLISH AS PRICE HOLDS ABOVE KEY TRENDLINE SUPPOR🧭 General Overview
Instrument: Gold Spot / USD (XAU/USD)
Timeframe: 30-minute
Current Price: 3,958.59
Trend: Overall bullish, but showing short-term correction
📊 Key Technical Elements on Chart
1. Bullish Trendline
The green upward trendline labeled “Bullish Trend” indicates that gold remains in a long-term uptrend.
Price is currently testing this bullish trendline — a crucial support area.
2. Resistance Zone
The resistance line near 3,992–4,000 marks the recent swing high where price was rejected.
Each approach to this zone triggered a pullback, indicating strong selling pressure ther
Gold Trade Set Up Oct 10 2025Price has shifted into bearish structure yesterday and is trading in between a 15m demand and supply so i would want to see price tap into demand to go higher into supply before continuing down
www.tradingview.com

Gold: high throw and bargain huntingGold showed a trend of "opening higher, moving lower, and then staging a weak rebound" on the day. It touched an intraday high of 3,994.22 per ounce and a low of 3,946.59 per ounce. After the opening, the gold price kept declining, and although it rebounded with support at the low level, it had not yet recovered the opening price. Currently, trading volume data indicates moderate market activity without obvious volume expansion signals, suggesting that the current oscillating trend may continue.
It is expected that the gold price will oscillate within the range of 3,940-4,000. If the US Dollar Index continues to surge and break through the resistance level of 99.5, the gold price may test the support at 3,940 again; if the US Dollar pulls back, the gold price is expected to surge above 3,995.
It is advisable to adopt a "high throw and bargain hunting" strategy within the range of 3,940-4,000, and strictly set stop-loss and take-profit levels with a suggested take-profit range of 8-12 and a stop-loss range controlled within 5-8, while avoiding blind chasing of rallies or selling on declines.
Buy 3950 - 3960
TP 3970 - 3980 - 3990
SL 3945 - 3942
Daily-updated accurate signals are at your disposal. If you run into any problems while trading, these signals serve as a reliable reference—don’t hesitate to use them! I truly hope they bring you significant assistance

Elliott Wave Analysis – XAUUSD (10/10/2025)
________________________________________
🔹 1. Momentum
In the October 9th plan, based on H1 momentum and wave structure, I anticipated a strong bearish move, which indeed occurred during yesterday’s late session.
D1 Momentum:
Currently turning downward, meaning the main trend in the coming sessions remains bearish to bring D1 momentum into the oversold zone.
H4 Momentum:
Now showing signs of reversal from the oversold area, suggesting that a short-term recovery wave may appear soon.
H1 Momentum:
Currently approaching the oversold zone, so within the next 1–2 hours, a minor corrective upward move could take place.
________________________________________
🔹 2. Wave Structure
D1 Wave Structure:
We can now see a confirmed bearish reversal candle, whose body is larger than previous bearish candles.
This indicates that the yellow wave ⑤ has likely completed, and I expect a deeper corrective move to unfold — potentially reaching the 3700 area.
H4 Wave Structure:
As mentioned yesterday, we use the price channel for observation, and now the price has closed back inside the channel.
This gives us additional confirmation that wave ⑤ has completed.
With H4 momentum preparing to turn upward, the market is likely to form a corrective upward wave on this timeframe.
H1 Wave Structure:
Currently, a blue ABC correction has formed after yesterday’s strong decline.
Notably, wave C is twice the length of wave A, showing that the panic selling yesterday may have exhausted the sellers.
Combining this with the H4 momentum reversal, it suggests a potential upward move ahead.
Furthermore, after a complete ABC structure, according to Elliott theory, the market often forms another ABC pattern or a 5-wave structure in the opposite direction,
→ therefore, we will now look for Buy opportunities.
________________________________________
🔹 3. Liquidity Zones
Observing the liquidity areas on the chart, there are two key zones to focus on:
• 3953
• 3933
These are the two zones where we will look for Buy setups.
Yesterday’s oversold decline (an irregular wave C) suggests, by Elliott principles, that a strong rebound from the 0.618 retracement up to the previous high is likely —
this will be important for determining our Take-Profit levels.
________________________________________
🔹 4. Trading Plan
Buy Zone 1:
• Entry: 3956 – 3953
• SL: 3943
• TP: 3989
Buy Zone 2:
• Entry: 3934 – 3931
• SL: 3922
• TP: 3953
________________________________________
💡 Note:
This rebound is a technical correction after an oversold sell-off, so it’s recommended to monitor price reaction near TP and consider moving SL to breakeven to secure profits.

Gold (XAU/USD) Rebound Setup – Support Holding StrongAnalysis:
Gold (XAU/USD) is showing signs of bullish strength after testing the $4,000–$3,970 support zone, where buyers are stepping back in. The recent consolidation above support suggests a potential reversal and continuation of the uptrend.
The setup highlights:
Support Zone: Around $3,970 – $4,000, acting as a key accumulation area.
Bullish Trigger: A breakout above minor resistance could drive momentum higher.
Targets:
🎯 Target 1: $4,101
🎯 Target 2: $4,150
🎯 Target 3: $4,200
Stop Loss: Below $3,970 to protect against a downside breakout.
📈 Outlook: As long as price sustains above support, Gold remains bullish, aiming for a breakout towards $4,150 and $4,200 levels.

Gold Trade Set Up Oct 9 2025Price is currently at a resistance so i will wait for a 15m BOS to the upside followed by a demand tap to take it higher or a 15m CISD to the downside to take to SSL
www.tradingview.com

Gold Eyes New Highs Within Ascending ChannelAnalysis:
The XAU/USD 1-hour chart shows gold trading firmly within an ascending parallel channel, maintaining a clear pattern of higher highs and higher lows — a hallmark of sustained bullish momentum.
Currently, price action is consolidating near the mid-level of the channel, preparing for a potential breakout toward the upper boundary near $4,110–$4,120. The projected path (blue arrows) suggests a minor retracement or sideways move before buyers push prices higher again.
As long as gold remains above the lower channel support around $4,000–$3,990, the bullish outlook stays intact. A confirmed breakout above the upper boundary could open the door for a new leg upward, supported by ongoing momentum and strong market sentiment.
Key Levels:
Resistance: $4,110 – $4,120
Support: $3,990 – $4,000
Trend Bias: Bullish within ascending channel

Gold: Long-short divergence is emergingGold exhibited a consolidative trend today, with the 4000-4050 range providing significant support. After touching an intraday low of 4001, prices rebounded sharply—indicating robust buying interest in this interval.
Resistance is concentrated between 4045-4050. While gold remains in a strong zone above 4000 in the short term, the rate of increase has narrowed compared to previous sessions. Long-short divergence is emerging, warranting caution against pullback risks following rallies.
Market expectations for a 25-basis-point rate cut by the Federal Reserve in November remain uncertain, and this ambiguity has led to the oscillating trend in Gold. If subsequent economic data (e.g., inflation and employment figures) reinforce rate cut expectations, the U.S. Dollar Index may weaken further, potentially allowing gold to break through the 4050 resistance level and advance toward the 4070-4100 range. Conversely, if rate cut hopes fade, prices may retrace to the psychological 4000 level to seek support.
Buy 4000 - 4010 TP 4020 - 4030 - 4040
Daily-updated accurate signals are at your disposal. If you run into any problems while trading, these signals serve as a reliable reference—don’t hesitate to use them! I truly hope they bring you significant assistance

Gold: Continue its rally to reach an all-time highGold has successfully stood firm above the key psychological level of 4000, continuing its rally to reach an all-time high. From the perspective of capital flows, although specific position data is lacking, the price-volume surge following the breakthrough,evidenced by both New York Gold and London Gold recording "rising prices with increasing trading volume" that confirms the continuous inflow of safe-haven funds. Additionally, the seasonal upward momentum of gold in October has not yet faded, and the momentum-driven uptrend continues, further strengthening the confidence of bullish investors.
The 4000-4050 range has been effectively broken through, and this former resistance level has now transformed into a short-term support level. If gold can maintain a stable position above 4050 in the subsequent sessions, the next target range can be set at 4100-4150. For short-term support, focus on the key psychological level of 4000; a breakdown below this level may trigger a pullback to the 3950-3980 range.
Buy 4010 - 4020 TP 4030 - 4040 - 4050
Daily-updated accurate signals are at your disposal. If you run into any problems while trading, these signals serve as a reliable reference—don’t hesitate to use them! I truly hope they bring you significant assistance

Gold: Reach a new highGold has successfully stood firm above the key psychological level of 4000, continuing its rally to reach an all-time high. From the perspective of capital flows, although specific position data is lacking, the price-volume surge following the breakthrough,evidenced by both New York Gold and London Gold recording "rising prices with increasing trading volume" that confirms the continuous inflow of safe-haven funds. Additionally, the seasonal upward momentum of gold in October has not yet faded, and the momentum-driven uptrend continues, further strengthening the confidence of bullish investors.
The 4000-4050 range has been effectively broken through, and this former resistance level has now transformed into a short-term support level. If gold can maintain a stable position above 4050 in the subsequent sessions, the next target range can be set at 4100-4150. For short-term support, focus on the key psychological level of 4000; a breakdown below this level may trigger a pullback to the 3950-3980 range.
Buy 4010 - 4020 TP 4030 - 4040 - 4050 SL 4000
Daily-updated accurate signals are at your disposal. If you run into any problems while trading, these signals serve as a reliable reference—don’t hesitate to use them! I truly hope they bring you significant assistance

Gold Trade Set Up Oct 8 2025Price has pushed well above PDH and created a new ATH once again so as long as the 15m support holds i will be looking for a BOS on the 15m and retest into a 5m/15m demand to take buys higher
www.tradingview.com

gold on sellThe price of XAUUSD has recently reached a new high of 4049, and we are currently awaiting a breakout below 4029 for a bearish confirmation. If the price breaks below 4027-4025, it is likely to target the lower price of 4020. If this target is achieved, it may be possible to retrace on a buy, but if the price breaks below 4018, it could potentially reach 3984. The stop loss should be set at 4040. If the price closes above 4050 on a long candle, it would be advisable to consider a buy.

Gold Maintains Bullish Momentum Within Ascending ChannelAnalysis:
The XAU/USD (Gold Spot) 1-hour chart shows a strong upward trend within a well-defined ascending channel. Price action continues to form higher highs and higher lows, indicating sustained bullish momentum.
Currently, gold is trading near $3,959, staying comfortably above the trendline support, which has repeatedly acted as a dynamic base for buyers. The projected movement (blue arrow) suggests a potential short-term retracement toward the lower channel boundary, followed by a rebound toward the upper resistance zone around $4,000–$4,035.
As long as gold remains above the trendline, the bullish structure remains intact. A breakout above the upper boundary could signal further upside potential, while a drop below the trendline may lead to short-term consolidation.
Summary:
Trend: Bullish
Support: $3,915 – $3,925 (trendline zone)
Resistance: $3,995 – $4,035
Bias: Buy on dips near trendline support for potential continuation toward new highs.

XAU/USD Bullish Setup Toward 4115XAU/USD is trading around 4038, holding bullish momentum with support near 4032. Price targets are set at 4060 and 4087, with potential to reach a new ATH at 4115 if buyers maintain strength.

"Gold 'Buy the Dip' Opportunity Targeting the $4,000 Level"
Technical Analysis
This is a classic bullish continuation setup. Here's a breakdown of the key elements:
Prevailing Trend: The chart shows a strong bullish impulse wave, indicated by the series of large green candles. This establishes the short-term trend as upward.
Corrective Pullback: After reaching a local high (around $3,980), the price is currently in a corrective phase, pulling back towards a potential support level. This is normal and healthy price action in an uptrend.
Support Zone: The red rectangle you've highlighted from approximately $3,950.00 to $3,956.00 is a well-defined area of potential support. This zone represents a previous level of consolidation and the base of the last major push upwards, making it a likely area for buyers to step back in.
Trade Idea: The projected path you have drawn suggests an expectation that the price will dip into this support zone, find buying pressure, and then continue its upward trajectory. This is often referred to as a "buy the dip" strategy.

Gold Trade Set Up Oct 7 2025Price has swept PDH, formed a LL and has now tapped 1h supply so i am expecting price to make bearish structure on the 5m-15m to sell to previous 1h swing low and daily FVG that has to be filled
www.tradingview.com

GOLD Best Places To Buy And Sell Cleared , 500 Pips Waiting !Here is m y opinion on GOLD On 30 Mins T.F , We have a Huge movement To Upside since Last 6 weeks , started between 3870.00 to 3980.00 so we can buy and sell Gold This Week from 2 areas , 3940.00 will be the best place for Buy and 3975.00 will be the best place for Sell , now the price very near buy area so we can wait the price to retest the support area and then enter a buy trade and targeting 3975.00 and when the price touch it and give us a good bearish P.A , we can enter a sell trade and targeting 3940.00 , It`s All Depend On Price action . I`m Sure that the main direction now is buy so i`m interesting to buy gold from 3940.00 but the best place for me will be 3895.00 cuz the price didn`t retest it until now and you can check my analysis about 3895.00 , so my res area it should be a scalping trade but my main focus will be on buy gold until end of the year .
Entry Reasons :
1- Highest Level The Price Touch It
2- Broken Res
3- New Support Created .
4- Clear Price Action .
5- Clear Support & Res .

gold on sideways untill limit breakout#XAUUSD price have rebound above 3977, now we expect and wait for M15 closure breakout before we can buy or sell.
Below the 3950 limit on M15 closure, price will continue bearish till the 3909, stop loss 3961.
Above 3967-3971 on M15-M30 closure price will move on buy till the 3991 limit.

Elliott Wave Analysis – XAUUSD (October 7, 2025)📊
________________________________________
🔹 Momentum
D1 Timeframe:
Yesterday’s D1 candle closed and confirmed that the upward move is still continuing.
However, momentum has started to turn in the overbought zone, indicating that the upside move may not last long — this is a typical overextension signal, often seen at the top of a wave.
H4 Timeframe:
Momentum on H4 is reversing in the overbought zone, meaning the short-term uptrend can still continue today, but traders should be cautious as this is a sensitive area for potential reversals.
H1 Timeframe:
Momentum on H1 is turning upward, suggesting there could be one more short-term bullish push before exhaustion.
➡️ Conclusion:
Over the past few days, price has diverged from momentum across multiple timeframes — a classic sign of a potential top formation.
👉 Be extremely cautious with long-term positions.
________________________________________
📈 COT (Commitment of Traders) Analysis
Commercials:
Currently 18% Long / 82% Short — this means hedgers are heavily shorting to protect against downside risk.
This behavior is typically seen at major tops.
Institutional Traders:
Holding 83% Long / 17% Short, showing extreme bullish sentiment among large funds.
Such sentiment often appears near market peaks.
Retail Traders:
69% Long / 31% Short, indicating that retail traders are FOMO-buying, which reflects a classic crowd behavior at the top.
🧭 Summary:
The current COT data strongly warns of a potential top formation in the market.
Notes:
• Commercials: Hedgers trading against the main trend to reduce business risk.
• Institutionals: Large speculative funds trading with the main trend.
• Retail Traders: Small investors, usually following market emotion.
________________________________________
🌊 Wave Structure
D1 Timeframe:
Price remains within wave 5 (yellow).
Momentum is in the overbought zone, so a correction could occur anytime.
→ For now, use the wave structure and price channel to observe potential topping reactions.
H4 Timeframe:
Wave 5 (purple) is approaching the Fibonacci 0.618 target around 3986.
Combined with D1 momentum still slightly rising within the overbought zone, price may continue higher for 1–2 more days before turning down.
According to additional H1 measurement, the second target lies at 4006.
H1 Timeframe:
The 5-wave (black) structure has been relabeled based on the latest data.
Calculated projection shows Wave 5 = 0.618 of Waves 1–3, targeting 4006.
→ The potential target zone is 3985 – 4006.
Currently, momentum divergence against price is developing — this typically happens in the final wave of a trend.
Combined with COT’s top warning, the market is now slow and choppy, consistent with a distribution and topping phase.
________________________________________
🧭 Trading Plan
• Maintain strict discipline at this stage.
• Reduce position size and avoid holding long-term trades.
• Wait for clear top confirmation before planning the next swing setup.
________________________________________
👉 Summary: Wave 5 is likely completing. Both momentum and COT warn of a potential top — stay patient, observe reactions, and avoid large positions until a confirmed reversal appears.

Gold Bullish Momentum: Layering Longs For Maximum Gain!🏆 XAU/USD | The Gold Robbery Heist Plan (Swing/Day Trade)
🎯 Plan Setup (Bullish)
Entry (Layering Style):
Using the Thief Layer Strategy 🕵️♂️ → Multiple Buy Limit layers
$3625
$3630
$3635
$3640
(Add more layers based on your own strategy & risk appetite)
Stop Loss (Thief SL):
@3610 (Adjust based on your own strategy & risk ⚠️)
Take Profit (Escape Point):
Target resistance zone @3690 🚪💰
⚡ Note: This is a flexible thief-style plan — adjust SL/TP levels as per your personal money management and execution style.
📊 Why This Plan? (Thief’s Market Analysis)
🔎 Real-Time Market Data (10 Sept 2025)
Price: $3,643.71
24h Change: +0.48%
Range: $3,620.90 – $3,644.56
🧠 Retail Sentiment (Contrarian Signal)
Long: 37%
Short: 63%
➡️ Retail crowd is heavily short → Contrarian bullish setup.
🏦 Institutional Sentiment (Commitment of Traders)
Net Long: +249,530 contracts
Long: 315,796
Short: 66,266
➡️ Institutions are firmly positioned long ✅
🌡️ Fear & Greed + Volatility
Neutral (shifting from Greed)
VIX <14 (52-week low) → Calm market backdrop
📉 Macro & Fundamentals
US jobs data: Weak (22K vs. 75K expected)
Fed rate cut probability: 99.4% (September meeting)
Central bank gold demand + geopolitical tensions supportive
Upcoming CPI/PPI = key catalyst
📐 Technical View
Price holding above $3,625 support
Ascending channel continuation
Overbought zone = caution for short pullbacks
🗝️ Key Takeaways (Thief OG Notes)
USD weakness + Fed dovish tilt = Gold tailwind
Retail shorts = bullish contrarian setup
Institutions backing the move higher
Short-term overbought → manage exits smartly
🔥 Related Markets to Watch
OANDA:XAGUSD (Silver)
TVC:DXY (US Dollar Index)
SP:SPX (S&P 500)
TVC:US10Y (US 10Y Treasury Yield)
BITSTAMP:BTCUSD (Bitcoin correlation check)
✨ “If you find value in my analysis, a 👍 and 🚀 boost is much appreciated — it helps me share more setups with the community!”
#XAUUSD #Gold #Forex #SwingTrade #DayTrading #TechnicalAnalysis #Fundamentals #ThiefStrategy #TradingPlan #GoldBulls #MacroAnalysis #MarketSentiment

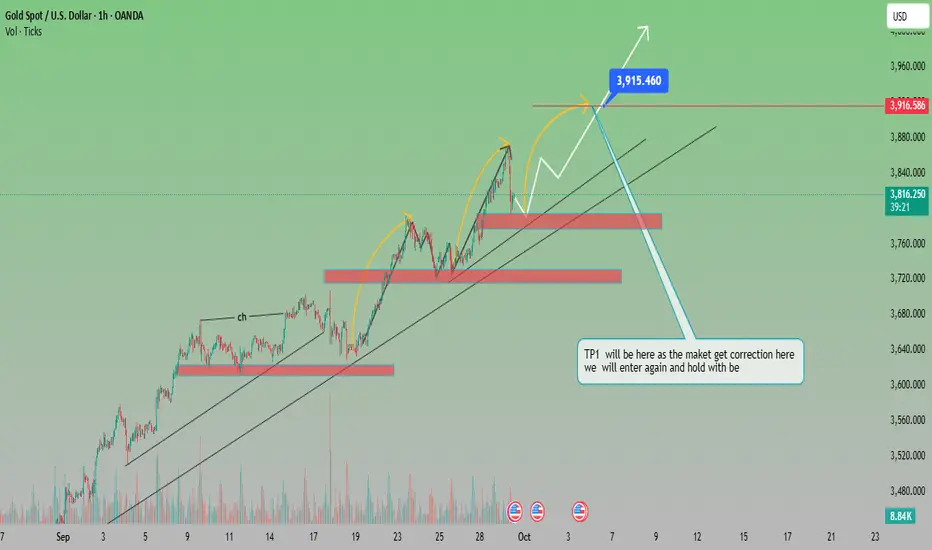
“Gold Price Action: Bullish Momentum with Key Correction Zones
Analysis of XAU/USD (Gold Spot)
The chart shows a clear uptrend channel, supported by higher highs and higher lows.
Price recently pulled back after testing the $3,915 zone, which is acting as a short-term resistance.
Multiple support zones are highlighted (around $3,760 and $3,700), which can provide strong buying opportunities on retracement.
The structure suggests impulse–correction–impulse movement, aligning with bullish continuation patterns.
Bullish Scenario
If price holds above the $3,760–$3,780 support, continuation towards $3,915 (previous high) is expected.
A breakout above $3,915–$3,920 will open the door for further upside, targeting $3,960–$3,980.
Bearish Scenario
If price breaks below the trendline support (~$3,760), deeper correction is possible toward $3,680–$3,640 (TP1 zone).
That zone is mentioned on the chart as a strong re-entry point for long positions.
✅ Suitable Target (Bullish):
Immediate Target: $3,915 (previous high)
Extended Target: $3,960 – $3,980
⚠️ Correction Target (Bearish Pullback):
$3,680 – $3,640 (strong buy zone for re-entry)
Gold Trade Set Up Oct 6 2025Price is trading above PDH and created a new ATH so i am overall bullish. For me to look for buys i want to see price close above the CISD and the 15m and retest it to continue higher but it fails to do that and closed under support i will look for internal sells to 1h demand before taking buys back up
