GOLD Best Buy and Sell area
( OANDA:XAUUSD ) At the beginning *Inverse Head & Shoulders* pattern, alongside an **ABC corrective wave** upwards, with clear Fibonacci retracements and volume profile zones.
Let’s break down the analysis into six key points:
---
# ✅ **1) Inverse Head & Shoulders Pattern**
* We have a clear **Left Shoulder**, **Head**, and **Right Shoulder** formation.
* The **neckline has been broken**, signalling a strong bullish reversal.
* Typically, the target is measured from the head to the neckline, which aligns roughly with **Target 1 at 4217** on the chart.
---
# ✅ **2) Elliott Wave Analysis**
The chart outlines an **A → B → C upward corrective wave**:
### Wave A
An initial impulsive move upward, indicating a trend change.
### Wave B
A retracement to the 0.618 – 0.705 Fibonacci levels, which is very typical for gold.
### Wave C
Expected to reach the labelled targets:
* **C ≈ A** at about 4217
* **1.272 – 1.618 of A** around 4236 to 4248
This alignment supports the target levels shown.
---
# ✅ **3) SMC Zones (Smart Money Concepts) **
We can see three key elements:
### **🔵 Demand Zone**
Around **4202 – 4195**
The price has bounced strongly from this area, indicating:
* Liquidity absorption
* Entry of large buyers
* This zone acts as a strong **order block (OB)**
### **🔴 Liquidity Pools Above**
At the target levels (4217, 4236, 4248), we see likely stop hunts. The price tends to gravitate there to trigger stops and fill orders.
---
# ✅ **4) Volume Profile (VPVR) Analysis**
The chart shows:
### ✔ Point of Control (POC) around:
**4208 – 4210**
Currently, the price is trading above the POC, suggesting that:
🔹 Buyers are in control
🔹 Any dips to this zone are likely just retests rather than trend reversals
---
# ✅ **5) Expected Scenario**
## 🔵 Main Scenario (Bullish)
As long as the price stays above **4202 – 4208**, gold is expected to target:
### 🎯 **TARGET 1 → 4217**
(The first liquidity level)
### 🎯 **TARGET 2 → 4236**
(Approx. 100% extension of wave C)
### 🎯 **TARGET 3 → 4248**
(The final target of the C wave)
---
# ✅ **6) Alternative Scenario (Bearish Failure) **
Only if the price breaks:
❌ **Below 4195**
❌ And closes below it on the 15-minute chart
In that case, we might see a decline towards:
**4164 – 4151** (the 1.618 and 2.00 Fibonacci extensions downward)
---
# 📌 **Conclusion**
Overall, the analysis suggests:
### ✔ Short-term trend: **Bullish**
### ✔ Buy zone: **4195 – 4205**
### ✔ Stop loss: **Below 4192**
### ✔ Targets: 4217, 4236, 4248
The price action, wave structure, and volume profile all support this bullish scenario.
FX:XAUUSD
---
Xauusdidea

XAUUSD Analysis todayHello traders, this is a complete multiple timeframe analysis of this pair. We see could find significant trading opportunities as per analysis upon price action confirmation we may take this trade. Smash the like button if you find value in this analysis and drop a comment if you have any questions or let me know which pair to cover in my next analysis.

Gold Trade Set Up Dec 5 2025Gold has broken above PDH and tapped into a strong supply area with SSL, Low range liquidity and PDL below. So i will be looking for 5m-15m bearish engulfing and CISD to make a correction lower to sweep SSL

XAUUSD - Time to buy gold now...XAUUSD (GOLD) was recently in a short term downtrend for a few weeks but has now shown some clear bullish movements ahead. XAUUSD (Gold) has broken out of a downward trend channel that was acting as strong resistance, The price is very likely to head to the next strong resistance level which is marked as the take profit zone (green line). Time to buy GOLD now!

XAUUSD – Dual Bullish Setups (15m + 1H)Gold is presenting two aligned long opportunities: a momentum scalp on the 15m and a higher-timeframe continuation setup on the 1H. Both favor bullish recovery as long as market structure remains intact.
🔹 15-Minute Setup – Scalp Long
Risk/Reward: ~1:3
📌 Entry Logic
Price tapped into a fresh intraday demand zone and showed a strong bullish reaction. Momentum is shifting upward again following a corrective pullback.
🎯 Take-Profit (TP)
+91.49 pips (+2.182%)
🛑 Stop-Loss (SL)
−30.57 pips (−0.729%)
Placed below the previous wick sweep to guard against a deeper flush.
🔍 Summary
Quick continuation scalp
Clean break-and-retest structure
Strong RR due to tightly protected low
🔹 1-Hour Setup – Higher Timeframe Long
Risk/Reward: ~1:4
📌 Entry Logic
After a broader decline, price retraced into a 1H demand zone, offering a chance to catch the next bullish leg if HTF structure resumes.
🎯 Take-Profit (TP)
+5.201%
Aligned with the next higher-timeframe liquidity target.
🛑 Stop-Loss (SL)
−53.80 pips (−1.279%)
Placed below hourly structure.
🔍 Summary
Higher-timeframe continuation setup
Strong confluence with intraday reversal
Larger upside potential towards major liquidity
📌 Overall Outlook
Both setups share the same bullish bias but operate on different scales:
15m: fast momentum move
1H: broader structural expansion
Risk management should treat them as separate trades, even though they’re directionally aligned.

Elliott Wave Analysis XAUUSD – 5/12/2025
1. Momentum Analysis
D1:
Daily momentum has begun moving into the oversold zone, indicating that the current corrective phase may be nearing completion. We will wait for a bullish daily candle to confirm the reversal.
H4:
H4 momentum is declining, suggesting that price may continue to drop or move sideways to bring momentum into the oversold area.
H1:
H1 momentum is currently rising, so the market may see a short-term upward move or sideways action at this timeframe.
________________________________________
2. Elliott Wave Structure
D1 – Higher-Timeframe Structure
Price remains within the green ABC structure of wave X.
With D1 momentum entering the oversold zone and preparing to reverse, the market may continue upward for 4–5 days.
The upward momentum range on D1 is quite large, meaning wave C could push higher toward the previous top or even exceed it—potentially forming an expanded flat or even initiating a new uptrend. We will continue monitoring to refine the strategy.
________________________________________
H4 – Medium-Term Wave Count
Price is currently forming green wave 4, developing mostly sideways.
A strong bullish candle will likely confirm that wave 4 is complete, allowing the market to begin green wave 5.
Projected target for wave 5 (green): 4329
________________________________________
H1 – Short-Term Structure
Price is fluctuating inside a major liquidity zone:
• Upper liquidity zone: 4184 – 4245
• Lower thin-liquidity zone: 4144 – 4184
This creates two possible scenarios:
________________________________________
Scenario 1 – Black ABC correction
If price closes below 4184, it will break through the thin-liquidity zone.
In this case:
• Wave C (black) targets 4144, where C = A
• If price drops deeper into the green wave 1 area → the current wave count becomes invalid, and a new structure will be updated accordingly
________________________________________
Scenario 2 – Triangle structure for wave 4
If price fails to break below 4184, the triangle pattern for wave 4 remains valid.
The two red trendlines outline this structure, and price may currently be in wave d or e.
We will wait for a strong bullish candle breaking the upper triangle boundary to trigger a breakout entry.
________________________________________
3. Trading Plan
Triangle scenario
• Wait for a bullish breakout above the upper boundary.
ABC correction scenario
• Wait for price to reach 4144 to trigger the buy setup.
________________________________________
✅ Buy Zone: 4146 – 4144
❌ SL: 4124
🎯 TP1: 4184
🎯 TP2: 4245
🎯 TP3: 4329

XAUUSD Long - 04/12/25This is a trade I am currently in.
Entry was on a 1-minute order block. Aiming for previous 1hr tf high at 4240.

XAUUSD Beautiful BreakoutXAUUSD Beautiful Breakout
Entry: 4133 (after breaking last LH)
SL: 4040 (Below last HL)
TP: 4360-4380 ( as per ABCD pattern )
RR: 1:3RR

Gold Trade Set Up Dec 4 2025Price swept PDL and SSL to the left also tapping into 1h and 15m demand zones so i will be targeting higher BSL and PDH for a continuation higher

GoldXAUUSD
- Completed " 12345 " Impulsive Waves
- Symmetrical Triangle as an corrective pattern in Short Time Frame
- Break of Structure
- Bearish Channel as Long Time Frame
- Consolidation Phase

GOLD BULLISH STRUCTURE : M15 Buy Setup Greetings 👋
Gold On M15 Setup Has Bullish The Reason Of Buying Thats Liquidity Has Been Sweeped And Have A Demand Zone To Buy Gold With Confidence And The Target 🎯 is Buy Side Liquidity We Are Trade On Liquidity Hold With Breakeven

XAUUSD Bullish Reversal Setup from Extreme POI – SSS Liquidity SChart Analysis
1. Market Context
The chart shows XAUUSD after a decline, now tapping into an EXTREME POI (Point of Interest).
Price reached a previous demand zone where strong reactions occurred before.
2. Liquidity Structure
Multiple areas are labeled “SSS” (Sell-Side Liquidity / Sell-Side Sweep).
Price appears to have:
Swept liquidity beneath local lows (SSS).
Tapped the extreme POI.
Shown an immediate rejection wick, indicating buyers stepping in.
This suggests the market may be exhausting sellers and preparing for a bullish leg.
3. Execution Zone
The grey region represents the entry zone (likely a demand imbalance / mitigation area).
The large blue box above marks the risk-to-reward projection for a long position.
4. Targets
You’ve placed two clear targets:
Target 1
A mid-range liquidity level at approximately 4217.279.
Represents a logical first take-profit based on prior structural inefficiencies.
Target 2
The upper area (labeled “TARGET”), aligning with:
Prior swing highs
A supply zone
A premium pricing zone (after retracement)
This would be the full TP for the bullish move.
5. Bias Summary
Bias: Bullish
Reason: Liquidity sweep + POI tap + structure showing potential for upside displacement.
The setup aligns with Smart Money Concepts:
Sweep → Mitigation → Displacement → Targeting Imbalances & Liquidity Pools

Elliott Wave Analysis XAUUSD – 04/12/20251. Momentum
• D1:
The D1 momentum is currently moving downward. We will need about 1–2 more daily candles for D1 momentum to enter the oversold zone, which would create conditions for a potential bullish reversal.
• H4:
H4 momentum is in the oversold zone. Therefore, today we may see another upward move or a period of sideways consolidation if H4 starts to turn upward.
• H1:
H1 momentum is decreasing, so a downward move on the H1 timeframe is likely before any reversal upward.
________________________________________
2. Wave Structure
• D1:
The D1 chart currently shows 4 consecutive bearish candles. Only 1–2 more candles are needed for D1 momentum to reach the oversold zone and prepare for a reversal. The small candle bodies and lack of strong bearish momentum indicate that wave C may still have one more push to the upside.
Potential target zones: 4329 and 4396.
• H4:
As D1 momentum approaches the oversold zone, today may complete wave 4 (green) within the 5-wave green structure. After that, price is expected to continue upward to complete wave 5 (green).
• H1:
Yesterday, we expected price to reach 4245, but it only touched 4242 before dropping. With the current structure, I expect a black ABC pattern.
The current decline is likely heading toward 4168 or 4144 to complete wave 4 (green).
• Important Note:
H4 momentum is in the oversold zone and can reverse at any moment. Therefore, 4184 is also a strong support area.
If H4 momentum turns upward and price moves sideways within 4184 – 4245, we may see the formation of a triangle correction for wave 4. I will update if this scenario develops.
________________________________________
3. Trading Plan
We focus on the zone where wave (C) equals wave (A) in length — which is around 4144, the preferred level for the completion of wave (C) and a Buy setup.
Buy Zone: 4146 – 4144
SL: 4125
TP1: 4168
TP2: 4246

Gold plans in Asian and European trading sessions1️⃣ Trend Lines
• Descending Trend Line (Key Dynamic Resistance)
Price has touched this trend line several times but has not broken through, confirming that selling pressure remains dominant.
This is a crucial area: if a breakout does not occur, the price could potentially reverse sharply lower.
• Long-Term Ascending Trend Line
This is the main bullish structure in the market.
A larger decline will likely break through this trend line before the price reacts.
2️⃣ Resistance (Red Zone Above)
This is the intersection of:
✓ Descending Trend Line
✓ Nearest Local Peak (High)
This is the best sell zone under current market conditions.
Only if the price is able to close the candle with a strong breakout can a bullish reversal be confirmed.
3️⃣ Support (Green zone below)
This zone has been a recurring price reaction area, serving as important short-term support.
If the price breaks through this support zone, the downtrend will likely continue towards the long-term uptrend line.
📈 BUY GOLD: 4167 – 4165
Stop Loss: 4155
Take Profit: 100 – 300 – 500 pips
📉 SELL GOLD: 4264 – 4266
Stop Loss: 4276
Take Profit: 100 – 300 – 500 pips

[WEEKLY] ANFIBO | Gold XAUUSD - Purple or Gray? [11.24 - 11.28]Hi guys, Anfibo’s here!
XAUUSD Weekly Trading Plan
Overall Picture:
OANDA:XAUUSD is entering a critical phase as price continues to consolidate within a tightening structure, signaling that a major directional move is likely to occur next week. After a period of strong volatility, the market is now compressing energy between the upper and lower boundaries of the current range. This setup is textbook for a break–retest–continuation model, and that’s exactly why my strategy for the upcoming week revolves around two clear scenarios: the “purple arrow” plan and the “grey arrow” plan.
The market will reveal its next major direction once either the upper boundary is broken or the lower boundary gives way. Until that happens, there is no reason to pre-commit to a biased direction — we trade what price confirms, not what we predict.
Trading Plan for Next Week:
We will react based on breakout confirmation:
>>> Scenario #1: Break ABOVE the range – Follow the “Purple Arrow” plan (BUY)
If gold pushes through the upper boundary with strength and confirms a retest, we will switch to a bullish continuation plan.
Key Resistance Levels to Watch: 4147, 4243, 4340, 4356, 4377.
A clean break above structure opens the path back into macro bullish territory, where gold may attempt to revisit or even surpass recent highs.
>>> Scenario 2: Break BELOW the range – Follow the “Grey Arrow” plan (SELL)
Once price breaks and retests the lower boundary, we will look for sell setups targeting the ladder of support levels outlined below.
Key Support Levels to Watch: 4000, 3917, 3890, 3862, 3820, 3793, 3760
A bearish breakout from the range could trigger a multi-wave continuation pattern, giving us multiple opportunities to scale in according to structure.
Risk Management:
Trade only after confirmed breakouts — avoid guessing tops and bottoms.
Keep tight SLs on retests to avoid liquidity hunts common during range boundaries.
Maintain Risk:Reward ≥ 1:2 across all setups.
Prioritize clean structure; avoid trading inside the choppy middle zone of the range.
Reassess bias immediately if the breakout fails or re-enters the range.
Conclusion:
Next week’s market will be all about patience and reaction, not prediction. With gold coiling tightly, a breakout is imminent, and both the “purple arrow” (bullish) and “grey arrow” (bearish) plans give us a clear and disciplined roadmap. Whether price breaks upward or downward, we already know exactly where our key levels are and how we will execute. Stick to structure, wait for confirmation, and let the market choose the direction for us.
HAVE A POWERFUL NEW WEEK, GUYS!

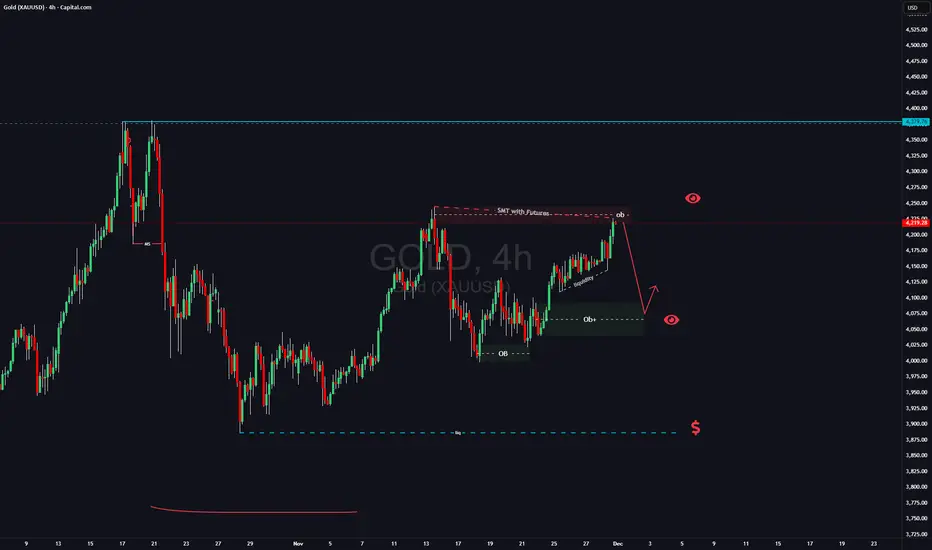
GOLD SETUP: The Liquidity Grab That Could Change Your Month!There is intresting situation on Gold right now:
1) There is SMT with futures(on futures price went higher than previous high from November 13th
2) Have a lot of liqudiity down below which usually means that this liqudiity will be taken
3) strong uptrend on LTF
taking in consideration these factors and that it will be beginign of the month on Monday i will be looking for manipulation at market opening. If i see trend shift on LTF i will be looking for short position till 4110 area (4h OB) , if this wont happen i simply gonna skiip trading GOLD this week.
When price action is not clean and when its hard to see clear picture better to avoid such trade and just watch.
Like and follow if you like my analysis
Gold Trade Set Up Dec 3 2025Gold is overall bullish making HL on the 1h but hasnt made a HH yet so i will want to see price break and close above 4230 to target higher supply area or sweep PDH/Asia high, to come down to lower 1h demand before continuing higher

GOLD 1H GOLD 1H
A structured approach to market analysis combining Fibonacci retracement levels with key Support & Resistance zones.
Price action is monitored to identify reaction points, liquidity zones, and potential reversal or continuation setups.
The analysis focuses on high-probability confluence areas where Fibonacci ratios align with historical structure levels, helping traders spot optimal entry points, stop-loss zones, and profit-taking targets.

Gold price trend ahead of ADP news release on December 31️⃣ Trendline
▪ Rising Trendline (red / upward slope)
Price is moving within a bullish structure, continuously forming Higher Lows.
→ This acts as the main dynamic support guiding the uptrend.
Price is likely to retest this trendline around 4,145 before continuing upward.
▪ Falling Trendline (black / downward slope)
This is the major dynamic resistance, also overlapping with the extended Fibonacci zone.
→ The next potential touchpoint lies near the strong resistance area 4,300–4,340.
2️⃣ Key Support – Resistance Zones
▪ SUPPORT: 4,145 – 4,150
Confluence with EMA + trendline.
This is a high-probability zone where buyers are expected to defend the price.
▪ RESISTANCE: 4,335 – 4,340
Overlaps with the descending trendline.
Matches the 2.618 Fibonacci extension.
This is the main target of the current bullish structure.
→ A reaction or correction is expected when price reaches this area.
Trading Plan
BUY GOLD: 4145 – 4148
Stop Loss: 4135
Take Profit: 100 – 300 – 500 pips
SELL GOLD: 4260 – 4263
Stop Loss: 4270
Take Profit: 100 – 300 – 500 pips

Elliott Wave Analysis XAUUSD – December 3, 2025
1. Momentum Analysis
D1 – Daily Timeframe
Daily momentum is currently turning downward.
Looking at the D1 candle, price broke above the (A) high but closed back below it. This can be considered a liquidity sweep.
We need to wait for today’s daily close to confirm whether price can close above 4245.
With D1 momentum moving down, the market is likely to enter a 4–5 day corrective or sideways phase.
________________________________________
H4 – 4-Hour Timeframe
H4 momentum is still rising.
Based on its current position, the H4 momentum may need 1–2 more candles to reach the overbought zone.
Therefore, I expect price to approach the 4245 resistance, where H4 momentum will likely enter the overbought zone and reverse.
________________________________________
H2 – 2-Hour Timeframe
H2 momentum is clustered tightly in the overbought zone → reversal can happen at any moment.
________________________________________
2. Wave Structure
D1 Wave Structure
On the D1 chart, an (A)(B)(C) structure of wave X is forming.
The technical projection for the upside target is 4329 – 4396.
However, current momentum does not support further bullish continuation.
According to my trading approach, when uncertainty is high, I always prioritize momentum over wave projection.
→ Therefore, I treat the daily trend as bearish for now, until momentum shows a clear reversal.
“When in doubt, rely on an objective reference point — even if it may be right or wrong.”
________________________________________
H4 Wave Structure
On H4, I temporarily label a green 5-wave pattern for easier observation.
However, this structure is not confirmed yet, because wave 5 is only valid if price breaks above 4263.
At the moment, both scenarios remain possible:
• Price may still be in green wave 4, or
• Wave X (purple) may already be complete, and price may be developing purple wave Y.
Since H4 momentum is still rising and not yet overbought, I expect price to test the 4245 zone.
If H4 momentum enters the overbought area and reverses at that zone, it will form a high-probability Sell setup.
If price breaks above 4263 while H4 momentum is overbought, we will need to re-evaluate the green 5-wave structure.
________________________________________
H2 Wave Structure
On H2, a 5-wave black structure has already completed, followed by a strong decline.
Price is now retracing upward.
H2 momentum is in the overbought area, which means a reversal can occur at any time.
I expect price to reach the 4245 zone for a Sell opportunity.
If price fails to reach 4245 and instead drops straight below 4168, then the upper-zone Sell plan will be canceled.
________________________________________
3. Overall Market Context
We are inside a daily corrective wave, meaning multiple scenarios can coexist.
This is normal for corrective structures and makes precise forecasting more difficult.
→ Therefore, trading during this phase requires extra caution and strict risk management to protect the account.
________________________________________
🎯 Trading Plan
Sell Zone: 4244 – 4246
Stop Loss: 4267
TP1: 4184
TP2: 4144
TP3: 4081

Gold Trade Secured 400 PipsPrice pushed higher into supply swept BSL to engulf and IFVG on the 15m to target lower SSL a daily demand

XAUUSD Pullback Zone Buy Setup – Demand Re-Entry Toward Higher TMarket Structure & Price Action Analysis
Trend Context:
Price recently pushed into a higher-timeframe supply zone (the blue area) and rejected strongly, creating a short-term downtrend.
Pullback Behavior:
Price is currently retracing downward, breaking minor support levels and forming lower lows, but the bearish momentum appears to be slowing.
Demand Zone (Entry Area):
Your marked Entry zone (around 4177–4180) aligns with:
Previous consolidation
A prior breakout origin
A sweep of liquidity (the pin-bar wick marked with the red circle)
This makes it a high-probability demand area for a bullish reaction.
📌 Trade Idea Breakdown
Entry
Around 4177–4180 where price may retest the demand zone.
Confirmation
Look for:
Bullish engulfing
Strong rejection wick
Break of short-term structure (e.g., break above 4198)
Target
Re-test of the upper supply zone (around 4208–4215).
This aligns well with your green projection arrow.
🎯 Bias
Bullish from demand → Targeting supply, as long as price holds above 4177 and shows bullish confirmation.
If price breaks below this zone with momentum, bullish setup becomes invalid.

Gold Trade Set Up Dec 2 2025Price is making LL/LH on the 1h and trading under PDL so i am expecting for price to respect 1h supply, sweep internal 15m-5m BSL to then engulf/CISD to the downside to continue to lower SSL
