How did gold perform after the PPI news?🧭 1. Trendline
Descending trendline (red – dynamic resistance)
Price has clearly broken out above the descending trendline.
Price is currently in a slight retest of this trendline → if it holds above 4,150–4,160, a short-term uptrend is confirmed.
Ascending trendline (hidden in the underlying structure)
Confluence support zone is around 4,107–4,110
→ This is a very strong area for a pullback if it occurs.
🧱 2. Support – Resistance
Key Resistance
4,209–4,212: Strong supply zone, also a confluence with the previous peak area.
4,240–4,242: 1.618 Fibonacci extension + peak in the major supply zone → important target.
Support
4.107 – 4.110: Confluence of:
Fibonacci 0.5 – 0.618
EMA as support
Retest zone breakout
→ This is a priority buy area if the price pulls back.
📐 3. Fibonacci
The 0.5 – 0.618 Fibonacci of the rising wave is right in the green support zone → confirming strong demand.
The 1.618 Fibonacci extension points to 4.240 – 4.245 → most likely the final target of this rising wave.
BUY GOLD: 4107 - 4110
Stop Loss: 4097
Take Profit: 100-300-500 pips
SELL GOLD: 4209 - 4212
Stop Loss: 4222
Take Profit: 100-300-500 pips
Xauusdlong

Gold (XAUUSD) at a very critical level, wait for a breakout !Gold is currently at a No-Trade-Zone. We need to wait for it to either break up or down before reacting. The video explains the idea in details.

Gold Setup: Breakout Levels MarkedGold is moving inside 4H symmetrical triangle and waiting for a proper breakout. Price is holding above the 4080-4120 and also above the rising trendline so the structure is still slightly bullish. If gold breaks above the upper trendline 4185 it can quickly move toward 4280 and then 4460. But if it breaks below the rising trendline 4060 and the support zone gold can fall toward 4000, 3900 and more to 3800.
Buy Setup
Buy Zone: 4080-4120 only if price shows support or a bounce
Breakout Buy: 4185 Above the upper black trendline
Targets: TP1 4280, TP2 4460, TP3 4555
Note
Please risk management in trading is a Key so use your money accordingly. If you like the idea then please like and boost. Thank you and Good Luck!

XAU/USD: Bullish Push to 4158?As the previous analysis worked exactly as predicted, FX:XAUUSD is eyeing a bullish push on the 1-hour chart , with price rebounding from a key support zone near cumulative sell liquidation, converging with a potential entry area that could ignite upside momentum if buyers defend against short-term dips. This setup suggests a reversal opportunity amid recent consolidation, targeting higher levels with strong risk-reward.
Entry between 4020-4032 for a long position🎯. Targets at 4158 (main). Set a stop loss at 3990 to limit exposure📊, yielding a risk-reward ratio of approximately 1:3 . Monitor for confirmation via a bullish candle close above entry with rising volume, leveraging gold's safe-haven appeal.🌟
Fundamentally , gold is attempting to stabilize above $4,000 after a sharp pullback, with early signs of a short-term rebound as markets digest fading Fed rate cut hopes and await key US data. Forecasts indicate an average of $3,675/oz by Q4 2025, but recent surges to $4,239 highlight volatility driven by ETF flows and central bank policies. 💡
📝 Trade Setup
🎯 Entry Zone (Long): 4020 – 4032
🎯 Target (TP1): 4158
❌ Stop Loss: 3990
⚖️ Risk-to-Reward: Approximately 1:3, offering a solid reward structure with defined downside.
What's your outlook on this setup? Drop your thoughts below! 👇

XAUUSD:LIVE TRADEHello friends
Well, we had a decline that we found support for with Fibonacci, and you can see that there was good support from buyers at this point.
We also have a head and shoulders pattern, which is again a positive.
The downtrend line has also been broken, which is also a positive point.
Now, given the arrival of buyers, we can enter the trade and move with it to the specified targets.
Note that the first principle of trading is capital and risk management, so be sure to follow it and avoid emotional behavior.
*Trade safely with us*

gold await breakout#XAUUSD price have shown its still on bullish zone, now we await for rejection above 4160 to sell, also the 4140 holds sell-4127.
Sell limit at 4160, target 4100, SL 4172
Below 4140 on H1 reverse can sell, also 4127 breakout continuation.
Above the rectangle 4174-75 holds bullish H1 close till 4200.

XAUUSD (Gold) Is heading UPWARDS! - time to buyA few days back XAUUSD (Gold) was in a short term downtrend but finally broke out of it. The price broke through the downward channel to the upside, the price also held onto strong support (the white trendline which acted as a support level). The price tested the white trendline several times but kept bouncing back each time it hit the support zone. The price then broke through all recent resistance zones and will very likely hit the next resistance zone which is marked as the "Take profit" area. BUY GOLD NOW!

Gold Trade Set Up Nov 25 2025Gold remains bullish on the 4h making HH/HL and has already swept SSL in London session followed by a 1h engulfing candle so i will be looking for internal bullish structure on the 5m-15m to take buys to higher BSL levels

GOLD: Consolidation Won’t Change the Bullish TrendGold is showing a consolidative upward trend today. The intraday price first dipped to a low, then surged upward before pulling back, with bulls and bears engaging in fierce tussles around key levels.
Meanwhile, influenced by the confluence of factors such as interest rate cut expectations and geopolitical risks, it is expected to fluctuate within the range of 4,120 - 4,160 in the short term, and the underlying logic for its medium-to-long-term upward movement remains intact.
In the near term, close attention should be paid to the breakout of the 4,150 resistance level. If the price can stabilize firmly above this level, it may unlock new upside momentum to challenge the 4,200 mark.
On the contrary, if it continues to face resistance, the price may pull back to test the support around 4,100, or even the 4,040 - 4,060 support zone.
Watch out for U.S. economic data tonight! Better-than-expected figures could dampen rate-cut hopes, boost the dollar, and pressure gold,consider trimming positions or taking profits early. If data is weak, gold may break resistance: add positions in line with the trend but don’t chase highs.
Buy 4120 - 4125
SL 4115
TP 4145 - 4155 - 4165
Sell 4155 - 4160
SL 4170
TP 4130 - 4120 - 4110

XAUUSD – Bearish Reversal Setup Toward Liquidity TargetsChart Analysis
Your chart shows a potential bearish reversal on XAUUSD with a clear smart-money structure. Here’s the breakdown:
1. Market Structure
Multiple Breaks of Structure (BOS) and Change of Character (ChoCH) indicate a shift from bullish momentum to bearish intent.
Price made a final sweep / liquidity grab at the recent high before sharply dropping into your marked entry zone.
2. Entry Zone
The “ENTRY” mark aligns with:
A bearish mitigation zone from the last up-move
A distribution pattern forming (rounded top + BOS)
This suggests institutional selling activity.
3. Target One – 4,080.064
This level is a logical first target because:
It aligns with previous demand acting as newly created liquidity.
You expect a corrective pullback before continuation—your white zig-zag path reflects this.
4. Target Two – 4,040.652
A deeper liquidity pool and the next major imbalance area.
If price breaks Target One, momentum likely accelerates.
This is the main downside liquidity sweep zone.
5. Context
The shaded half-circle structures highlight swing points where price formed lower highs, reinforcing the bearish narrative.
The clean equal-lows and imbalances under price give strong bearish draw-on-liquidity.

Gold trend continues today November 25th✅ 1. Trend Lines
Upper trend line (red - descending)
Connects a series of lower highs → acts as strong dynamic resistance.
Price has broken through the trend line and is retesting it → the short-term trend will turn bullish if the retest is successful.
Lower trend line (red - ascending)
Connects the upper lows → acts as dynamic support for a symmetrical triangle pattern (consolidation).
This area coincides with a Fibonacci level → strong support – confluence if the price continues to correct.
✅ 2. Key Support – Resistance
Resistance
4,210 – 4,240:
→ Key resistance – short-term bearish potential.
Breaking above the 1.618 Fibonacci level
→ Strong resistance – take-profit zone for buyers.
Support
4.105 – 4.100 (green zone):
Retest zone after breakout
Fibonacci support 0.5–0.618
→ Best buy zone if price retests.
✅ 3. Fibonacci
0.618 at 4.105: First retest → chart reaction.
On the downside, the 4.071 zone touches the trendline.
Extension 1.618 at 4.240: Maximum target if the uptrend is confirmed.
🎯 Trading Plan
BUY GOLD: 4105 – 4103
Stop Loss: 4093
Take Profit: 100 – 300 – 500 pips
SELL GOLD: 4210 – 4212
Stop Loss: 4222
Take Profit: 100 – 300 – 500 pips

Gold price recovers on accumulation margin⭐️GOLDEN INFORMATION:
Gold (XAU/USD) climbs to a one-and-a-half-week high in Tuesday’s Asian session, extending Monday’s nearly 2% surge as dovish Fed expectations strengthen. Recent remarks from key FOMC officials have boosted bets on a December rate cut, capping the US Dollar’s rally to its highest level since late May and supporting the non-yielding metal.
Geopolitical tensions—from the escalating Russia-Ukraine conflict to renewed unrest in the Middle East—are also lifting safe-haven demand. Still, upbeat equity sentiment limits stronger gains, while traders remain cautious ahead of this week’s major US data releases, starting with PPI and Retail Sales on Tuesday
⭐️Personal comments NOVA:
Gold price recovers - watch the reaction zone 4157. If it continues to break, gold price will continue to increase near 4200
⭐️SET UP GOLD PRICE:
🔥SELL GOLD zone: 4193 - 4195 SL 4200
TP1: $4180
TP2: $4170
TP3: $4150
🔥BUY GOLD zone: 4073 - 4071 SL 4066
TP1: $4085
TP2: $4098
TP3: $4110
⭐️Technical analysis:
Based on technical indicators EMA 34, EMA89 and support resistance areas to set up a reasonable BUY order.
⭐️NOTE:
Note: Nova wishes traders to manage their capital well
- take the number of lots that match your capital
- Takeprofit equal to 4-6% of capital account
- Stoplose equal to 2-3% of capital account

Gold Asia Session Set Up Nov 24 2025Price has shifted into bullish structure on the 4h and 1h making new HH so i will be taking buys targeting the next BSL level at 4211

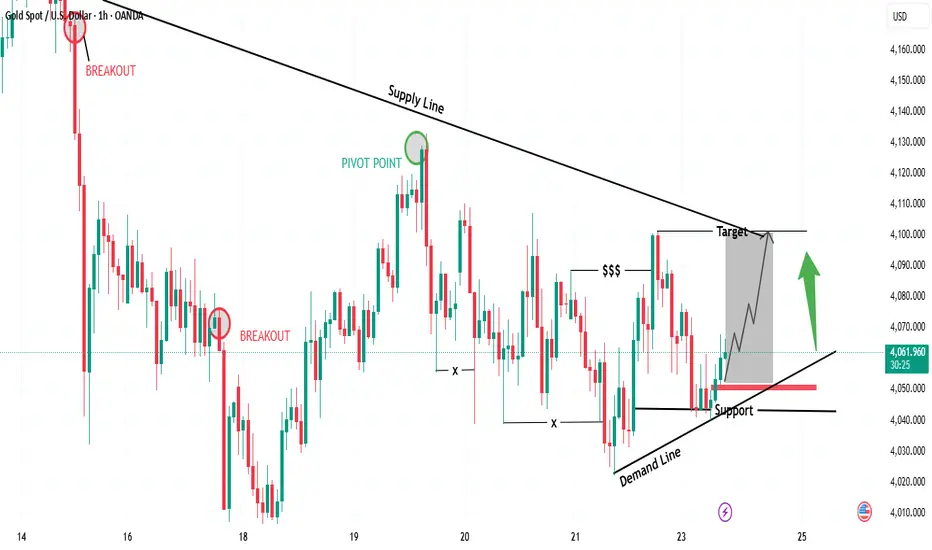
“Gold Rebounding from Demand – Targeting Supply Line Retest🔍 Key Observations
📉 Supply Line (Downtrend Resistance)
Each rally is being capped by the descending supply line
📈 Demand Line (Ascending Support)
Buyers defending higher lows
Strong bullish reaction off support
💰 Liquidity Grab ($$$)
Liquidity was taken below swing lows — bullish signal
Smart money likely securing positions before pushing up
🟢 Bullish Confirmation
If price holds above demand line + support zone
Expect bullish continuation toward supply line retest
🎯 Suitable Target Levels
Target Level (Approx) Status
🥇 First Target 4,095 – 4,105 At supply line retest
🥈 Extended Target 4,120 – 4,130 Breakout continuation
📌 Trade Idea (Bullish Scenario)
Entry Zone: 4,055 – 4,065 🟩
Stop Loss: Below 4,025 ❌
Take Profit 1: 4,100 🎯
Take Profit 2: 4,125 🚀
RR Ratio: 1:2.5 – 1:3 📈
🧭 Market Sentiment
📍 Bias → Short-term Bullish
🛑 But… sellers may reappear at supply line
⚠️ Watch for fakeouts near the target
goldawaitbreakout#XAUUSD we await price for breakout above the 4077 to buy, above 4087-89 holds confirmation on buy once M15-H1 close above.
Buy limit 4077, target 4095-4109, SL 4065.
Below 4063 holds strong bearish continuation which will target 4031.

Gold Trade Set Up Nov 24 2025Price is in a 4h range but internally making HH/HL and swept SSL in Asia and engulfed in London so am expecting price to sweep internal 5m-15m SSL before continuing its bullish push to PDH and higher BSL

Gold Setup Is TOO CLEAN to Ignore — Bulls in Control!In my view, Gold currently presents one of the cleanest technical structures across the entire market. Ideally, I would like to see a downside manipulation first, followed by a continuation move toward the 4110 area to sweep internal buy-side liquidity. Only after that, a potential retracement toward the 3900 zone becomes reasonable. Any bearish movement that occurs without first taking buy-side liquidity does not align with my plan, and in that case, I will not consider opening any short positions.
Like and follow if you wanna see more analysis like this!
XAUUSD - Time to buy gold!XAUUSD (GOLD) was recently in a short term downtrend for a few weeks but has now shown some clear bullish movements ahead. XAUUSD (Gold) has broken out of a downward trend channel that was acting as strong resistance, The price is very likely to head to the next strong resistance level which is marked as the take profit zone (green line). Time to buy!

Gold prepares for the US trading session1. Trendline Structure
Upper trendline (descending – red)
Connects descending highs → acts as key dynamic resistance.
Price has been tested and rejected several times → medium-term trend remains down.
Possible bullish breakout zone: 4105 – 4110.
Lower trendline (ascending – red)
Connects higher lows → key dynamic support.
Price is approaching a convergence point, indicating an imminent breakout from the contracting triangle.
2. Resistance Zone
Strong resistance: 4090 – 4110
Coincides with the descending trendline and the previous supply zone.
If a breakout occurs and consolidation occurs above 4110 → further growth potential opens up.
3. Support Zone
Support 1: 4000 – 4004
Nearest demand zone.
If broken, the breakout of the lower trendline will be confirmed, leading to a sharp decline.
Support 2: 3955 – 3965
Fibonacci extension 2.618 + key low zone.
Deep downside target.
Trading Plan
BUY GOLD: 4004 – 4002
Stop Loss: 3994
Take Profit: 100–300–500 pips
SELL GOLD: 4104 – 4106
Stop Loss: 4114
Take Profit: 100–300–500 pips

Gold Intraday Channel UpdateGold is currently moving within an ascending channel, with price reacting around the mid-range of the structure. The lower boundary of the channel is acting as a dynamic support zone, while the upper boundary remains the next reaction area to watch.
If price maintains stability above the lower trendline, the structure suggests space toward the upper channel region around the recent intraday highs. The chart highlights how price has been respecting both channel boundaries throughout the session.
This update focuses on the current market structure and key levels visible within the channel.
GoldXAUUSD
- Change of Characteristics
- Order Block
- Symmetrical Triangle as an corrective pattern in Short Time Frame
- Fair Value Gap
- Completed " 12345 " Impulsive Waves and " AB " Corrective Waves

GOLD Best Places To Buy And Sell Cleared , 500 Pips Waiting !Here is m y opinion on GOLD On 15 Mins T.F , We have a Good movement since Last 2 weeks , and we have a range now for 3 Weeks started between 4050.00 to 4099.00 so we can buy and sell Gold This Week from 2 areas , 4050.00 will be the best place for Buy and range between 4095.00 to 4099.00 will be the best place for Sell , now the price very near selling area so we can wait the price to retest the res area and then enter a sell trade and targeting 4050.00 and when the price touch it and give us a good bullish P.A , we can enter a buy trade and targeting 4099.00 , It`s All Depend On Price action , if we have a daily closure below our support then the price will go down more and more after huge movement to upside .
Entry Reasons :
1- Highest Level The Price Touch It
2- Broken Res
3- New Support Created .
4- Clear Price Action .
5- Clear Support & Res .
6- Price Range Cleared .

XAUUSD – Potential Distribution Phase Signaling Deeper Bearish TAnalysis of the Chart
Your chart shows a full market cycle structure based on Wyckoff + Smart Money Concepts (SMC). Here’s a clean breakdown:
1️⃣ Previous Accumulation Phase (Left Side)
Multiple BOS (Break of Structure) labels confirming bullish intent.
CHoCH followed by accumulation zones.
Price gradually builds liquidity (SSL / price points).
Strong bullish impulsive leg begins after accumulation.
2️⃣ Strong Bullish Trend Continuation
Successive BOS levels show continuation of bullish strength.
Several mitigation blocks / filled imbalances visible.
Price aggressively pushes toward the premium ceiling zone.
3️⃣ Entry Into Distribution Phase (Top Right)
Market reaches Premium Ceiling Zone.
Signs of exhaustion appear:
Lower high formations
Reversal zone highlighted
Shift in character from expansion → distribution
4️⃣ Bearish Reversal Structure Forming
The chart shows:
A potential descending structure
Expectation of liquidity sweeps followed by deeper decline
First bearish target (Target One) around 3,902
Second bearish target (Target Two) around 3,700
These levels align with prior imbalances and discount pricing.
5️⃣ Market Psychology According to the Chart
Bulls losing momentum after premium pricing reached
Smart money distributing positions
Expecting a retracement toward major discount areas
Possible sweep of liquidity before continuation downward
