Gold Bounces from PRZ — Is a Short-Term Rally Underway?Gold ( OANDA:XAUUSD ) started to rise from the Support zone($3,307-$3,275) as I expected in the previous idea .
Gold is currently moving near the Support zone($3,350-$3,326) , Potential Reversal Zone(PRZ) , and $3,334 (Important price) .
From the Elliott wave theory , it seems that Gold has completed its 5 impulsive waves and now we should wait for corrective waves . Corrective waves can complete at the Potential Reversal Zone(PRZ) .
I expect Gold to rise to $3,383(at least) in the coming hours .
Second Target: $3,396
Note: Stop Loss (SL) = $3,321
Gold Analyze (XAUUSD), 1-hour time frame.
Be sure to follow the updated ideas.
Do not forget to put a Stop loss for your positions (For every position you want to open).
Please follow your strategy; this is just my idea, and I will gladly see your ideas in this post.
Please do not forget the ✅ ' like ' ✅ button 🙏😊 & Share it with your friends; thanks, and Trade safe.
Xauusdsetup

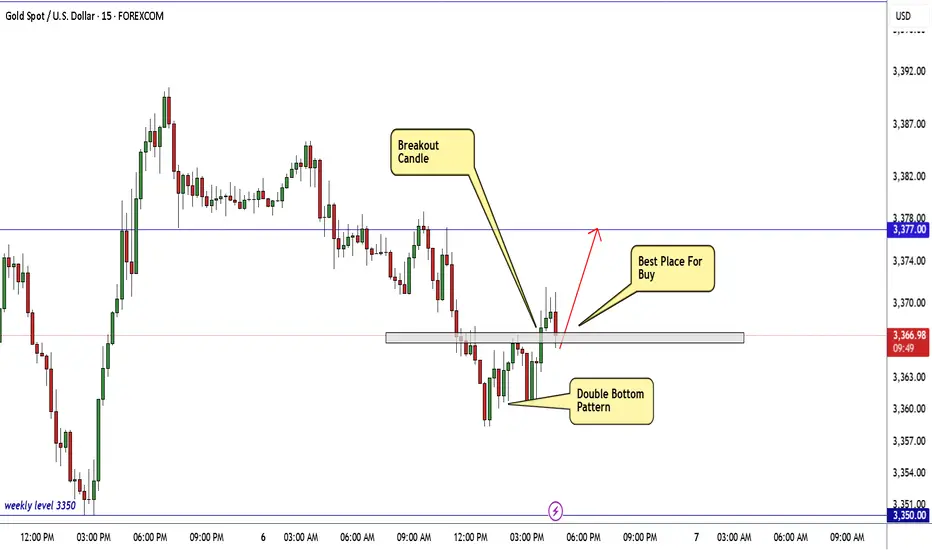
GOLD Ready To Go Up From Current Price , 150 Pips WaitingHere is My 15 Mins Gold Chart , and here is my opinion , we finally above 3365.00 and we have a 30 Mins Candle closure above it And Perfect Breakout , so we have a good confirmation now to can buy it and we can targeting 100 to 150 pips .
Reasons To Enter :
1- New Support Created .
2- Bullish Price Action .
3- Bigger T.F Giving Good Bullish P.A .
4- Clean Breakout .
5- Reversal Pattern .
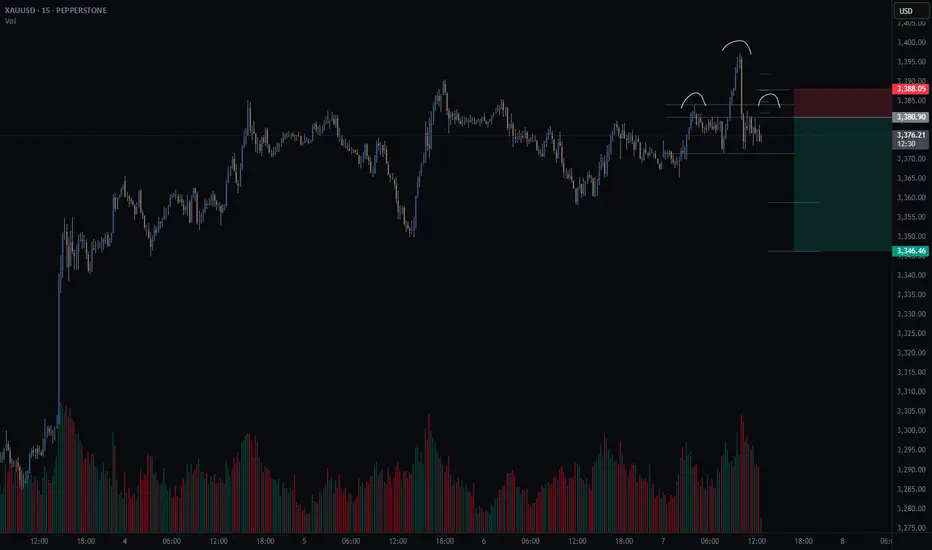
Gold short – Head and Shoulders Setting Up on 15min?There’s a potential head and shoulders pattern forming on the 15-minute chart.
📌 What I’m watching for:
A 15min candle close back inside the neckline range
Lower volume on the right shoulder vs. the left (to confirm weakening momentum)
🧠 Trade Idea (Short bias)
🎯 Entry: 3380.9
❌ Stop Loss: 3388.0
✅ Take Profit 1 (50%): 3358.9
✅ Take Profit 2 (50%): 3346.3
⚖️ Risk/Reward: 3.8R
This setup lines up with my trading method that focuses on structure, volume, and clean risk/reward.
🤔 What are your thoughts on gold today?
Are we about to roll over — or will bulls push through resistance?
Institutional Gold Strategy Note – August 7, 2025🔍 Executive Summary
Gold (XAU/USD) continues to hold firm above the $3,370 handle, supported by a bullish macro narrative and confirmed technical structure on the 4-hour chart. Amid dovish expectations from the Fed and soft labor market data out of the U.S., bullion maintains its premium as a hedge, attracting institutional flow in line with the rate-cut narrative for Q3–Q4.
Today’s market profile suggests a high-probability long setup, anchored in a fresh demand structure just below current price, supported by unmitigated institutional order flow, premium discount levels, and clear liquidity sweeps.
🎯 Directional Bias: Bullish–Transitional
While price is consolidating around $3,378, the underlying structure favors a bullish continuation. A Change of Character (CHoCH) has been confirmed on the 4H chart, suggesting a shift from corrective to impulsive intent. Liquidity remains stacked below recent equal lows, and the premium-to-discount array strongly favors buy-side execution.
🟩 Primary Buy Zone (GOLDEN ZONE)
Entry: $3,350–$3,355 | Stop-Loss: < $3,340 | Targets: $3,400 / $3,430
This zone represents the highest institutional quality setup of the day. It aligns with:
A fresh unmitigated Rally-Base-Rally Demand Zone
A refined Bullish Order Block within optimal trade entry (OTE) discount range
A Fair Value Gap (FVG) aligned with internal BOS leg
Equal Lows (EQL) sweep below $3,355, targeting liquidity
Overlap with volume imbalance, suggesting a clean institutional leg
Clear CHoCH confirming bullish structure
Kill Zone Alignment: Asia–London overlap, pre-London accumulation
This zone is statistically favored for execution by both Smart Money and legacy institutions, given its confluence density and asymmetrical risk profile.
🟥 Primary Sell Zone
Entry: $3,385–$3,390 | Stop-Loss: > $3,400 | Targets: $3,350 / $3,320
A valid counter-trend liquidity sweep opportunity, located above short-term equal highs near the psychological $3,400 level. Key confluences include:
Drop-Base-Drop Supply Zone
Overlapping FVG + OB in premium zone
Alignment with OTE premium retracement
Liquidity cluster near recent EQH
Structural resistance + round-number magnetism
Execution window during London–NY overlap
This zone is valid only for short-duration scalps or short-term reversal positioning.
🟢 Fallback Buy Zone (If Primary is invalidated)
Entry: $3,320–$3,325 | SL: < $3,310 | TPs: $3,400 / $3,430
A deeper mitigation zone with reduced confluence but adequate historical support. This zone captures:
A mitigated OB inside Demand
0.618 Fib retracement from internal BOS
Liquidity sweep potential of a broader EQL stack
Minor structure support
Use only if the market sweeps the primary zone and rebalances deeper.
🔻 Fallback Sell Zone (If Primary Sell fails)
Entry: $3,410–$3,415 | SL: > $3,420 | TP: $3,350
Set well above prior resistance, this extended zone aligns with:
Extended Supply + Unmitigated OB
FVG inside premium OTE zone
Recent accumulation liquidity trap (potential fakeout zone)
Session mispricing during NY–Asia rollover
Use only if price impulsively breaches the $3,400 psychological barrier and stalls near the top of an exhaustion leg.
🌐 Institutional Cross-Validation
Citi Group has upgraded its 3-month Gold forecast to $3,500, citing weakening U.S. macro data and elevated inflation expectations as bullish catalysts.
Reuters and FXStreet confirm Gold's hold near 1-week highs with sentiment strongly skewed toward continued demand amid Fed rate-cut odds exceeding 90%.
TradingView pro charts show confluence with OB/FVG zones at both $3,355 and $3,390, validating both primary zones technically.
📌 Final Notes
Action Bias:
Aggressively long from $3,350–$3,355 with tight structure-defined invalidation.
Hold shorts only from $3,385–$3,390 under strict reversal logic.
Risk Reminder:
All zones are built from 4H structural flow only. Intraday volatility outside kill zones may distort price behavior — wait for displacements and internal breaks before entering. Manage partials at 1.272 extension and hold runners toward 1.618 only if structure confirms.
Gold (XAU/USD) - 2H Wave Setup + Scalp Opportunities# 🔻 Gold (XAU/USD) - 2H Wave Setup + Scalp Opportunities Ahead
**By: Mohsen Mozaffarinezhad**
📅 August 7, 2025 | ⏰ Valid through August 8 (End of NY Session)
⏱ Timeframe: 2H
📌 Method: Elliott Wave + Supply/Demand + SSL Hybrid Confirmation
---
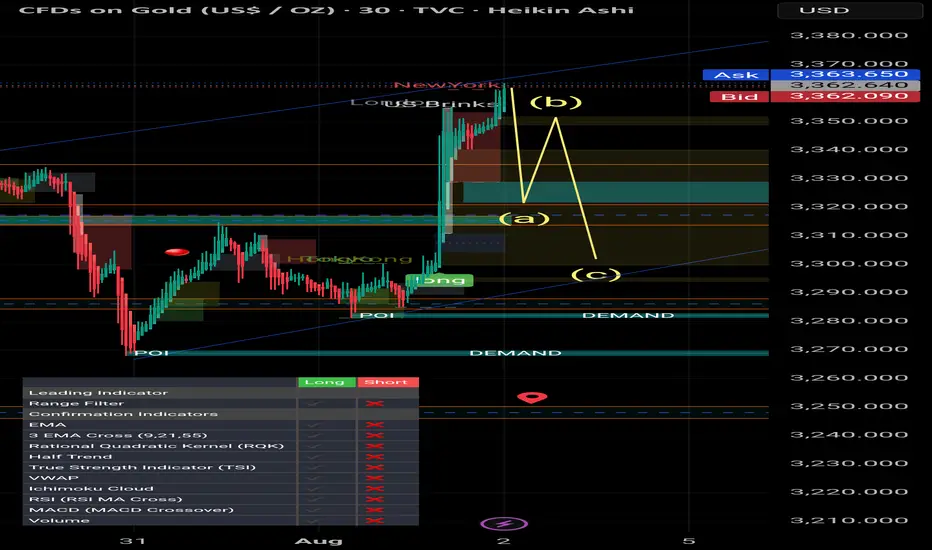
## 🧠 Market Context:
Price has completed a **strong bullish leg** and is currently forming a classic **(a)-(b)-(c)** corrective pattern. We are now between **point (b)** and the potential completion of **(c)**. The broader market is expected to **retest the lower demand POI**, possibly before resuming the uptrend.
---
## 🔎 Technical Highlights:
- 📉 Bearish correction in progress: (b) → (c)
- 📦 Major **Supply** above 3,390 – acted as rejection point
- 🟦 Strong **Demand Zone**: 3,345 – 3,320
- 🔁 Price forming a potential **ABC correction**
- 🔔 **Point of Interest (POI)** near 3,350 may offer entry confirmation
- 💠 **SSL Channel**: Currently bearish crossover
- 🔄 **RQQ, HT, MACD, RSI**: Bearish/neutral, waiting for reversal signals
- 📊 **Volatility (Vol %ile)**: 67%
- 🎯 **ATR**: 13.52 (2H – medium range)
- 🧯 **Risk Level:** Normal
---
## 🟢 Scalp Strategy:
Scalp traders can take advantage of both micro-swings at **points (a) and (b)** using lower TF (M5/M15) confirmations:
### 🎯 Scalp Buy:
- 📍 Entry: Near 3,345–3,350
- 🛑 SL: Below 3,340
- 🎯 TP: 3,365–3,370 (short-term liquidity sweep)
- ⚠️ Only on bullish SSL + RSI divergence (M5)
### 🎯 Scalp Sell:
- 📍 Entry: Near 3,375–3,380 (**point b rejection**)
- 🛑 SL: Above 3,385
- 🎯 TP: 3,360 then 3,350
- ⚠️ Use Heikin-Ashi reversal + SSL confirmation
---
## 📌 Mid-Term Outlook (Swing):
If price reaches **point (c)** around the **lower demand zone** and reacts with bullish structure (BOS, CHoCH), we anticipate a strong rally toward:
- **TP1:** 3,385
- **TP2:** 3,400
- **TP3:** 3,420 (next macro supply)
---
## ⚠️ Notes:
> This setup remains **valid until the end of NY session, August 8**.
> Wait for **clear confirmation** before execution.
> All scalps are suggested with **tight risk management**.
_Analysis by Mohsen Mozaffarinezhad | Educational Purposes Only_
---
#gold #xauusd #elliottwave #supplydemand #sslhybrid #scalping #smartmoney #tradingview #forexanalysis

Gold (XAU/USD) 4H Institutional Analysis — August 6, 2025As of August 6, 2025 (12:23 UTC), Gold (XAU/USD) is trading around 3,367.60, according to Kitco’s live spot price feed. After a sustained bullish recovery from the 3,320–3,330 demand zone, gold finds itself at a structural inflection point. Institutional footprints across the board — from order blocks to liquidity maps — are signaling one dominant message: the bulls are setting the stage.
In today’s breakdown, we deliver a high-conviction execution plan using a fusion of Smart Money Concepts (SMC), ICT methodology, and 4H structural dynamics — isolating only the strongest Primary Buy and Sell zones, along with their fallback counterparts. At the center of this framework is our Golden Zone, the most institutionally-aligned, high-probability area of the day.
🔍 Market Structure & Directional Bias
The 4-hour chart has shown a clear Change of Character (CHoCH) to the upside after a bullish Break of Structure (BOS) above the 3,355 level. This signals a phase shift from consolidation into accumulation and potential expansion, likely aiming toward the 3,400 psychological magnet and beyond.
The presence of volume imbalances, fair value gaps, and unmitigated order blocks across multiple structural layers further supports a bullish directional bias. Liquidity has been swept below previous equal lows (EQL), creating an environment ripe for institutional accumulation.
Directional Bias: Transitional → Bullish
🎯 Primary Execution Zones
✅ Primary Buy Zone (Golden Zone) — 3,355 to 3,360
This zone represents the highest-quality long opportunity on the chart today. Sitting in the discount array (below 50% of recent swing), the zone is built on a fresh Rally-Base-Rally (RBR) demand structure formed after a decisive CHoCH.
The 3,355–3,360 range aligns with a valid unmitigated Order Block, an embedded Fair Value Gap, and an OTE retracement between 0.705–0.79 Fib levels. Beneath this zone lies a sweepable liquidity pocket just under 3,350, further increasing the magnetism of the area.
Entry: 3,355–3,360
Stop Loss: Below 3,350 (liquidity invalidation)
Take Profits:
TP1: 3,395–3,400 (1.272 extension)
TP2: 3,420 (1.618 extension)
Confluences: RBR Demand, OB, FVG, OTE, Volume Imbalance, EQL Sweep, Discount Array, Structural Support
Kill Zone Timing: London-NY Overlap
✅ Golden Zone of the Day
✅ Primary Sell Zone — 3,395 to 3,400
While the broader bias is bullish, gold remains capped by a strong Drop-Base-Drop (DBD) supply zone around 3,400 — also the 1.272 fib extension from prior bullish legs. A pocket of equal highs (EQH) just above 3,405 serves as a liquidity magnet and stop-loss hunting zone — making this supply level extremely attractive for short-term reversion plays.
Entry: 3,395–3,400
Stop Loss: Above 3,405
Take Profits:
TP1: 3,360
TP2: 3,350
Confluences: DBD Supply, OB, FVG, OTE Retrace, EQH Sweep, Premium Array, Structural Resistance
⚠️ Secondary Execution Zones (If Primary Fails)
🟢 Fallback Buy Zone — 3,325 to 3,330
If the market manipulates lower and invalidates the primary buy zone with a deep liquidity sweep, this deeper zone offers a second chance. It contains a secondary demand block, a valid FVG, and lies cleanly within a deep discount retracement.
SL: Below 3,320
TPs: 3,360 and 3,380
🔴 Fallback Sell Zone — 3,445 to 3,450
If gold breaks cleanly above 3,405, likely invalidating the primary sell idea, the next institutional level of interest is 3,445–3,450 — sitting on a higher timeframe premium OB and major liquidity shelf.
SL: Above 3,455
TPs: 3,395 and 3,370
🌐 Institutional Consensus: Bullish Convergence
Institutional analysts across major platforms confirm a bullish bias, with targets hovering around the 3,400–3,420 area:
Reuters reports that gold is near a one-week high, supported by weaker U.S. data and increased rate-cut bets.
MarketPulse highlights the “return of the bulls” amid sustained momentum and light CPI expectations.
Citi has raised its medium-term gold target to $3,500, citing negative U.S. macro headwinds.
TradersUnion confirms support at 3,320 and resistance at 3,400 — mirroring our execution levels.
There is no significant divergence in sentiment or structure, validating today's trade zones with confidence.
📌 Final Thoughts
In a liquidity-driven market, price is engineered — not discovered. Today, that engineering points to one thing: 3,355–3,360 is the Golden Zone — the strongest execution area, supported by eight institutional confluences, favorable structure, and widespread sentiment confirmation.
Gold has re-entered its institutional kill-box. The next move? Likely engineered to deliver smart money profits while trapping the uninformed. Don’t chase price. Let it come to your zone. Execute with discipline.

Gold Price Setup – Potential Rejection & Long ScenariosPrice is currently consolidating below the H4 Supply Zone after rejecting the ascending trendline twice.
Two key scenarios are in focus:
✅ Scenario 1 – Deeper Pullback to Demand Zone
A retracement into the 1H + 30M Order Block (OB) and liquidity zone near 3,341–3,355 (marked with $$$) could attract buyers.
If bullish momentum confirms, look for a continuation toward 3,388 and possibly the upper trendline near 3,400+.
✅ Scenario 2 – Immediate Push Higher
If price holds above the moving average and fails to break below 3,355, bulls could step in earlier, driving price back to test the trendline resistance.
Breakout of the trendline could target the higher supply region.
🔍 Key Levels to Watch:
H4 Supply Zone (3,440 area) for potential reversal.
3,341 OB Zone for liquidity sweep and reaction.
Trendline Resistance capping the upside.

Gold: Yesterday’s Surge & Today’s Session StrategyDuring yesterday’s U.S. trading session, gold surged to around 3390 🚀, driven by a series of tariff-related remarks from Trump, Fed personnel changes, and market expectations that the probability of a September rate cut has risen to 91% ⚡️. We successfully took profit near 3355 yesterday, locking in close to maximum gains 💰.
Today’s trading strategy:
Go short at highs during the Asian session 📉
Go long at lows during the European session 📈
Go short at highs again during the U.S. session 📉
⚡️⚡️⚡️ XAUUSD ⚡️⚡️⚡️
🚀 Sell@ 3390 - 3380
🚀 TP 3375 - 3366 - 3356
Daily updates bring you precise trading signals 📊 When you hit a snag in trading, these signals stand as your trustworthy compass 🧭 Don’t hesitate to take a look—sincerely hoping they’ll be a huge help to you 🌟 👇
8/6: Watch for a Potential Double Top FormationGood morning, everyone!
Yesterday, gold experienced its first significant supply pressure around the 3386 level, but with support near 3350—helped by positive data—prices rebounded and climbed back toward 3390, resulting in solid overall gains.
From the 1-day chart (1D) perspective, the technical structure remains bullish, with MA20 providing firm support. Although short-term moving averages are currently converging, the overall bias remains towards a bullish divergence, suggesting further upside potential. There's a possibility for price to test the 3400–3420 zone in today’s session.
That said, the 3386–3398 region may still pose minor selling pressure, although it is not expected to be particularly strong. Key intraday support is seen in the 3378/3372–3362 range. If the market encounters another wave of heavy selling that damages the daily bullish setup, then the 3343–3348 area will become a critical battleground between bulls and bears.
📌 Trading Strategy for Today:
Maintain a sell-on-strength approach, especially if prices approach the 3418–3438 resistance area, where short opportunities become more attractive;
If a pullback occurs, monitor the aforementioned support zones for potential buy-on-dip opportunities, contingent on stability.
⚠️ Market Risk Reminder:
There will be key economic speeches during the US session, which could trigger heightened volatility. Ensure proper risk management and stop-loss settings are in place.

GOLD RAID ON – Bullish Limit Orders Are LIVE! XAU/USD💰GOLD HEIST IN PROGRESS! XAU/USD BULLISH RAID BEGINS! 🏴☠️📈
Asset: XAU/USD – Gold vs U.S Dollar
📊 Plan: BULLISH ROBBERY
🎯 Target: 3460.00
🛑 Stop Loss: 3330.00
📥 Entry: ANY level – vault is wide open!
👑 THIEF MODE ACTIVATED – Time to raid GOLD like a pro. We’re stacking multiple limit orders (layering entries) just like setting traps for those greedy bears 🐻💥
🚪💼 Entry strategy:
“The vault is unlocked – grab your bag and go!”
Place buy limits at recent swing lows (15m/30m) or jump in live with your bullish crew. Use alerts to catch price at key pullback zones.
🛑 SL placed at: 3330 – Just below thief territory. Adjust based on your lot size + number of entries 🔐
🎯 Target: 3460 – Hit and run, or trail that SL and let the gold rain! ☔💸
🧠 Thief Tactics for GOLD:
Only trade Long-side – scalpers, swing traders, all aboard 🚂
Use trailing SL to protect your loot
Avoid trading during high-impact news (CPI, NFP, Fed, etc) ⚠️
Stay alert for manipulations + fake-outs at key levels – it's a trap game out here 🎭
📰 Before the Heist:
🧾 Read Fundamentals • COT Report • Sentiment • Macro Outlook
📌 Always stay updated, news can flip the market faster than a backstab 🗡️
🗣️ Boost this idea if you’re robbing with us!
💥 Smash that LIKE if you believe in the heist
🚨 Follow for more high-voltage thief trades
💎 Daily playbooks. Clean getaways. All signals, no noise.
Join the crew. Trade like a THIEF. Get rich or get smarter.
🕵️♂️💰🚀🔥🐱👤📈

GOLD Breakout Done , Long Setup Valid To Get 150 Pips !Here is My 15 Mins Gold Chart , and here is my opinion , we finally above 3350.00 and we have a 30 Mins Candle closure above it And Perfect Breakout , so i`m waiting the price to go back and retest this res and new support and give me a good bullish price action to can enter a buy trade and we can targeting 100 to 150 pips .
Reasons To Enter :
1- New Support Created .
2- Bullish Price Action .
3- Bigger T.F Giving Good Bullish P.A .
4- Clean Breakout .

GOLD Breakout Done , Long Setup Valid To Get 150 Pips !Here is My 15 Mins Gold Chart , and here is my opinion , we finally above 3384.00 and we have a 30 Mins Candle closure above it And Perfect Breakout , so we have a good confirmation now to can buy it and we can targeting 100 to 150 pips .
Reasons To Enter :
1- New Support Created .
2- Bullish Price Action .
3- Bigger T.F Giving Good Bullish P.A .
4- Clean Breakout .

8/7: Continue to Focus on SellingGood afternoon, everyone!
During today’s session, gold successfully moved into the anticipated resistance zone of 3386–3398, and encountered significant selling pressure near 3398, resulting in a retracement to around 3372. While the price action aligned with prior expectations, the delayed timing has led to a bearish shift in the technical structure, which may hinder further upside momentum for the bulls.
That said, important economic data will be released during the US session later today. We’ll need to observe whether bulls can leverage the potential catalyst to break through the current resistance levels.
⚠️ Trading Strategy Recommendation:
Regardless of the data outcome, it is advisable to maintain a bearish bias in subsequent trades.
From a technical standpoint, the higher the price climbs, the greater the probability of a pullback, making short positions relatively less risky.
📌 Reference Range:
Continue to monitor and trade within the key zones outlined yesterday, adjusting entries and exits as per intraday developments.

Gold - Intraday Long Setup (5M TF) | Smart Money + Elliott Struc# 🟢 Gold - Intraday Long Setup (5M TF) | Smart Money + Elliott Structure
**Pair:** Gold Spot / USD
**Timeframe:** 5M
**Session:** London / NY Overlap
**Type:** Intraday Long Idea
**Concepts:** Smart Money, Supply & Demand, Wave Analysis, SSL Confirmation
---
## 🔍 Market Context
The market is currently reacting inside a **key Demand Zone** on the 5-minute timeframe, following a strong bearish move during the London session. The structure suggests a corrective **ABC wave formation**, where the **(c) point** appears to be forming a potential higher low at demand.
- Point **(a)**: Marked the first impulse down
- Point **(b)**: Rejection at minor **Supply Zone**
- Point **(c)**: Retest of **POI at Demand**, showing signs of exhaustion in selling pressure
---
## 📈 Technical Confluences
- 🟦 **Demand Zone** active and respected
- 📏 Potential BOS (Break of Structure) upon break of the recent high
- 📊 **Vol %ile** = 83% → Above average participation
- ⚠️ Risk Level: High (tight structure, requires confirmation)
- 🧭 Entry Distance: Near
---
## 🔧 Indicators Status (SSL Hybrid)
| Indicator | Status |
|--------------------------|----------|
| SSL Channel | ✅ Bullish cross (supporting reversal)
| RSI (50) | ✅ Holding above midpoint
| MACD | ✅ Bullish crossover (early signal)
| BB Oscillator / HT / RQK | ❌ Still bearish (lagging)
---
## 🎯 Trade Idea
**Bias:** Long
**Trigger:** Break above **minor Supply** and formation of BOS
**Target Zones:**
1. **TP1:** 3,370
2. **TP2:** 3,378 (supply edge)
3. **TP3:** 3,385 (upper supply zone)
**SL:** Below point (c) @ **~3,357**
---
## 🧠 Notes
This setup is valid as long as price holds above the Demand Zone and confirms a bullish shift via BOS. Wait for clear confirmation before entering.
_This is an educational idea based on Smart Money + Elliott Wave principles – not financial advice._
---
#gold #smartmoney #supplydemand #elliottwave #sslhybrid #intraday #5mtf #tradingview

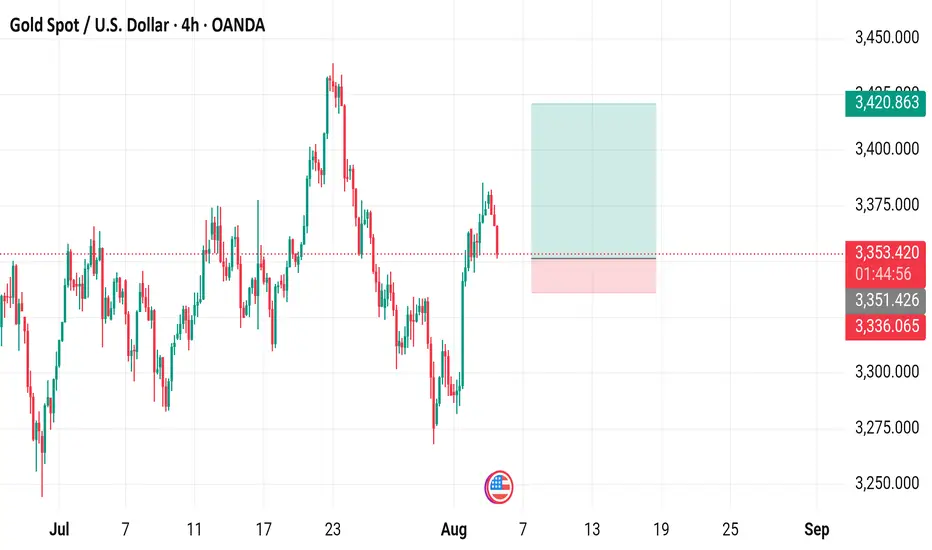
Gold Spot / U.S. Dollar (XAU/USD) - 4 Hour Chart (OANDA)4-hour chart from OANDA shows the recent price movement of Gold Spot (XAU/USD), currently at $3,353.240, down $20.395 (-0.60%). The chart highlights a sell price of $3,353.010 and a buy price of $3,353.450, with a shaded area indicating a support/resistance zone around $3,351.426 to $3,353.240. The data reflects trading activity from July to early September 2025.
8/5: Watch for Short Opportunities Near 3400Good morning, everyone!
On Wednesday, gold held above the key support area at 3343–3337, and subsequently broke through the 3372–3378 resistance zone, leading to a strong bullish move and solid long-side gains.
Today, attention should shift to the major resistance around 3400. If bullish momentum continues, price may approach the secondary resistance near 3420. However, from a technical perspective, signs of bearish divergence have begun to emerge. Should price continue rising while momentum weakens, the risk of a short-term correction increases accordingly.
Key levels to monitor:
Primary resistance zone: 3404–3416
Intermediate supply area: around 3398
Crucial support zone: 3372–3363 (a hold here could support further upside)
⚠️ Cautionary Note:
The US PMI data release during the New York session could introduce volatility. Be sure to maintain strict risk management and stop-loss discipline during periods of increased uncertainty.
🔁 Trading Bias for Today:
Prefer selling into strength near resistance, while cautiously considering buying on dips near support.
The 3343–3337 area continues to serve as the primary support zone, and price action around this level will be critical in determining the next directional move

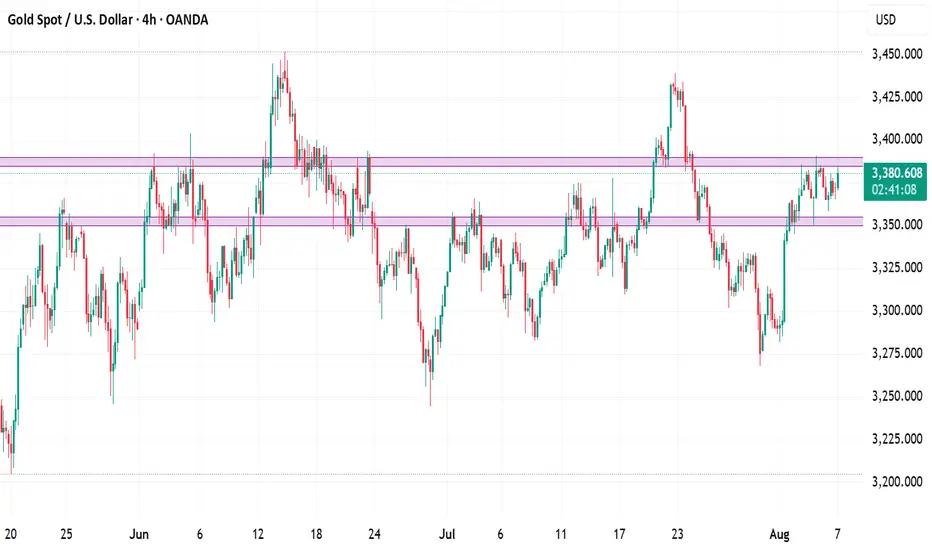
Gold Spot / U.S. Dollar (XAUUSD) 4-Hour Chart - OANDA4-hour performance of the Gold Spot price against the U.S. Dollar (XAUUSD) from late July to early August 2025. The current price is 3,362.895, reflecting a +72.775 (+2.21%) increase. Key levels include a sell price of 3,362.200 and a buy price of 3,363.590. The chart highlights a recent upward trend with a notable resistance zone around 3,395.716 and a support level near 3,336.129, as indicated by the shaded areas.

XAUUSD:BUYThere is no need to worry about holding long orders mentioned last Friday. Gold prices continued to rise this week after a pullback. The price has risen to 3372. According to the research team of our swing trading analysis team, the bullish trend will continue.
Earlier I informed members that some buy orders were closed at high levels. At that time, the short-term high was around 3370. After closing the long orders, the price subsequently fell. This is the advantage of swing trading. You can use accurate trading signals to trade in batches in the short term, thereby creating opportunities for quick profits.
After the pullback, there is still good room for buying and opportunities.

8/4: Watch Support at 3343–3337 and Resistance at 3372–3378Good morning, everyone!
Last Friday, gold rallied strongly, driven by a combination of favorable economic data and bullish technical signals, decisively breaking above the 3337–3343 resistance zone. During the subsequent pullback, price action remained firm above 3337, followed by a secondary upward move.
From a technical standpoint, the structure suggests the potential for continued upward consolidation, with the possibility of filling the gap near 3396. However, significant resistance remains between 3372 and 3378 — failure to break through this zone decisively may result in a short-term pullback before further gains.
Key levels to watch:
Initial support: 3348 and 3337–3343 zone
Major support: 3312–3300 zone (a break below could signal deeper downside risk)
Trading Strategy:
Focus on intraday setups around these critical areas. Look for buy opportunities on dips as long as support holds, while remaining cautious of sharp pullbacks near strong resistance.

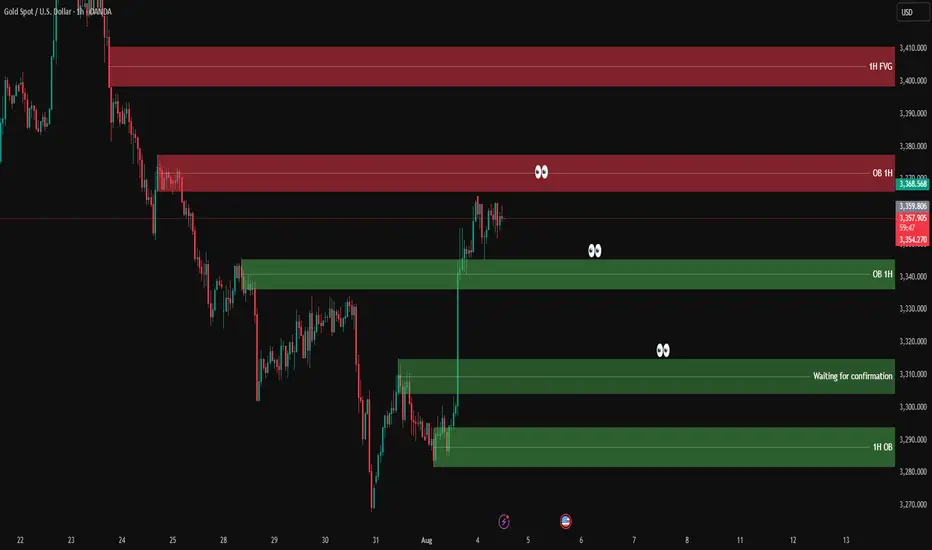
XAUUSD analysis - 1H FVG and OB setupsOn the 1H chart, price has made a sharp bullish move from the lower 1H OB zone (3,275 – 3,285) and is now hovering just below the 1H supply zone.
🔴 1H Supply Zone (OB):
3,354 – 3,368 → Price is consolidating here with no strong rejection yet.
🟢 1H Demand Zone (OB):
3,337 – 3,344 → First area to watch for potential bullish reaction.
👁 Mid-level support zone (waiting for confirmation):
3,310 – 3,320 → If price pulls back here and gives confirmation on lower timeframe, we’ll look for long setups.
📌 Trade scenarios:
1️⃣ Bullish: Wait for a retracement into 3,310 – 3,320, and if confirmed on LTF (3M–5M), go long.
2️⃣ If price drops deeper into the lower OB zone 3,275 – 3,285 and gives strong bullish reaction → potential long setup again.
3️⃣ Bearish: If price rejects the current OB zone (3,354 – 3,368) with confirmation → short entry targeting the green zones below (~3,320 or 3,310).
✅ Entry only after confirmation on lower timeframe
❌ No confirmation = no trade
Smart Money / Price Action 5min scalping road map# 📈 ABC Pattern Explained for TradingView (Smart Money / Price Action)
The **ABC pattern** is a 3-leg corrective move in market structure, commonly used in price action, Elliott Wave, and Smart Money trading. It's mainly used to identify **pullbacks** or **correction zones** before a continuation of the main trend.
---
## 🔹 Structure of the ABC Pattern:
- **Point A**: The beginning of the move — often the end of a strong impulsive wave.
- **Point B**: The first retracement or pullback from Point A.
- **Point C**: The second corrective move that often goes beyond A, forming the completion of the correction phase.
The ABC legs can be:
- **A to B**: Impulsive or corrective.
- **B to C**: Generally a counter-trend retracement.
---
## 🔸 How to Identify on Chart:
1. **Find a strong trend** (uptrend or downtrend).
2. **Look for the first correction** — mark it as Point A to B.
3. **Next wave** that attempts to continue the trend but fails — mark the end as Point C.
4. **Use Fibonacci tools** to measure:
- **B retracement of A** (typically 50%–78.6%)
- **C extension** of AB (typically 127.2%–161.8%)
---
## 🔧 How to Draw on TradingView:
> You can use the `Trend-Based Fib Extension` tool or draw manually using the `Path` or `ABC pattern` tool.
### Step-by-Step:
1. Select the `ABC Pattern` tool from the **left toolbar** under “Prediction and Measurement Tools”.
2. Click on **Point A** (3320$).
3. Click on **Point B** (3350$).
4. Click on **Point C** (final corrective wave 3300$ ).
5. TradingView will automatically plot the shape with labels.
---
## 🧠 Pro Tips:
- Look for **liquidity sweep** or **order blocks** near Point C.
- Entry opportunity is often **after C**, targeting a **continuation** of the main trend.
- ABC is often part of **larger structures** like **complex pullbacks** or **smart money retracements**.
---
## ✅ Example Use:
- **Buy Scenario**:
- Strong uptrend → Price drops from A to B (retracement).
- Then price rises to C, failing to break above A → Possible new higher low formed.
- Enter long if price breaks above Point B again.
- **Sell Scenario**:
- Strong downtrend → A to B is a pullback.
- C attempts new high, fails → short entry after break of B.
---
## 📌 Settings Tip for Mobile Users:
- Zoom in for better point control.
- Use “Lock” feature to prevent accidental move.
- Customize color and label visibility in the style tab.
---
## 🔍 Keywords:
`ABC Pattern`, `Elliott Correction`, `Smart Money`, `Liquidity Grab`, `Break of Structure`, `Trend Continuation`, `Price Action Trading`, `Market Structure`
---
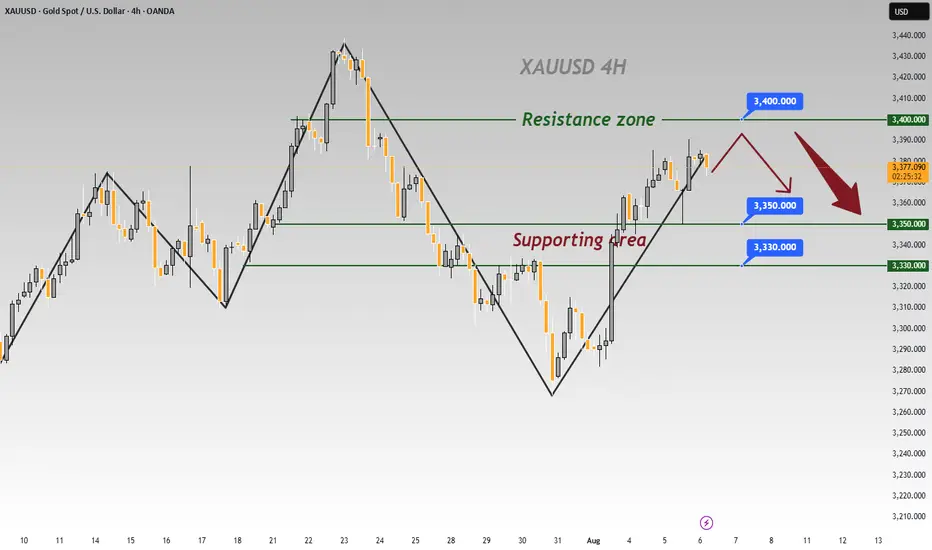
XAUUSD Possibility of a small correction towards 3330, re-entering the bearish phase and moving towards the specified targets

GOLD Correction Ahead!
HI,Traders !
#GOLD is growing strongly
And the pair looks locally
Overbought so after it
Hits the horizontal resistance
Area around 3374.56 we will
Be expecting a local bearish
Correction and a move down !
Comment and subscribe to help us grow !
