XAUUSD: Short if resistance at 4050 is not broken.Gold prices plunged by approximately $100 yesterday, from a high of around 4110 to around 4010.
Looking at the current 1-hour chart:
It's clear that the 4010-4000 area represents a support level from the previous rapid rise.
If the price fails to break below 4000, a bottoming-out rebound is possible.
The current resistance level is around 4050.
After breaking below 4050 last night, 4050 has become resistance.
Gold is currently likely to consolidate within the 4000-4050 range.
Which way will the breakout occur next?
If gold prices return above 4050, the trading range will revert to 4050-4100.
Conversely, if it breaks below 4000, the subsequent range will become 4000-3950.
Therefore, as long as the 4000-4050 range remains unbroken, I recommend maintaining a range-bound trading strategy, buying low and selling high, and avoiding chasing highs and lows.
Gold is currently at 4050, a short position can be initiated.
Xauusdsetup

ANFIBO | Gold XAUUSD - In a Bearish structure yet? [11.18.2025]I'm Anfibo, Here's my XAUUSD Daily Trading Plan ;)
Overall Picture:
OANDA:XAUUSD has officially broken its bullish structure, confirming a shift in market sentiment and signaling that the upward momentum has cooled off. With the H1 trendline decisively breached, we now transition from a “buy-the-dip” mindset to a sell-the-rally strategy. The nearest resistance sits at 4058, a strong confluence zone where multiple technical barriers align. If price pushes beyond this level, the next supply areas to watch are 4104 and 4146 — regions likely to act as retests of the broken trend, providing high-probability opportunities for continuation sells. The overall expectation for today is further downside movement as long as gold remains below these resistance zones.
Given the current structure, the market is presenting a classic post-breakdown setup, where rallies into resistance should be treated as opportunities to position for the next leg down. As long as gold remains capped below these key supply zones, the medium-term outlook remains bearish with targets toward the psychological level of 4000 and deeper.
Trading Plan for Today:
>>> SELL ZONE:
(1) ENTRY: 4055 – 4060
SL: 4075
TP: 4000 – 3950 – 3920
(2) ENTRY: 4100 – 4110
SL: 4120
TP: 4000 – 3970
Risk Management:
Prioritize sell setups only, as the bullish structure is no longer valid.
Keep stops tight above resistance zones to avoid false breakouts.
Maintain Risk:Reward ≥ 1:2 on all entries.
Avoid buying unless the market reclaims and stabilizes above 4146 with strong momentum.
Conclusion:
With the break of the upward structure, gold has transitioned into a bearish phase. We will stay patient and sell into rallies, especially near the strong resistance clusters at 4058, 4104, and 4146. As long as price remains below these levels, the path of least resistance continues downward toward the 4000 and 3950 targets. Stick to the plan, trust the structure, and let the market flow in our favor.
HAVE A SWEET PROFIT DAY, GUYS!

XAU/USD 18 November 2025 Intraday AnalysisH4 Analysis:
-> Swing: Bullish.
-> Internal: Bullish.
Analysis and bias remains the same as analysis dated 20 October 2025.
Price has printed as per previous intraday expectation by printing a bearish CHoCH which indicates, but not confirms, bullish pullback phase initiation.
Price is currently trading within an established internal range, however, I will continue to monitor price with regards to depth of pullback.
Intraday expectation:
Price to continue bearish, react at either discount of 50% internal EQ, or H4 supply zone before targeting weak internal high priced at 4,380.990.
Note:
The Federal Reserve’s sustained dovish stance, coupled with ongoing geopolitical uncertainties, is likely to prolong heightened volatility in the gold market. Given this elevated risk environment, traders should exercise caution and recalibrate risk management strategies to navigate potential price fluctuations effectively.
Additionally, gold pricing remains sensitive to broader macroeconomic developments, including policy decisions under President Trump. Shifts in geopolitical strategy and economic directives could further amplify uncertainty, contributing to market repricing dynamics.
H4 Chart:
M15 Analysis:
-> Swing: Bullish.
-> Internal: Bullish.
As per analysis dated 14 November 2025, price has printed a bearish CHoCH to indicate, but not confirm bearish pullback phase initiation.
Price is currently trading within an established internal range.
Intraday expectation:
Price to trade down to either discount of 50% internal EQ, or M15 demand zone before targeting weak internal high, priced at 4,245.195
Note:
Gold remains highly volatile amid the Federal Reserve's continued dovish stance, persistent and escalating geopolitical uncertainties. Traders should implement robust risk management strategies and remain vigilant, as price swings may become more pronounced in this elevated volatility environment.
Additionally, President Trump’s tariff announcements, particularly against China, are expected to further amplify market turbulence, potentially triggering sharp price fluctuations and whipsaws.
M15 Chart:

XAU/USD Intraday Plan – Watching Reaction at Support ZoneAfter a brief consolidation yesterday, gold dropped into the Support Zone and is currently trading around 4014. Market structure remains bearish, with price sitting below both the MA50 and MA200. The series of rejection wicks shows buyers are trying to push back, but momentum is still with the sellers for now.
The first resistance is at 4027. For buyers to gain traction, we need a clean break above 4027, followed by a break above 4053 — only then could we see an attempt toward 4078.
If price fails to hold the Support Zone and breaks below 3,996, the next downside target becomes the HTF Support Zone — a major area where buyers have reacted strongly in the past.
📌Key levels to watch:
Resistance:
4027
4053
4078
Support:
3996
3968
3921

GOLD (XAU/USD): THE BATTLE OF NFP AND THE FED!1️⃣ TECHNICAL VIEW (TA): Awaiting Sell Confirmation
Structure: The short-term uptrend has ended, prices are adjusting/reversing.
Main Supply Zone (Order Block - OB): Prices are retracing to the ideal sell zone (around $4,064 - $4,081).
Strategy: Prioritize seeking SELL signals at the OB zone.
Targets: $3,976 and $3,931 if the OB zone holds.
2️⃣ FUNDAMENTAL VIEW (FA): Interest Rate Pressure
Selling pressure is increasing from:**
Fed Rate Cut Expectations Diminish: The probability of a 25bps rate cut in December has fallen below 50%. The "Higher for Longer" signal reduces Gold's appeal.
Upcoming Risks: The market awaits NFP and FOMC Minutes. Strong data will bolster USD and sink Gold.
⚠️ Opposing risks: Uncertainty from the U.S. Government shutdown and geopolitical tensions (Russia/Ukraine) may restrain the decline.
#XAUUSD #Gold #TradingSetup #SELLZone #Fed #NFP #PriceAction #SmartMoneyConcepts #Forex

Gold Losing 4050 Support – 4K Now at Risk1. What Happened Yesterday
Gold broke below the key 4050 support zone and continued to decline, coming very close to the psychological 4000 level.
This is the most significant bearish continuation we’ve seen since the strong rally earlier this month.
2. Current Market Context
At the time of writing, price is showing only a weak and shallow rebound, hovering around 4017.
Momentum remains bearish, and structurally, the market looks vulnerable to a clean break below 4K.
3. Technical Outlook
If price continues lower, the 3950–3970 zone becomes highly relevant. This area represents a medium-term bullish demand zone, and a drop into it could offer a meaningful buying opportunity — but only with confirmation.
Right now, the structure remains bearish. A genuine shift back to bullish conditions would require:
- A reclaim of 4050, and more importantly
- A stabilization above that level, not just a wick or intraday spike.
Without that, any bounce is just noise inside a bearish trend.
4. Trading Plan
- Bearish bias remains active as long as price trades under 4050
- A flush into 3950–3970 could be a buy zone, but only if price shows clear support and reversal signs
- Until then, bulls are on defense, and shorts continue to have the advantage
5. Conclusion
Gold is under pressure, and a break below 4K is a strong possibility. A deeper drop may eventually turn into an opportunity for medium-term buyers, but at this moment the structure is bearish and caution is required.

XAUUSD LONG SETUP ( 17 NOV 25 )If you have doubt on our trades you can test in demo.
OANDA:XAUUSD LONG
TP: 4110.522
SL: 4054.303
Trade Ideas:
Idea is clearly shown on chart + we have some secret psychologies and tools behind this.
Trade Signal:
I provide trade signals here so follow my account and you can check my previous analysis. So don't miss trade opportunity so follow must.

Gold Price Outlook – Trade Setup (XAU/USD)📊 Technical Structure
OANDA:XAUUSD XAUUSD Gold (XAU/USD) continues to drift lower, now trading around $4,030–$4,035, following a sharp decline from last week’s highs above $4,150. The 1-hour chart shows price pressing into a major support zone between $3,993–$4,005, which has historically attracted buyers.
Immediate resistance lies at $4,079–$4,089, a supply region that capped upside attempts earlier. A recovery toward the resistance zone is possible if the support zone holds, though the broader structure remains corrective.
A close below $3,989 would invalidate the rebound setup and expose downside potential toward $3,960.
🎯 Trade Setup
Idea: Buy from support zone for a corrective rebound into resistance.
Entry: $3,993 – $4,005
Stop Loss: $3,989
Take Profit 1: $4,079
Take Profit 2: $4,089
Risk–Reward Ratio: ≈ 1 : 4.95
Bias is cautiously bullish from support, but sentiment remains fragile due to macro headwinds.
🌐 Macro Background
Gold extended losses into Tuesday’s Asian session, trading near $4,030, weighed down by renewed U.S. Dollar strength and hawkish remarks from Federal Reserve officials.
FXStreet reports: “Gold price declines below $4,050 as USD strength and hawkish Fed comments weigh on sentiment.” 【FXStreet】
USD Strength:
The U.S. Dollar has strengthened for a third consecutive day, making gold more expensive for foreign buyers and pressuring the metal’s short-term outlook.
Delayed U.S. Data & NFP Ahead:
With the record-long U.S. government shutdown delaying official economic data, traders are now focused on Thursday’s NFP release, which may steer Fed expectations.
Hawkish Fed Commentary:
Officials including Atlanta Fed President Raphael Bostic and Kansas City Fed President Jeff Schmid expressed concern about persistent inflation and signalled a preference for keeping rates steady.
Rate Cut Expectations Drop:
CME FedWatch shows rate-cut expectations for December falling to 45%, down from over 60% last week.
UBS noted that the “totality of data” before the December meeting may still lean toward supporting a third rate cut this year.
China Buying Gold:
China added 15 tons to its gold reserves in September, providing medium-term support but insufficient to offset immediate USD-driven pressure.
Overall, macro drivers remain mixed: strong USD and hawkish Fed weigh on gold, while central bank demand and uncertainty offer a buffer at lower levels.
🔑 Key Technical Levels
Resistance: $4,079 – $4,089
Support: $3,993 – $4,005
Psychological Level: $4,050
📌 Trade Summary
Gold remains under pressure but is testing a major support zone around $3,993–$4,005. If this area holds, a corrective rebound toward $4,079–$4,089 is likely. However, continued USD strength or firmer Fed rhetoric could limit upside momentum.
⚠️ Disclaimer
This analysis is for reference only and does not constitute trading advice. Trading involves significant risk, and proper risk management is essential.

Gold: Watch Resistance at 4070–4114 Ahead of NFPGold dropped below 4010 during yesterday’s late session but quickly rebounded afterward, and many traders should have captured that long opportunity.
For today’s session, the main focus remains on whether the 4000 psychological level can hold.
Key resistance levels to watch:
4070 (first resistance)
4082–4091 / 4097–4104
Major resistance at 4110–4114
The 4020–4000 zone may see repeated fluctuations, but in the short term it will continue to attract buying interest. Therefore, buying on dips still carries a relatively high probability of success.
If price breaks below 4000 again, pay close attention to:
3986–3966 zone
3932 support
These areas represent the origin of the recent rebound. Previously trapped short positions are likely to cover and reverse into longs once they get out, while trapped longs above 4200 may also add positions to lower their average cost—both forces combined could provide solid support for another rebound.
Once gold returns above 4100, caution is necessary:
Watch 4070 as the key support during any pullback
If this level holds and the upcoming NFP report does not pressure the bulls, the market may attempt another move toward 4200
However, if the data turns out bearish, multiple catalysts could empower the bears, leading to another downward move to retest the critical 3886 support level
Overall, the short-term outlook remains dominated by key support/resistance interactions, while the medium-term direction depends on whether 4000 holds and whether upcoming macro data can revive bullish sentiment.

My predictions and analysis of gold todayThe core conclusions of today's Gold analysis are highly consistent with the actual market trend, and all key judgments have been verified.
1-Accurate Trend Prediction:
We clearly indicated that London Gold would continue the correction that began on the 15th, showing a slight downward trend under pressure amid fluctuations, with the short-term trend in an adjustment phase.
2-Effective Identification of Key Support and Resistance Levels:
We precisely locked in the core support around 4030, with the 4000 round number as the secondary support. We also pointed out that short-term resistance is concentrated near 4120. Today, the Gold oscillated between 4049 and 4106, verifying the effectiveness of these support and resistance levels.
3-Precise Trading Strategy:
A clear trading strategy was provided early in the day, and all aspects of it have been validated by today's market movement.
Gold Trade Set Up Nov 17 2025Price is in an overall bearish trend but has left a 4h FVG and BSL that i will want to see filled before making a continuation back down towards SSL

XAUUSD: Wave 5 at the start or the last throwback of the bulls?XAUUSD: Wave 5 at the start or the last throwback of the bulls?
🌀 Wave Context
According to WebMile, on the weekly chart, gold is in the process of forming wave 5 (of a higher degree), while the current corrective rally is wave 4, developing within a larger structure.
This means that the gold market is currently balancing between continuing its long-term momentum and a possible medium-term pullback.
🛠 Key Support and Resistance Levels
Resistance: approximately $4,000–$4,030, an area where bulls could face a significant obstacle.
Secondary Resistance: $3,750, the target of a potential upside within the impulse according to short-term analysts.
Support: approximately $3,841–$3,864, the area where wave (4) of the correction is developing.
Deeper Support: $3,320–$3,230, a larger support level targeted by a correction in wave C under one of the scenarios.
📈 Weekly Scenarios
Bullish Scenario:
Gold holds the $3,841–$3,864 zone → completes wave 4 correction → breaks above $4,000+ → potential wave 5 development.
Corrective Scenario:
Price fails to hold the $4,000 resistance and pulls back → wave C develops → decline to $3,320–$3,230 could be part of a deeper correction.
Consolidation:
XAU/USD could trade in the $3,850–$4,000 range, accumulating energy before the next move until a clear breakout signal is seen.
✅ Conclusion
Gold is at a key point for the coming week: either the bulls complete the correction and initiate a new momentum, or the correction deepens.
We need to monitor the reaction to the $3,841–3,864 (support) and $4,000 (resistance) levels.
The wave structure currently allows for both scenarios—it's important to wait for confirmation!

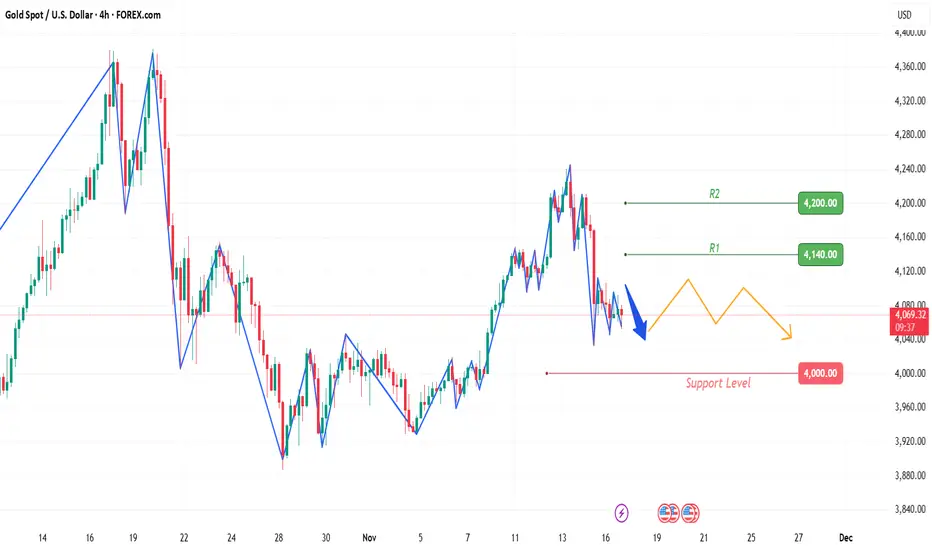
XAU/USD (Gold) 1H: Bearish Continuation Setup after BOSKey Observations and Market Structure
Previous Trend: The price experienced a significant downtrend following a peak around $4,180 to $4,200.
Break of Structure (BOS): A clear Break of Structure (BOS) to the downside confirms the shift from a potential uptrend/consolidation to a bearish trend continuation, with a key low being broken around $4,140.
Current Price Action and Consolidation: After the sharp drop, the price has entered a period of consolidation or short-term reversal attempt, currently trading around $4,087.53.
Identified Trading Range: The analyst has marked a specific Contraction Range (CRT) with a High (CRT-H) around the $4,140 level (the broken BOS level) and a Low (CRT-L) around the $4,075 level. This range defines the immediate trading boundaries.
Supply/Resistance Zone: A grey rectangular box is highlighted just below the CRT-H, approximately between $4,100 and $4,110. This zone likely represents a supply/resistance area (e.g., an Order Block or liquidity zone) where the price might react.
Trading Hypothesis (Based on Annotations)
The arrows and markings suggest a bearish setup within the context of the larger downtrend:
Anticipated Move Up (Liquidity Grab/Re-test): The first upward arrow indicates an expectation for the price to move up, possibly into the marked supply zone ($4,100-$4,110) or even toward the CRT-H ($4,140). This would be a move to fill inefficiencies, re-test the broken structure, or capture liquidity (a pullback).
Anticipated Move Down (Continuation): The curved arrow suggests that once the price reaches the supply zone/CRT-H, it is expected to reverse and continue the larger downtrend, aiming for levels below the CRT-L, potentially targeting $4,040 or lower.
The analysis appears to be using a Smart Money Concept (SMC) approach, focusing on market structure, liquidity, and supply/demand zones for short-term entry points (e.g., selling near the supply zone/BOS level).

GOLD Best Places To Buy And Sell Cleared , 500 Pips Waiting !Here is m y opinion on GOLD On 15 Mins T.F , We have a Good movement since Last 2 weeks , and we have a range now for 1 Week started between 4050.00 to 4099.00 so we can buy and sell Gold This Week from 2 areas , 4050.00 will be the best place for Buy and range between 4095.00 to 4099.00 will be the best place for Sell , now the price very near selling area so we can wait the price to retest the res area and then enter a sell trade and targeting 4050.00 and when the price touch it and give us a good bullish P.A , we can enter a buy trade and targeting 4099.00 , It`s All Depend On Price action , if we have a daily closure below our support then the price will go down more and more after huge movement to upside .
Entry Reasons :
1- Highest Level The Price Touch It
2- Broken Res
3- New Support Created .
4- Clear Price Action .
5- Clear Support & Res .
6- Price Range Cleared .

Gold: Under PressureGold is slightly lower today, extending the correction that began on the 15th. Prices are under pressure amid fluctuations, with long and short factors intertwined, keeping the short-term trend in an adjustment phase.
From a technical perspective, the key support level for London Gold in recent sessions lies around 4030, the lowest point of the November correction. Currently, gold is trading above this support level, temporarily in a relatively safe range. If the 4030 support is breached, gold may further decline to the 4000 level to seek support.
Resistance is concentrated near the 4120 mark. A close above this level is likely to trigger a rally toward 4140 and 4180, with the critical resistance at 4210. For the bulls to reverse the short-term weakness, they must first break through this key resistance level.
Trading Strategy:
Buy 4040 - 4050
SL 4030
TP 4100 - 4110 - 4120
Sell 4110 - 4120
SL 4130
TP 4070 - 4060 - 4050

GOLD (XAU/USD): 2 Crucial Trades Before the NFP Storm!📉 Technical Analysis (SMC - 2H)
Trend: Downtrend after clear MSS/BOS.
Focus: Price is retracing to the Selling Zone (Premium) to fill the FVG.
⚔️ Detailed Trading Plan (R:R > 1:2)
1. Preferred Strategy: SELL Limit (Trend Following)
Entry: 4,157.782 (FVG Peak - Supply Zone)
Stop Loss (SL): 4,206.895 (Safe SL above nearest structural peak)
Take Profit 2 (TP2): 4,051.733 (Main structural target - Nearest low)
Objective: Participate in the ongoing downtrend.
2. Countertrend Strategy: BUY Limit (Technical Rebound)
Entry: 4,051.733 (Nearest structural low - Support)
Stop Loss (SL): 4,018.699 (SL below lower FVG)
Take Profit 2 (TP2): 4,126.333 (Rebound to upper FVG low)
Objective: Capitalize on the technical rebound from strong support.
🚨 Key Risk: This Week's Focus
Hawkish Fed: Officials like Schmid affirm high inflation, unwilling to ease policy, maintaining high interest rates (Negative for Gold).
Major News: FOMC Minutes (Wednesday) and especially NFP (Thursday) will determine short-term momentum for USD/Gold.
Risk Management: Gold will be highly volatile from Wednesday. Adhere to SL and manage capital under 2% per trade.
#Gold #XAUUSD #Forex #TechnicalAnalysis #FVG #SmartMoney #Fed #NFP #TradingView

Xauusd Next MoveXauusd After Fundamental News Was Out Of Control No We Have Best Buying 4040
For Target 4238
Buy Sell Your Own Research I Am Not Responsible Of Your Any Lose
Stay Tuned for more updates

Gold Price Outlook – Trade Setup (XAU/USD)📊 Technical Structure
OANDA:XAUUSD Gold (XAU/USD) has stabilized near $4,077 after retracing from last week’s highs above $4,200. The short-term chart shows a range-bound consolidation, with support at $4,068–$4,078 and resistance at $4,145–$4,156.
Price action suggests a potential recovery setup if the support zone holds firm. A sustained move above $4,090 could open the door for a short-term rebound toward the $4,150 zone, though sellers may reappear near resistance. A close below $4,060 would invalidate this bullish scenario, signalling the potential for a deeper pullback toward $4,030.
🎯 Trade Setup
Idea: Buy near support for potential rebound toward resistance zone.
Entry: $4,068 – $4,078
Stop Loss: $4,064
Take Profit 1: $4,145
Take Profit 2: $4,155
Risk–Reward Ratio: ≈ 1 : 4.82
Bias remains cautiously bullish as long as gold sustains above the $4,068–$4,078 level.
🌐 Macro Background
Gold started the week with a modest rebound near $4,105, supported by a softer U.S. Dollar as traders awaited fresh macro data and commentary from key Federal Reserve officials.
FXStreet’s latest analysis highlights that “Gold price recovers some lost ground to near $4,105, snapping the two-day losing streak as the softer USD provides a tailwind.” 【FXStreet】
Fed Commentary: Several Fed members — John Williams, Neel Kashkari, Philip Jefferson, and Christopher Waller — are scheduled to speak later today. Their tone will be crucial for shaping rate-cut expectations into December.
Government Reopening: Following President Donald Trump’s approval of the funding bill, the U.S. government officially reopened after a 43-day shutdown, the longest in U.S. history. This event has improved sentiment, weighing slightly on safe-haven demand.
Economic Data Uncertainty: Analysts warn that once delayed data resumes, it will likely reveal labor market weakness and signs of a slowdown, which could renew rate-cut speculation and underpin gold.
Fed Stance: Meanwhile, Kansas City Fed President Jeff Schmid struck a hawkish tone, saying policy should “lean against demand growth,” describing current settings as “modestly restrictive.”
Market Pricing: According to CME FedWatch Tool, markets now price a 54% chance of a 25bps cut in December, down from 62.9% last week — signaling reduced near-term dovishness.
Overall, gold’s direction this week hinges on Fed communication and data resumption signals — with broader bias remaining constructively bullish on economic uncertainty.
🔑 Key Technical Levels
Resistance: $4,145 – $4,156
Support: $4,064 – $4,078
Psychological Level: $4,100
📌 Trade Summary
Gold holds above short-term support at $4,068, suggesting buyers may defend this zone. The structure favours a rebound toward $4,145–$4,155, especially if Fed remarks today are not overtly hawkish. However, continued strength in the USD or firmer Fed rhetoric could cap upside momentum near resistance.
⚠️ Disclaimer
This analysis is for reference only and does not constitute trading advice. Trading involves significant risk, and proper risk management is essential.

XAUUSD PLAN & IMPORTANT LEVELS FOR INTRADAY ( 17 NOV 25 )This chart shows the important support and resistance levels for OANDA:XAUUSD on the 30-minute timeframe. The price recently made a sharp fall from the upper resistance zone, and it is now holding above a minor support area. The market is trying to pull back, but the overall structure still looks bearish.
My plan is simple. If the price moves back into FX:XAUUSD the highlighted supply zone, I will wait for signs of rejection. If a clear bearish signal appears, I expect the market to continue falling towards the lower support near the green line. However, if the price breaks above the supply zone with strong momentum, then the bearish idea will be invalid for the moment.
Lets wait for a cleaner entry instead of rushing into trades.

XAUUSD 1H: Potential Reversal and Order Block RetestKey Technical Observations
Prior Downtrend: The price has experienced a sharp decline from its high near $4,240, breaking through several support levels.
Break of Structure (BOS): A Break of Structure (BOS) was previously identified, signaling the continuation of the preceding uptrend when the $4,100 support level was broken to the upside on November 12th. However, the subsequent drop has now breached that same structural low to the downside, indicating a potential change in market character or at least a deep correction.
1H Sell/OB (Order Block): The current price is interacting with a key gray box labeled "1H SELL / OB" (Order Block), which is an area where significant selling pressure previously entered the market. The price has pushed below this block and is currently attempting to rally back toward it.
Bullish Setup Indication: The analysis on the chart shows a proposed inverse head-and-shoulders-like pattern or a short-term double bottom developing, characterized by the sharp move down and the immediate strong wick/reversal candle (the white circle/lightning bolt symbol) followed by an attempted bounce.
Projected Target: The chart projects a move back up to a "TARGET" level around $4,150. This move would likely involve breaking above the 1H SELL / OB zone.
Analysis and Interpretation
The setup suggests that traders are looking for a short-term long entry if the price can successfully move back into and hold above the previous support/resistance zone ($4,100 area) marked as the 1H SELL / OB.
Bullish Scenario: A successful break and close above the 1H SELL / OB zone would confirm the short-term bullish reversal attempt, aiming for the TARGET near $4,150. This could be a reaction to oversold conditions after the sharp drop.
Bearish Scenario: If the price fails to reclaim the 1H SELL / OB and continues to consolidate or drops below the recent low, the dominant bearish momentum from the recent peak would likely continue, targeting lower support levels.

XAU/USD Market Outlook — Bullish Move From 4,058.36 ZoneGold has retraced into a major demand zone around 4,058.36, where price has shown the first signs of bullish reaction after clearing liquidity below previous lows. This zone aligns with a prior accumulation block and serves as the origin of the last major bullish swing.
As long as price holds above this level, I expect a bullish continuation toward the upper liquidity region, with targets around 4,244.86, and ultimately the major high at 4,381.73.
My stop loss is positioned at 3,887.60, below the deeper demand zone and previous structural low, ensuring safety from intraday volatility while maintaining the bullish structure.

Weekly Gold SummaryThis week, Gold exhibited sharp volatility, first fluctuating upward and hitting a recent high on Thursday, followed by a sudden precipitous plunge on Friday. The overall trend shifted sharply from an upward trajectory to a significant pullback.
1.Early Week Strong Rally
During the European session on November 10th, gold initiated an upward movement, with a daily gain of 2.06% and a intraday high of 4084.84 USD/oz. In the European session the next day, it traded above the 4123 level and later climbed further to 4134.63 USD/oz, extending the upward momentum.
2.Mid-Week High Volatility Consolidation
In the middle of the week, gold maintained a high-level fluctuating pattern. On November 13th, the gold price performed strongly, not only breaking above the 4200 level but also hitting a recent new high of 4244 intraday, before retracing sharply afterward. On the morning of November 14th, the gold price continued to rise, maintaining a volatile rebound driven by multiple technical supports. However, hourly indicators such as RSI showed overbought signals, revealing short-term correction risks.
3.Weekend Precipitous Plunge
A sharp reversal occurred in the market on November 15th, with London Gold plummeting over 105 in a single day, touching an intraday low of 4032. This plunge was triggered by the confluence of multiple short-term bearish factors, including the shift in stance by Fed dovish officials, concentrated profit-taking by holders, and a cooling of safe-haven sentiment.
Nevertheless, the market generally views this as a short-term fluctuation rather than a reversal of the long-term upward trend.

The bullish structure remains intact, we remain bullish.#XAUUSD TVC:GOLD OANDA:XAUUSD
Looking at the hourly chart, the short-term resistance level is at 4210, which is also the high point of yesterday's NY session rebound. Although gold encountered resistance and pressure again during the day, as long as this resistance is broken, it will continue to test the 4245-4260 level.
Gold has fallen back again, but the bullish structure has not been broken in the short term. The current pullback can be regarded as a technical correction, so I am still inclined to be bullish on gold. The daily MA5 has also risen to around 4160, which is exactly the important support level I emphasized yesterday. Therefore, if the price retraces to 4160-4145 again during the European session, we can continue to go long on gold.
