ElDoradoFx – GOLD ANALYSIS (12/11/2025, US SESSION)🧭 Market Overview
Gold enters the US session trading around $4,129, holding above $4,110 after multiple rebounds during the London session. Volatility remains contained as traders await the US CPI release (13:30 UK) — a major catalyst for direction. The overall structure remains bullish but capped under the $4,138–$4,145 resistance zone, where sellers have defended since early Asia.
⸻
📉 Technical Breakdown
Daily (D1)
• Price maintains a bullish correction phase after bouncing from the $4,014–$4,020 demand zone.
• The 50EMA supports the uptrend structure, while RSI ~59 suggests room for continuation before overextension.
• A daily close above $4,138 may confirm bullish extension toward $4,160–$4,180, while failure below $4,098 reopens the path toward $4,050–$4,020.
1H (H1)
• Gold continues to trade within a narrowing ascending channel.
• Dynamic resistance aligns around $4,138–$4,145, coinciding with the 200EMA and recent liquidity wick.
• RSI consolidating near 55 and MACD histogram flattening — awaiting momentum breakout.
• The short-term equilibrium range is $4,110–$4,138, favoring dip buys unless a clean hourly close below $4,098 occurs.
15M–5M (Intraday)
• Price structure shows consecutive higher lows, maintaining bullish microtrend integrity.
• The Golden Zone retracement (4,122–4,110) aligns with the 61.8% Fibonacci and EMA confluence — a key support cluster for potential bullish reaction.
• RSI hovering near 50; MACD beginning to cross upward after consolidation — momentum shift likely post-CPI.
⸻
✨ Fibonacci Analysis (Last swing 4,095 → 4,138)
• 38.2% = 4,122
• 50.0% = 4,116
• 61.8% = 4,110
🎯 Golden Zone: 4,122 – 4,110
This zone remains the most efficient area for liquidity-based buy setups, provided market reaction confirms with bullish engulfing or CHoCH signals.
⸻
🎯 High-Probability Trade Scenarios
📈 BUY SCENARIO (Main Bias)
• Buy Zone: 4,122 – 4,110 (Golden Zone + 50EMA confluence)
• Targets: 4,138 → 4,160 → 4,175
• Stop Loss: Below 4,098
• Confirmation: Bullish engulfing or CHoCH on 5M–15M after liquidity sweep near 4,110.
• Comment: Momentum remains bullish above 4,110; any CPI downside reaction should be seen as retracement, not reversal, unless 4,098 breaks.
📉 SELL SCENARIO (Countertrend Liquidity Play)
• Sell Zone: 4,138 – 4,145 (Key liquidity area + 200EMA)
• Targets: 4,122 → 4,110 → 4,095
• Stop Loss: Above 4,152
• Confirmation: Bearish divergence on RSI or BOS below 4,124 on 15M timeframe.
• Comment: Valid only if CPI surprises to the upside, strengthening USD temporarily.
💥 Breakout Setup
• Trigger: Break & close above 4,145
• Retest: 4,138–4,140
• Targets: 4,160 → 4,175 → 4,190
• Stop Loss: Below 4,126
• Comment: A confirmed break above 4,145 would shift structure to fully bullish with renewed continuation toward the October highs.
⸻
🧠 Fundamental Watch
• US CPI report (13:30 UK) — expected to dictate volatility and direction for the remainder of the week.
• Consensus: A softer CPI print could weaken DXY and fuel gold upside above 4,145.
• DXY at 106.0 — holding flat; downside breakout below 105.8 would support bullish momentum on gold.
• Traders should expect fakeouts or volatility spikes 5–10 minutes before and after CPI release.
⸻
📌 Key Technical Levels
Type Levels Notes
Resistance 4,138 / 4,145 / 4,160 / 4,175 Major liquidity & supply area
Support 4,122 / 4,110 / 4,098 / 4,085 Intraday structure & Golden Zone
Golden Zone 4,122 – 4,110 Buy reaction area
Break Buy Trigger > 4,145 Bullish continuation confirmation
Break Sell Trigger < 4,098 Short-term reversal confirmation
⸻
🧾 Analyst Summary
Gold continues to respect its bullish structure, printing higher lows while consolidating below 4,145. The session’s directional move will depend heavily on CPI data. A confirmed break above 4,145 opens space toward 4,175–4,190, while rejection at that level may cause a short-lived retracement toward 4,110 before continuation.
⸻
📈 Final Bias Summary
Bias: 🔼 Bullish-to-neutral above 4,110
Invalidation: 🔽 Below 4,098
Volatility Trigger: US CPI (13:30 UK)
— ElDoradoFx PREMIUM 3.0 Team 🚀
⸻
Xauusdsetup

Gold Trade Set Up Nov 12 2025Price is trading within a range between PDH and PDL and has swept both internal BSL and SSL so i will wait for more structure to be formed on the 5m looking for buys either from internal SSL or for price to push lower to PDL before looking for buys from that level. Theres also daily FVG under PDL which will act as strong support if it reaches there

#XAUUSD: Upcoming Massive Swing Sell, Do Not Miss Out! **Overview on Gold – 12/11/2025**🏆
Gold has reversed from a key level, indicating a sustained bullish trend until it reaches the previous higher high zone. A minor correction may occur before bulls regain control and push the price towards our ‘premium selling zone’.
**Key Points and Strategy**🧠📊
💡 Gold has three primary targets, each suitable for swing entries. To account for market volatility, use a wider stop loss and close 25% of the position at each target level to progressively secure profits.
📌Consider buying gold until it reaches our defined selling zone; this will serve as an intraday buying setup. Continuously monitor market updates to adjust entries and exits accordingly.
📌The market is currently respecting major support areas, and the bullish momentum is supported by strong technical indicators. However, traders should be aware that intraday fluctuations are still likely. Additionally, gold prices are highly sensitive to macroeconomic factors, particularly interest rates, currency strength, geopolitical risk, and inflation. As of November 2025, global financial markets are navigating a mixed economic landscape.
📌Furthermore, the Federal Reserve has signalled that rate cuts may begin in early 2026, which weakens the US dollar and supports gold prices. Geopolitical tensions, including ongoing regional conflicts and trade disputes, continue to drive safe-haven demand for gold. A weaker dollar has been a primary tailwind for gold this year. If the Federal Reserve cuts rates as expected, gold could see further inflows from investors seeking to hedge against currency depreciation.
Disclaimer:
⚠️ Our analyses are for educational purposes only, you must do your own research and risk management before taking any financial decisions. Always analysis the chart yourself first before following any chart blindly ⚠️
Want To Support Us?
📌 You can like and comment our ideas/chart analysis which will encourage us to post such educational content❤️
Regards,
Team Setupsfx_

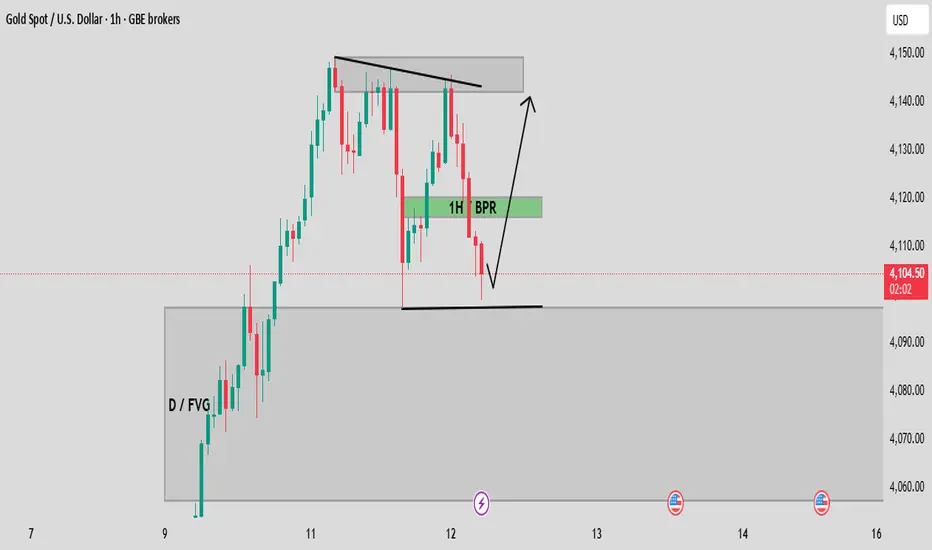
XAUUSD 1H: Price Action Analysis at Key ICT Levels (D/FVG and ?Current Price: The price is hovering around the $4,106 level, near the bottom of a smaller consolidation box.
Key Bullish Driver: The price is currently reacting to or hovering just above a major Daily Fair Value Gap (D/FVG).
A Fair Value Gap (FVG) is an area of price inefficiency (imbalance) left on the chart during a swift price move. It often acts as a magnet or a support/resistance zone when price returns to "fill" it.
Since the price is currently in the upper half of this Daily FVG, traders expect this area to provide strong support for a potential continuation of the uptrend.
Key Pivot Point (1H BPR): The green box is marked as a 1H Balanced Price Range (BPR).
A BPR is a zone where two opposing Fair Value Gaps (a bullish and a bearish FVG) overlap. This overlap signifies an area where the price has been "rebalanced," making it a high-probability zone for a reversal or strong rejection when tested.
The BPR, just above the current price, would be the first line of resistance if price starts moving up, or a re-entry point for buys if it drops lower and then reverses.
Potential Scenarios:
Bullish Continuation: Price uses the D/FVG as support and breaks above the local resistance (around 4,115) to target the recent highs in the 4,140-4,150 zone. (This is the expected move, indicated by the search results suggesting a bullish outlook toward $4,150).
Deeper Correction: Price fails to hold the upper boundary of the D/FVG and drops lower to test the midpoint or the bottom of the gap before finding institutional demand.
Short-term gold trading plan: buy low and sell highAfter a surge on Monday, gold prices traded sideways at high levels yesterday and today. This sudden shift in momentum was primarily due to news that the US government might end its shutdown.
On the surface, an end to the shutdown implies a crisis easing, which is typically beneficial for the US dollar and detrimental to gold. Therefore, in the short term, gold's upward momentum will likely be suppressed, potentially leading to a correction.
From a technical perspective, gold prices are currently oscillating between 4100 and 4150. The price has tested the 4150 resistance level three times since yesterday and failed to break through, indicating that this has become a key resistance level. The 4100 level has also been tested twice, suggesting strong support. Therefore, short-term trading should focus on buying low and selling high within the 4100-4150 range.
If gold prices break out of this range, we will need to revise our trading plan.
Markets are volatile, and with frequent news events expected soon, it is crucial to set stop-loss and take-profit orders to avoid getting trapped in a losing position.

XAUUSD Trade Setup: Gold at Resistance, Here's my Trade PlanXAUUSD Gold has seen a strong rally recently, pushing into a key resistance zone 🧱. With capital currently rotating out of safe-haven assets like gold and flowing into the stock markets, we could see a potential pullback from this level. 📉
At the moment, I’m avoiding buying at a premium price. Instead, I’ll be watching for a retracement back into equilibrium — around the 50% level of the recent swing range ⚖️.
If price pulls back, then breaks market structure to the upside, that could confirm renewed bullish momentum, and I’ll be looking for a long entry setup from that point. 🚀
⚠️ This analysis is for educational purposes only and not financial advice.

GOLD Best Places To Buy And Sell Cleared , 500 Pips Waiting !Here is m y opinion on GOLD On 15 Mins T.F , We have a Huge movement To Upside since Last 2 weeks , and we have a range now for 2 days started between 4100.00 to 4148.00 so we can buy and sell Gold This Week from 2 areas , 4100.00 will be the best place for Buy and 4148.00 will be the best place for Sell , now the price very near buy area so we can wait the price to retest the support area and then enter a buy trade and targeting 4148.00 and when the price touch it and give us a good bearish P.A , we can enter a sell trade and targeting 4100.00 , It`s All Depend On Price action . I`m Sure that the main direction now is buy so i`m interesting to buy gold from 4100.00 but the best place for me will be 4060.00 cuz the price didn`t retest it until now . if we have a daily closure below our support then this idea will not be valid anymore .
Entry Reasons :
1- Highest Level The Price Touch It
2- Broken Res
3- New Support Created .
4- Clear Price Action .
5- Clear Support & Res .
6- Price Range Cleared .

GOLD Breakout Done , Long Setup Valid To Get 300 Pips !Here is My 15 Min Gold Chart , and here is my opinion , the price going up very hard without any correction so we should move with it and we have a 4H Candle closure above our Res 4130.00 And Perfect Breakout and this give us a very good confirmation , so we have a good confirmation now to can buy after the price go back to retest the broken area 4130.00 One more time and we have already a great touch that take all stop losses before going up so i think the second touch will be better and will give us a good chance to enter with good stop loss , and we can be targeting 100 to 300 pips . if we have a daily closure below this area this mean this idea will not be valid anymore .
Reasons To Enter :
1- Perfect Touch For The Area .
2- Clear Bullish Price Action .
3- Bigger T.F Giving Good Bullish P.A .
4- The Price Take The Last High .
5- Perfect 4H Closure .

"Trading is a lonely journey, but the most rewarding""Trading is a lonely journey."
I had heard that saying a long time ago, but only when I stepped onto this path did I truly understand what it meant. On the first day I placed a trade, I thought everything was simple , just a few clicks, a few flickering green and red numbers, and I could make money. But the deeper I went, the more I realized that behind the screen was a cold, silent world where I was the only one facing myself.
No one understands the feeling of watching your account evaporate in just a few seconds. Nor can anyone share the tiny joy of a winning trade, because most outsiders only see the results — not the sleepless nights, not the heartbeats racing with every moving candle. Gradually, I learned to stay quiet : no more bragging about profits, no more complaining about losses. Trading taught me that emotions are the cruelest enemy.
There are days I stare at the chart until my eyes ache, my head spinning from those merciless price waves. I ask myself, “Am I really going in the right direction? Is trading even meant for me?” But then, in silence, I open my laptop again - analyze, take notes, place orders, as if it’s a habit I can’t let go of. Every loss hurts, but it also makes me stronger . I’ve learned to accept being wrong, to be disciplined, and to live with loneliness.
Trading isn’t just a battle with the market, it’s a battle with your own ego . It’s lonely, yes, but not meaningless. In that silence, I can hear my own thoughts more clearly ,my limits, and my desire to rise beyond them. Maybe only those who have walked this path can truly understand: behind every click lies countless emotions, unseen scars that only traders carry.
Trading is a lonely journey — but it’s also one of the most valuable journeys of all.
Try harder my friend! ;)
ANFIBO_

XAU/USD Intraday Plan | Gold Stalls Below 4153 ResistanceGold is currently trading around 4118 after a strong rally from the 4027 breakout. Buyers appear to be pausing after several failed attempts to clear the 4153 resistance, with price now consolidating just above the 50MA, which is acting as short-term dynamic support.
We need confirmed break above 4153 resistance for bulls to extend the move to 4197 and possible 4234.
However, if price loses the 50MA and 4115 support, we may see a move into the pullback zone. Failure to hold the key support at 4027 may bring the First Reaction Zone back into focus.
📌Key Levels to Watch
Resistance:
4,153
4,197
4,234
4,285
Support:
4,115
4,074
4,027
3,984
🔎 Fundamental Focus:
It’s a busy day for speeches, with multiple FOMC members scheduled to speak throughout the session — comments could spark volatility across USD pairs.
Meanwhile, markets are keeping a close watch on the scheduled House vote to approve temporary government funding and reopen the U.S. government.

ANFIBO | XAUUSD - Better Buy than Sell today [11.12.2025]Hello guys, Anfibo's here!
XAUUSD Analysis – Daily Trading Plan
Overall Picture:
OANDA:XAUUSD is currently trading within a sideways range between 4145 and 4100, showing signs of compression as the market awaits a potential breakout. After an extended bullish phase, price is now consolidating, creating equilibrium between buyers and sellers before the next directional move. The nearest key support zone lies between 4075 – 4095, followed by deeper demand areas around 4040 and 4006, which could serve as ideal buy setups if price retraces. Given the overall market structure and sustained bullish sentiment, I continue to favor Buy positions over Sell setups for today’s session.
Trading Plan for Today:
>>> BUY ZONE:
(1) ENTRY: 4075 – 4090
SL: 4070
TP: 4130 – 4150
(2) ENTRY: 4035 - 4045
SL: 4030
TP: 4090 – 4120 – 4150
(3) ENTRY: 4110 - 4115 (scalp/small vol)
SL: 4100
TP: 4140 - 4150
Risk Management:
- Prioritize Buy setups in line with the dominant trend; Sell only for short-term scalps.
- Keep stops tight, as a breakout can invalidate range setups quickly.
- Maintain a Risk:Reward ratio ≥ 1:2 on all trades.
- Avoid overtrading before the breakout confirmation.
Conclusion:
OANDA:XAUUSD is currently consolidating within a narrow sideways channel, but momentum continues to favor the bulls. As long as the price holds above 4075, the structure remains constructive, and the next bullish leg could form anytime upon breakout confirmation. My bias today stays bullish, focusing on buying dips near key supports and managing risk tightly until the market reveals its next move.
HAVE A WONDERFUL DAY, GUYS! ;)

Gold Price Outlook – Trade Setup (XAU/USD)📊 Technical Structure
OANDA:XAUUSD Gold (XAU/USD) extended its advance, reaching $4,147–$4,156, its highest level in over two weeks. The structure shows a bullish bias as the price consolidates above $4,120, with buyers likely to defend the Support Zone at $4,105–$4,111.
The Resistance Zone at $4,147–$4,156 aligns with a short-term overbought area where some profit-taking may occur. However, as long as the price remains above the $4,111 support, momentum favours a continued push toward the upper boundary of the channel.
🎯 Trade Setup
Idea: Buy near support, targeting a retest of resistance at $4,150–$4,156.
Entry: $4,111 – $4,106
Stop Loss: $4,105
Take Profit 1: $4,147
Take Profit 2: $4,156
Risk–Reward Ratio: ≈ 1 : 6.53
A confirmed break below $4,105 would invalidate this setup and may trigger a correction toward $4,092.
🌐 Macro Background
Gold’s momentum remains firm, buoyed by rising Fed rate-cut expectations and soft U.S. labour data, even as the U.S. government shutdown nears resolution.
FXStreet’s Lallalit Srijandorn noted, “Gold extends gains toward $4,150 as weaker U.S. jobs data and dovish expectations lift investor sentiment.” 【FXStreet】
Labor Market Weakness: According to ADP data, U.S. private-sector job creation fell by an average of 11,250 jobs per week in late October — signalling a slowdown in labour demand after the firm previously reported gains. This reinforces expectations that the Fed could deliver another rate cut by year-end.
Fed Outlook: The CME FedWatch Tool indicates a 68% probability of a 25 bps rate cut in December, and nearly 80% odds by January 2026, supporting gold’s medium-term bullish tone.
Government Shutdown Update: Bloomberg reported that the U.S. Senate passed a temporary funding measure backed by centrist Democrats, expected to end the record-long shutdown. This could marginally reduce safe-haven demand but is unlikely to shift gold’s structural momentum, as macro risks persist.
Fed Speakers Ahead: Comments from Fed officials John Williams, Christopher Waller, Raphael Bostic, and others later today may offer further guidance on the December policy path. Any dovish tone could extend gold’s rally beyond $4,156.
In short, while the resolution of the shutdown could momentarily weigh on gold’s safe-haven appeal, soft employment data and high odds of a December rate cut remain powerful bullish drivers.
🔑 Key Technical Levels
Resistance: $4,147 – $4,156
Support: $4,106 – $4,111
Psychological Level: $4,150
📌 Trade Summary
Gold remains supported above $4,110, with strong upward momentum likely to retest $4,147–$4,156. A buy-on-dip strategy near $4,111–$4,105 remains preferred as long as support holds. The bullish bias persists while the Fed cut outlook strengthens.
⚠️ Disclaimer
This analysis is for reference only and does not constitute trading advice. Trading involves significant risk, and proper risk management is essential.

XAU/USD:Post-Rally Retracement Holding Key Support for Bullish ?Key Observations:
Prior Bullish Momentum: The price experienced a significant, sharp uptrend leading up to the current area of consolidation/correction.
Support Zone: The price has recently dropped into and bounced from a highlighted Support zone, approximately between $4,100 and $4,115. This zone aligns with a previous resistance level that was broken, often serving as new support ("S/R flip").
Correction and Bounce: The move into the support zone looks like a correction or retracement of the strong previous rally. The bounce from this area indicates buyers stepping in, confirming the support.
Forecast (Projected Move): The green arrow and accompanying line suggest a bullish continuation trade setup. The expectation is that the price will move up from the support area to test the recent high, labeled as the Target at approximately $4,140.

My predictions and analysis of gold todayMy predictions and analysis of gold today were consistent with the day's market conditions:
1-Accurate judgment on support levels: The key support level at 4100 remained solid, and gold prices rebounded after hitting the bottom at this level, verifying the effectiveness of this support.
2-Consistency between oscillation/breakout forecasts and actual trends: Gold made multiple attempts to break through the 4145 resistance level but pulled back under pressure, with the high-level narrow-range oscillation in line with expectations. It was also clearly indicated that a breakout from the narrow range was likely during the U.S. session.
3-Effective trend and strategy guidance: The trading strategy provided in the morning aligned with gold's price movement, and the core strategy of prioritizing buying on pullbacks was emphasized, which fit the actual market rhythm.
4-Risk reminder: It was advised that one should not blindly chase the upward trend to avoid losses.

#XAUUSD: We are up 1040+ pips from our previous setup! Gold has risen from 3268 to 3364, helping us make substantial positive gains. However, after reaching the $3364 region, the price dropped around 3310 and has since been fluctuating between 3310 and 3340, making it challenging to trade. There’s a possibility that the price might touch 3400 once again before it drops.
Good luck and trade safely.
Thanks for your support! 😊
If you want to help us out, here are a few things you can do:
- Like our ideas
- Comment on our ideas
- Share our ideas
Team Setupsfx_
❤️

#XAUUSD :Is it a Correction Or a start of Major Bearish Trend? Gold has plummeted from 3550 to 3270, and it’s been falling steadily. We firmly believe that the price could reverse from either of our entry points, but given its significant drop, it raises concerns among traders. If the trend has shifted to bearish, it will likely continue to target buyers’ stop losses. In these market conditions, we strongly advise trading with utmost caution and prioritising risk management.
Good luck and trade safely.
Thanks for your support! 😊
If you want to help us out, here are a few things you can do:
- Like our ideas
- Comment on our ideas
- Share our ideas
Team Setupsfx_
❤️

#XAUUSD: Major Update 01/05/2025, Read Description! Gold has dropped over 700 pips since yesterday evening, suggesting further price correction. This is primarily due to strong US dollar data indicating potential correction in DXY Index prices. Additionally, there are speculations that the US has reached out to China for trade talks, although this has not been confirmed. Today and tomorrow are major trading days, with significant news expected to shape gold prices.
For now, you can monitor the prices or take entry if they reach your chosen risk management area. The decision to enter or exit is entirely up to your analysis.
Good luck and trade safely!
Thank you for your unwavering support! 😊
If you’d like to contribute, here are a few ways you can help us:
- Like our ideas
- Comment on our ideas
- Share our ideas
Team Setupsfx_
❤️🚀

XAUUSD(GOLD): +1874 PIPS Target| Touching $3600? Gold experienced a significant price surge, driven by the ongoing conflict between Iran and Israel. This heightened uncertainty among global investors led to a price touch of $3445. The current price is accumulating, and we anticipate a strong bullish distribution in the near future. Please prioritise accurate risk management during trading.
Good luck,
Team Setupsfx_

XAUUSD Potential for Short-Term CorrectionThe short-term outlook for the gold price FOREXCOM:XAUUSD is considered positive (bullish). This sentiment is supported by two key fundamental factors:
The potential end of the US government shutdown.
Market expectations for further policy easing from the Federal Reserve (The Fed).
Price Movement Scenario (Pivot: 4130)
The 4130 level serves as a pivot point, or a determinant of the direction of gold's movement in the near term.
⬆️ Bullish Scenario
If the price moves above 4130, further upside is expected, with the following targets:
Target 1: 4155
Target 2: 4168
Target 3: 4207
⬇️ Bearish Scenario
If the price moves below 4130, a bearish correction is likely, with the following targets:
Target 1: 4105
Target 2: 4085
Target 3: 4055

Gold Trade Set Up Nov 11 2025Price is trading above PDH and remains bullish on the 1h and 15m making HH/HL with a recent BOS and SSL sweep on the 15m so i will be taking buys to higher BSL levels and daily FVG to fill the imbalance

XAUUSD: Watch for a breakout during the U.S. sessionThe Gold is basically oscillating within a narrow range now, but the U.S. session is bound to break out of this range.
Gold has been consolidating for nearly a month, and finally, the consolidation ended at the end of October and the beginning of November. As the bullish momentum emerged, gold staged a bottoming rebound. As I’ve said before, in a strong upward trend, it’s unwise to call the top prematurely.
For trading strategies, I still recommend prioritizing buying on pullbacks, with support below held at the key integer level of 4100.
Trading Strategy:
Buy 4120 - 4130
SL 4110
TP 4140 - 4150 - 4160
Sell 4160 - 4155
SL 4170
TP 4145 - 4035 - 4025

The bull market has returned. Am I bullish at this price level?#XAUUSD TVC:GOLD OANDA:XAUUSD
Gold prices performed strongly yesterday, closing with a large bullish candle on the daily chart and stabilizing above the daily MA5, officially signaling the return of bulls to the market.
Gold strengthened further today, and from a technical perspective, the bullish trend remains intact. Therefore, continuing to go long on gold is clearly safer. The bullish signal given last night regarding a pullback to the 4075 support level remains valid. However, with the passage of time and the continued strength of gold, a direct pullback to this level in the short term is somewhat difficult. But as a point of multiple pullbacks on smaller timeframes and near the daily MA20, the 4075 support remains reliable. Therefore, we can consider it a defensive level for the short-term bulls. As long as gold prices remain above this level, the bullish momentum will not change.
Currently, looking at the hourly chart, the 4125-4110 range is the support zone for the short term. If the price retraces to this level during the European session, it would be a good entry point, and we can continue to go long on gold within this range.

Is gold about to return to a bullish trend?On Monday, the US dollar index remained below the 100 level as signs that the US government might resume operations boosted market risk sentiment.
Spot gold rebounded sharply, surging over $100 intraday and returning above $4100, reaching a new high in over two weeks.
So far, gold has reached a high near $4150.
Looking at the hourly chart:
The two most crucial support levels for gold are currently around 4120-4115 and the $4000 level.
The 4120-4115 level coincides with the hourly moving average (MA20), and 4115 is also the opening price today. Therefore, if it holds above this level, gold is likely to maintain a consolidation and upward trend today.
Secondly, there's the $4000 level, which is the hourly MA30. It's possible that the price might break through the MA20 and directly reach the MA30.
Therefore, I think it's best to wait until at least 4120-4115 before considering long positions.
If the price breaks through the morning high of 4150, it may continue to reach the high near 4180.
