16/10/68 : XAUUSD ( Europe / London Session )Using it from Europe Session until 7.00PM , I'll new analysis and update at 8.00PM
Resistance
4255-4260
4245-4250
4240
Support
4229
4218-4224
4207-4213
Xauusdsetup

ElDoradoFx PREMIUM 2.0 – (16/10/2025, ASIA SESSION UPDATE)Gold closed the U.S. session around 4,208, consolidating below the psychological resistance at 4,218, where repeated rejections confirm a short-term supply zone. While the broader trend remains bullish, intraday charts show early exhaustion and divergence — suggesting Asia may start with a controlled pullback before the next impulse.
⸻
🔍 Technical Outlook
Daily (D1):
• Strong bullish continuation structure remains intact.
• RSI still in overbought territory (84), signaling potential pause or minor retracement.
• MACD positive but showing the first signs of flattening momentum.
1H (H1):
• Price remains within the ascending channel; multiple failed attempts to break 4,218 resistance.
• Immediate support around 4,197–4,192 (previous NY demand area).
• A clean break below 4,192 could open room toward 4,180–4,165.
• RSI (63) cooling down; MACD histogram decreasing, confirming loss of buying pressure.
15M–5M:
• Short-term CHoCH detected below 4,210; liquidity sweeps at the top suggest potential correction.
• 20EMA and 50EMA starting to converge — watch for momentum shift if 20EMA crosses below.
• MACD histogram fading with bearish crossover forming.
⸻
📊 Fibonacci Golden Zone (Latest Swing)
Swing Low → 4,165
Swing High → 4,218
🎯 Golden Zone = 4,176–4,184
This area aligns with 1H EMA confluence and the mid-channel structure — a potential “buy-the-dip” zone for continuation setups.
⸻
📌 High Probability Entry Zones
✅ Bullish Re-entry (Primary Setup)
Buy between 4,176–4,184 (Golden Zone)
🎯 Targets → 4,206 → 4,218 → 4,230
🛑 SL below 4,165
⚠️ Bearish Setup (Short-Term Correction)
Sell below 4,192 (Break & Retest confirmation)
🎯 Targets → 4,180 → 4,165 → 4,150
🛑 SL above 4,206
🚀 Breakout Buy (Aggressive)
Buy above 4,218 (Clean breakout)
🎯 Targets → 4,230 → 4,245 → 4,260
🛑 SL below 4,200
⸻
📅 Fundamental & Macro Outlook
🕐 Asia expected to open with reduced liquidity after CPI-driven volatility.
🕐 DXY stable around 105.25, keeping gold supported but capped near resistance.
🕐 Watch for Chinese market sentiment — stronger yuan could support temporary dips.
🕐 U.S. yields remain firm; this limits upside acceleration for gold short-term.
⸻
⚠️ Key Levels to Monitor
• Resistance: 4,206 / 4,218 / 4,230
• Support: 4,192 / 4,184 / 4,176 / 4,165
⸻
✅ Summary
Gold continues in a controlled bullish structure, but momentum is fading at the top.
Expect Asia session to test 4,184–4,176 (Golden Zone) before a potential rebound.
If price holds above 4,176, upside continuation toward 4,218–4,230 remains likely.
A confirmed close below 4,165 would shift the short-term bias to bearish correction.
--------
🥇 ElDoradoFx PREMIUM 2.0 – PERFORMANCE 15/10/2025 🥇
📊 GOLD TRADE RESULTS:
🔻 SELL LIMIT +40 pips
🟢 BUY (Swing) +420 pips (from 13/10)
🟢 BUY +60 pips
🔻 SELL –40 pips
🟢 BUY +60 pips
🟢 BUY +50 pips
🟢 BUY +320 pips
🔻 SELL +20 pips
🔻 SELL +110 pips
---
💰 TOTAL GOLD PIPS WON: +1,040 pips
📈 RESULT: 9 Signals → 8 Wins | 1 Loss
🎯 ACCURACY: 89 %
---
🔥 Consistent profits and flawless swing setups across GOLD!
👏 Congratulations if you profited ✅✅✅🚀🚀🚀

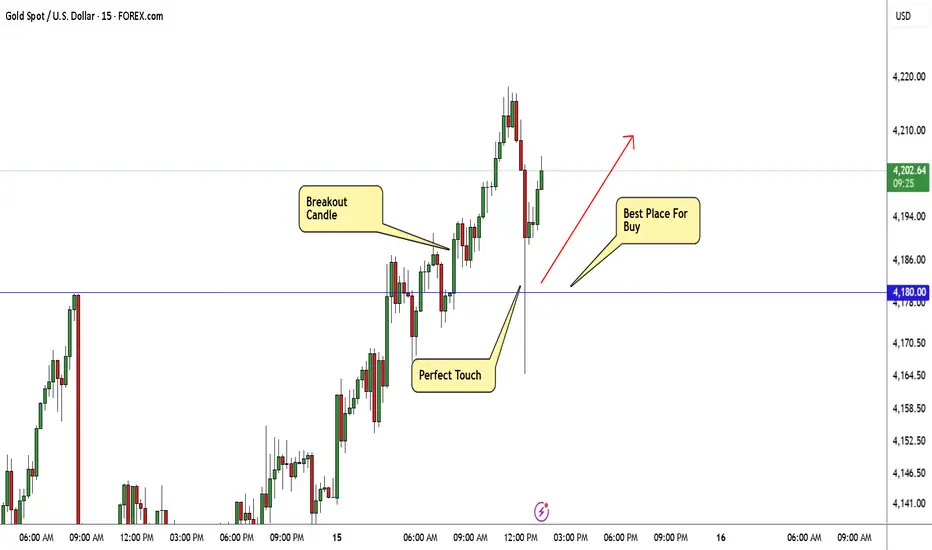
GOLD Breakout Done , Long Setup Valid To Get 300 Pips !Here is My 15 Min Gold Chart , and here is my opinion , the price going up very hard without any correction so we should move with it and we have a 4H Candle closure above our Res 4180.00 And Perfect Breakout and this give us a very good confirmation , so we have a good confirmation now to can buy after the price go back to retest the broken area 4180.00 One more time and we have already a great touch that take all stop losses before going up so i think the second touch will be better and will give us a good chance to enter with good stop loss , and we can be targeting 100 to 300 pips . if we have a daily closure below this area this mean this idea will not be valid anymore .
Reasons To Enter :
1- Perfect Touch For The Area .
2- Clear Bullish Price Action .
3- Bigger T.F Giving Good Bullish P.A .
4- The Price Take The Last High .
5- Perfect 4H Closure .
Gold Tarde Set Up Oct 15 2025Im still bullish on gold but i want to see a test of 15m supply to then see SSL/London lows swept followed by a 15m Bullish candle close to then target previous swing high and ATH

15/10/68 : XAUUSD ( US Session )Using it from US Session until 11.00AM , I'll new analysis and update at 12.00PM
Resistance
4220-4225
4210-4215
4204
Support
4192
4182-4187
4170-4176

ElDoradoFx PREMIUM 2.0 – (15/10/2025, US SESSION UPDATE)📅 U.S. Session – 15 Oct 2025
💹 Prepared by ElDoradoFx Premium 2.0 Team
⸻
🧭 Market Overview
Gold is currently trading near 4,198, after failing to sustain the breakout above 4,206–4,218. The price is showing temporary weakness as intraday structure shifts toward a corrective phase within the bullish channel.
A deeper retracement may develop before new buyers step in, especially ahead of U.S. CPI reaction and liquidity sweeps.
⸻
🔍 Technical Outlook
D1 (Macro Trend)
• The daily candle remains bullish, but nearing exhaustion at channel resistance (4,218).
• RSI ≈ 84 → deep in overbought territory.
• MACD still strong but showing divergence — hinting possible short-term correction.
➡️ Macro bias: Bullish but stretched; expect retracement before continuation.
⸻
H1 (Intraday Structure)
• The structure remains within the rising channel, but momentum is slowing.
• 20EMA and 50EMA are flattening — suggesting short-term equilibrium.
• Current support: 4,187–4,182 zone, resistance: 4,206–4,218.
• A confirmed break below 4,182 opens space for a deeper pullback to 4,165–4,150.
➡️ Bias: Neutral-bullish → correction likely before next impulse.
⸻
15M–5M (Execution Zone)
• A CHoCH (change of character) formed around 4,206, confirming short-term bearish pressure.
• MACD shows fading momentum, RSI near 50 (neutral).
• Lower timeframe liquidity likely to target 4,180–4,175 before reaccumulation.
⸻
📊 Fibonacci Golden Zone
• Swing Low → 4,165
• Swing High → 4,206
🎯 Golden Zone = 4,174 – 4,179
This aligns perfectly with 1H demand zone and 200EMA — high-probability area for bullish re-entry.
⸻
🎯 High Probability Trade Scenarios
✅ Bullish Re-entry (Main Setup)
• Entry: 4,174–4,179 (Golden Zone)
• Targets: 4,193 → 4,206 → 4,218
• Stop-loss: Below 4,165
📗 Ideal low-risk entry after corrective pullback.
⸻
⚠️ Bearish Short-Term Setup (Countertrend)
• Entry: On confirmed break and close below 4,165
• Targets: 4,150 → 4,139 → 4,122
• Stop-loss: Above 4,182
📕 Short-term sell only if the structure fully breaks.
⸻
📈 Breakout Buy Setup
• Entry: Break and close above 4,218
• Targets: 4,230 → 4,245 → 4,265
• Stop-loss: Below 4,200
📗 Strong continuation confirmation toward new highs.
⸻
📅 Fundamental Watch
🕐 Key Event: U.S. CPI release later today — high volatility expected.
🕐 DXY holding around 105.25, showing indecision.
🕐 Pre-news consolidation expected, with breakout likely post-data release.
⸻
⚠️ Key Levels to Monitor
• Resistance: 4,206 / 4,218 / 4,230
• Support: 4,182 / 4,174 / 4,165 / 4,150
• Breakout Zones:
🔼 Buy above 4,218
🔽 Sell below 4,165
⸻
✅ Summary
Gold remains bullish overall, but a short-term retracement is unfolding as price loses steam near 4,206–4,218 resistance.
Look for a dip into 4,174–4,179 (Golden Zone) for new buying opportunities,
or a confirmed break below 4,165 for intraday correction.
Patience and precision are key ahead of the U.S. CPI volatility window.
⸻
— ElDoradoFx PREMIUM 2.0 Team 🚀

GOLD Will Keep Growing!
HI,Traders !
#GOLD is trading in an
Uptrend and the price
Made a bullish breakout
Of the key horizontal
Level of 4143.76$ and the
Breakout is confirmed so
We are bullish biased
And we will be expecting
A further bullish continuation !
Comment and subscribe to help us grow !

Is Gold XAUUSD due for a Retrace? VWAP & Volume Profile Plan🏆 Gold (XAUUSD) Market Update 🏆
Gold (XAUUSD) has rallied strongly and is now pushing into new highs 📈. In my view, price looks overextended — when applying the VWAP indicator, we can clearly see that price has stretched three deviations away from VWAP ⚖️.
I’m also analyzing the Volume Profile to identify value areas that could serve as key support zones on any retracement 🔍. While my overall bias remains bullish, I’d like to see price return to equilibrium — roughly the 50% retrace of the recent price swing (on the 4-hour timeframe, measured from the order block low) 📊.
Additionally, I’m observing a potential Three-Drive Pattern forming, which could hint at a short-term correction before any continuation higher 🔄.
⚠️ Disclaimer: This content is for educational purposes only and not financial advice.

ElDoradoFx PREMIUM 2.0 – (15/10/2025, LONDON SESSION)📅 London Session – 15 Oct 2025
💹 Prepared by ElDoradoFx Premium 2.0 Team
⸻
🧭 Market Overview
Gold remains firm around 4,190, holding within a tight ascending channel after a strong recovery from 4,150.
The overall trend remains bullish, with price action building structure for a potential continuation breakout above 4,193.
However, RSI and MACD indicate slight exhaustion — suggesting a possible minor pullback before continuation.
⸻
🔍 Technical Outlook
D1 (Macro Trend)
• The daily candle continues the bullish sequence — higher highs and higher lows.
• RSI ≈ 83 → still overbought but stable.
• MACD remains strongly positive with momentum plateauing.
• Daily support sits around 4,147–4,100.
➡️ Bias: Strong bullish trend, minor correction possible before further rally.
⸻
H1 (Intraday Structure)
• Gold trades above both 20EMA and 50EMA, maintaining trend structure.
• Clear BOS confirmed at 4,165, now consolidating near 4,190–4,193 (previous high zone).
• RSI near 60, showing balanced momentum; MACD flat but above zero.
• Channel top resistance → 4,193–4,200, channel base → 4,165–4,170.
➡️ Bias: Bullish bias remains intact while above 4,165.
⸻
15M–5M (Execution Zone)
• Micro BOS after minor CHoCH at 4,183 indicates strength.
• 5M structure aligned for potential breakout above 4,193.
• If price rejects 4,193, a retracement toward 4,170–4,165 expected (Golden Zone).
⸻
📊 Fibonacci Golden Zone
• Swing Low → 4,165
• Swing High → 4,193
📈 Golden Zone = 4,171 – 4,175
Ideal re-entry zone aligning with 50EMA & intraday trendline support.
⸻
🎯 High Probability Trade Scenarios
✅ Bullish Continuation Setup
• Breakout Price: Above 4,193 (confirmed close).
• Entry: Retest of 4,190–4,193.
• Targets: 4,205 → 4,218 → 4,235
• Stop-loss: Below 4,175.
📗 Trend continuation with strong structural and EMA alignment.
⸻
⚙️ Golden Zone Re-entry (Buy on Dip)
• Entry: 4,171–4,175 (Golden Zone).
• Targets: 4,190 → 4,200 → 4,218
• Stop-loss: Below 4,160.
📗 Low-risk setup with EMA confluence and Fibonacci support.
⸻
⚠️ Short-Term Sell (Correction Setup)
• Breakout Price: Below 4,165 (confirmed).
• Entry: Retest 4,165–4,170.
• Targets: 4,150 → 4,139 → 4,122
• Stop-loss: Above 4,175.
📕 Counter-trend trade if structure breaks — only valid with clear confirmation.
⸻
📅 Fundamental Watch
🕐 CPI data due today — high impact event likely to trigger volatility.
🕐 DXY trades near 105.20, providing temporary resistance to gold’s upside.
🕐 Expect pre-news consolidation, followed by expansion during U.S. session.
⸻
⚠️ Key Technical Levels
• Resistance: 4,193 / 4,200 / 4,218
• Support: 4,175 / 4,165 / 4,150 / 4,139
• Breakout Zones:
🔼 Buy above 4,193
🔽 Sell below 4,165
⸻
🧩 Summary
Gold remains bullish, consolidating near the upper boundary of the ascending channel.
A break above 4,193 could extend gains toward 4,218–4,235,
while a drop below 4,165 opens a short-term retracement to 4,139–4,122.
Expect controlled volatility ahead of CPI — manage risk carefully.
⸻

Gold Is on Fire: Can XAU/USD Hit $4130 Gold’s price is really strong right now. As long as gold stays above $4000, it can move up to $4130. But if gold drops below $4000, it could slow down or even start to fall.
What do you think will happen next, do you think gold will keep going up or fall back down? Have you ever watched gold make a big move before?
If you want to know what to do or have any questions, just ask me! Sometimes a simple question can help you learn something new about trading gold. What do you want to know about gold today?
Mindbloome Exchange
Trade Smarter Live Better

GOLD Intraday Chart Update for 15 Oct 25GOOD Morning Traders,
As long as GOLD sustains above 4080 FMP Level it will remains bullish however the only way to join Trend Rally is following Psychological Levels with 3080 chain
Major Support zone for the day is located @ 4130-4150 below this zone GOLD will move Towards 4100 or even 4080
Above 4150 Psychological Level GOLD Next Target will be 4230 FMP Level or even 4250
Disclaimer: Forex is Risky

15/10/68 : XAUUSD ( Europe / London Session )Using it from Europe Session until 7.00PM , I'll new analysis and update at 8.00PM
Resistance
4200-4205
4190-4195
4185
Support
4175
4165-4170
4154-4160

Gold (XAU/USD) Bullish Channel Breakout & Retest Strategy 1H ANAChart Overview
Trend: Strong bullish trend within a rising channel.
Current Price: Around 4183.81 USD
Resistance Zone: 4185 – 4200
Support Zone: 4125 – 4150
Next Key Level / Target: 4235 USD
The price has been respecting the ascending channel very well — bouncing from support and rejecting resistance repeatedly.
---
📈 Bullish Scenario (Main Bias)
If price breaks and closes above the resistance zone (≈4200):
It confirms continuation of the uptrend.
Expect price to rally toward the next target at 4235–4250.
This breakout would show buyers’ dominance.
✅ Buy Strategy (Breakout Play):
1. Wait for a 1H candle close above 4200.
2. Enter a buy position near 4205–4210.
3. Stop-loss: Below 4170 (previous swing low).
4. Take-profit:
TP1 → 4235
TP2 → 4250
📉 Bearish Scenario (Pullback Play)
If price rejects from resistance zone (4200):
Expect a short-term pullback toward the support zone (4125–4150).
This will be a retest of the lower channel area before another bullish move.
✅ Buy Strategy (Retest Play):
1. Wait for price to fall back into the support zone (4125–4150).
2. Enter a buy once a bullish reversal candle (pin bar / engulfing) forms.
3. Stop-loss: Below 4100.
4. Take-profit:
TP1 → 4185
TP2 → 4235
⚠ Risk Management
Use 1–2% risk per trade.
Avoid entering if price stays between resistance & support (no-man’s-land).
Confirm breakouts with volume increase or strong candle bodies.
🧠 Summary
Bias Entry Stop Loss Take Profit Notes
Buy (Breakout) Above 4200 <4170 4235–4250 Strong continuation setup
Buy (Retest) 4125–4150 <4100 4185–4235 Safer entry after pullback

Gold Price Outlook – Trade Setup (XAU/USD)📊 Technical Structure
OANDA:XAUUSD Gold (XAU/USD) continues its bullish momentum, trading near $4,165 in the Asian session. The chart highlights a support zone at $4,157–$4,163 and a resistance zone at $4,216–$4,221. As long as price holds above support, bulls could attempt another push toward resistance. A breakout above $4,221 would signal continuation of the rally, while a break below $4,154 could trigger a pullback.
🎯 Trade Setup
Entry: $4,157–$4,163 (buy near support)
Stop Loss: $4,154
Take Profit 1: $4,184
Take Profit 2: $4,216
Take Profit 3: $4,221
Risk/Reward (R:R): ~1 : 6.82
🗝️ Key Technical Levels
Support Zone: $4,157–$4,163
Resistance Zone: $4,216–$4,221
Trend Bias: Bullish above $4,157
🌍 Macro Background
Gold (XAU/USD) extends its rally above $4,150, supported by renewed US–China trade tensions and growing expectations of Fed rate cuts. US Trade Representative Jamieson Greer warned that President Trump could impose 100% tariffs on China as early as November 1, escalating the trade war. Meanwhile, both countries announced additional port fees on ocean shipping, turning maritime logistics into another battleground.
On the monetary front, Fed Chair Powell reaffirmed that the Fed is on track to deliver another 25 bps rate cut in October, with markets pricing in an additional December cut. Lower rates continue to reduce the opportunity cost of holding gold. Traders will closely watch today’s Fed speakers, including Stephen Miran, Christopher Waller, and Jeff Schmid, for further guidance. Any hawkish surprise could lift the USD and weigh on gold temporarily, but the broader backdrop remains supportive for safe-haven demand.
📌 Trade Summary
Gold remains bullish above $4,157 support zone. Pullbacks into this zone may offer attractive buying opportunities, with upside targets at $4,184–$4,221. A break below $4,150 would invalidate the bullish setup and risk a correction.
⚠️ Disclaimer
This analysis is for reference only and does not constitute trading advice. Trading involves significant risk, and proper risk management is essential.

ElDoradoFx PREMIUM 2.0 – (15/10/2025, ASIA SESSION)
Gold remains steady around 4,143, consolidating after Monday’s correction from 4,179 → 4,097.
The broader trend is still bullish, but we are now in a tight accumulation phase below 4,155 resistance — typically a sign of an upcoming breakout.
⸻
🔍 Technical Outlook
D1 (Macro Trend)
• Structure: Higher highs, higher lows – uptrend intact.
• RSI ≈ 82 → overbought but stable.
• MACD: Still bullish but showing early loss of momentum.
• Support Zone: 4,086–4,063
➡️ Daily bias remains bullish above 4,085.
⸻
H1 (Intraday Structure)
• Price moving inside ascending channel.
• 20EMA & 50EMA provide confluence at 4,129–4,131.
• RSI 58 = neutral.
• MACD starting to recover after brief bearish phase.
➡️ Price building energy for a breakout.
⸻
15M–5M (Execution Zone)
• Micro BOS at 4,136 confirms short-term accumulation.
• Liquidity above 4,155–4,165, below 4,125–4,110.
• Compression visible on Heikin Ashi – volatility incoming.
⸻
📊 Fibonacci Golden Zone
🌀 Swing Low → 4,097
🌀 Swing High → 4,155
📈 Golden Zone = 4,125 – 4,136
Ideal buy zone aligned with EMA and structural retest.
⸻
🎯 High-Probability Trade Scenarios
✅ Bullish Breakout Setup
• Breakout Price → Above 4,155
• Entry → Retest 4,150–4,155
• Targets → 4,165 → 4,179 → 4,200
• SL → Below 4,136
📗 Continuation of major bullish trend.
⸻
🟡 Golden Zone Buy (Re-entry)
• Entry → 4,125–4,136
• Targets → 4,144 → 4,155 → 4,165
• SL → Below 4,110
📗 Best low-risk intraday buy opportunity.
⸻
⚠️ Bearish Breakout (Correction)
• Breakout Price → Below 4,110
• Entry → Retest 4,110–4,115
• Targets → 4,097 → 4,085 → 4,072
• SL → Above 4,125
📕 Short-term sell for liquidity sweep or pullback.
⸻
📅 Fundamental Watch
• No high-impact Asian data.
• U.S. CPI tomorrow – major volatility expected.
• DXY steady near 105.10, capping short-term gold upside.
⸻
🧩 Key Levels
Resistance: 4,155 / 4,165 / 4,179
Support: 4,136 / 4,125 / 4,110 / 4,097
Breakout Zones:
🔼 Buy above 4,155
🔽 Sell below 4,110
⸻
🧠 Summary
Gold is coiling under resistance – a breakout is imminent.
Watch 4,155 for bullish continuation or 4,110 for bearish extension.
Stay patient — next impulse move likely starts from the Golden Zone (4,125–4,136).
⸻
✍️ Follow for more institutional-grade XAUUSD breakdowns.
— ElDoradoFx PREMIUM 2.0 Team 🚀
⸻
🥇 ElDoradoFx PREMIUM 2.0 – PERFORMANCE 14/10/2025 🥇
📊 GOLD TRADES RECAP:
🟢 BUY (Swing) +950 pips (from 13/10)
🟢 BUY +50 pips
🟢 BUY +210 pips
🔻 SELL +20 pips
🔻 SELL LIMIT +160 pips
🟢 BUY +20 pips
🟥 BUY –40 pips (SL)
🟢 BUY LIMIT +40 pips
🔻 SELL +110 pips
🔻 SELL +60 pips
---
💰 TOTAL GOLD PIPS WON: +1,580 pips
📈 RESULT: 10 Signals → 9 Wins | 1 SL
🎯 ACCURACY: 90 %

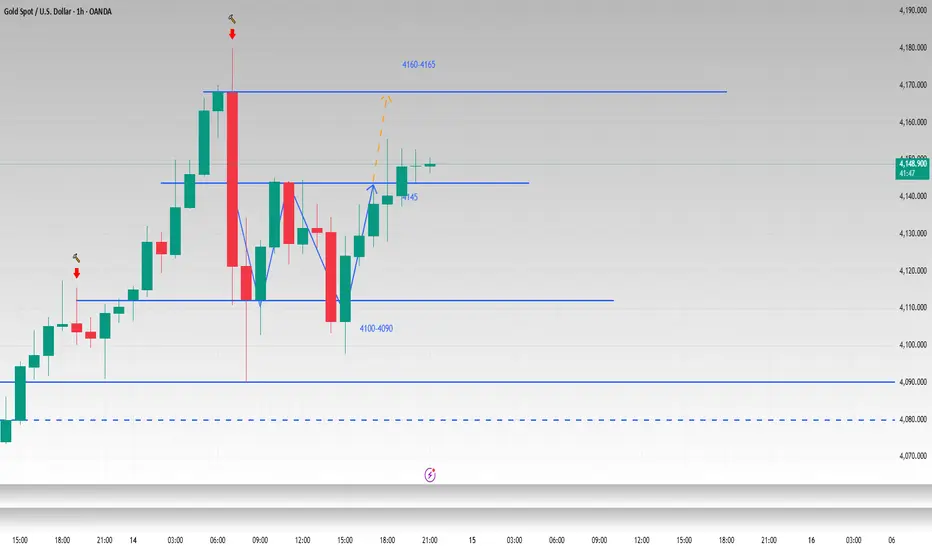
W pattern is established and the bullish pattern remain unchangeI have said before that gold is in a fluctuating upward state whether viewed from the weekly or daily charts, and there is no reversal signal. I mentioned in my previous post that from the hourly chart, gold has the prototype of a W shape, and the neckline is at 4145. In the evening of the US session, gold successfully broke through the neckline and touched around 4155. Although the bullish momentum of gold has stagnated slightly after a slow rise, I am still optimistic that gold will reach 4160-4165. If it falls back to around 4145-4135 again, we can still consider trying to go long on gold.
OANDA:XAUUSD
Gold Eyes New All-Time High
You said:
btcusd rinning 600+ pips in my direction . translate into german
ChatGPT said:
BTC/USD läuft mit über 600 Pips in meine Richtung.
You said:
translate it into spanish
ChatGPT said:
BTC/USD va con más de 600 pips a mi favor.
You said:
translate into russian
ChatGPT said:
BTC/USD движется в мою сторону более чем на 600 пунктов.
You said:
Ethusdt gone 350+bin my direction after touching fvg, nake ut professionals
ChatGPT said:
ETH/USDT moved 350+ pips in my direction after touching the FVG — a clean and professional move.
You said:
translate it into german
ChatGPT said:
ETH/USDT lief über 350 Pips in meine Richtung, nachdem es die FVG berührt hatte – eine saubere und professionelle Bewegung.
You said:
translate into russian
ChatGPT said:
ETH/USDT прошёл более 350 пунктов в мою сторону после касания зоны FVG — чёткое и профессиональное движение.
You said:
translate into spanish
ChatGPT said:
ETH/USDT se movió más de 350 pips a mi favor después de tocar la zona FVG — un movimiento limpio y profesional.
You said:
Uploaded image
analyze this chart describly and give suitable title
ChatGPT said:
🟡 Chart Analysis: Gold (XAU/USD) — Daily Timeframe
Overview:
This chart presents a bullish continuation setup for Gold (XAU/USD) on the daily timeframe. The market has recently shown strong upward momentum, forming several large bullish candles after a period of consolidation.
Key Observations:
Recent Momentum:
A strong bullish rally has pushed the price upward, indicating renewed buyer interest and institutional activity.
Retracement Zone:
The highlighted green area represents a potential retracement or re-entry zone. Price is expected to pull back into this area before resuming its upward trajectory.
Stop Loss Placement:
The red zone beneath the retracement area marks the stop-loss level around $4,026, strategically placed below recent swing lows for risk management.
Target Level:
The target zone is aligned with the All-Time High (ATH) around $4,200, which serves as a key psychological and technical resistance level.
Projection Path:
The chart’s white and black arrows illustrate an expected bullish impulse–retracement–continuation pattern, suggesting the price may briefly correct before surging to new highs.

XAUUSD(GOLD): +1000 Pips Possible Sell Setup! Comment Your ViewsDear Traders,
We may see sell dropping to 4000$ region or further down as we think price has reached the exhaustion point; it is likely that price drop rapidly and move up sharply. If you like the idea then comment and like.
Good luck
Team Setupsfx_

#XAUUSD: Price Is Likely To Hit $4200 Before Bearish CorrectionDear Traders,
Gold is likely to reach $4200 before experiencing a significant decline. We anticipate a final push potentially exceeding $4000. The current market sentiment is strong and is likely to drive the price to our target region. However, we require confirmation in a shorter timeframe and recommend employing appropriate risk management.
If you find our analysis valuable please engage with it. Follow us for further insights.
Sincerely,
Team Setupsfx

#XAUUSD: Targeting $4200, An 1800+ Pips Swing ViewDear traders,
Since we posted our previous idea on the gold price has reversed as we had anticipated. However, when we examine smaller time frames we gain greater clarity on the price’s progression. As of now, the price is trading at 4015 and may open with a positive gap on Monday. Our primary objective should be to allow the market to open on Monday. Once the price has settled, we can execute a more secure and well-managed RR trade.
Please do not consider this as a guarantee. Instead, use it as an educational perspective or bias. Conduct your own analysis and trade safely.
Team Setupsfx_

Gold Trade Set Up Oct 14 2025Gold made a LH in London session and is now approaching London lows as liquidity. For me to look for buys back to BSL levels i will want to see aa 15m candle close above London lows or the swing low at 4090, but if price closes under i will look for possible sells to a support

ElDoradoFx PREMIUM 2.0 – (14/10/2025, U.S. SESSION)Gold continues to consolidate after a strong intraday rebound from 4,090. The market is showing compression between 4,125–4,144, forming a temporary equilibrium structure after Friday’s impulsive rejection from 4,179. Volatility is expected to increase as liquidity builds ahead of U.S. CPI data tomorrow.
⸻
🧭 MARKET STRUCTURE OVERVIEW
• Trend Context: Macro bias remains bullish (D1 uptrend intact), but short-term distribution structure is visible below 4,144–4,150.
• Liquidity Zones:
• Buy-side liquidity resting above 4,150–4,165.
• Sell-side liquidity below 4,093–4,072.
• Market Cycle Stage: Reaccumulation or pre-breakout compression.
⸻
🔍 MULTI-TIMEFRAME TECHNICAL OUTLOOK
D1 – Macro Trend Context
• Price action: Successive bullish candles above 20EMA and 50EMA.
• RSI (81.9): Overbought but still supportive — structure points to controlled retracement before continuation.
• MACD: Bullish momentum moderating, suggesting potential pause before trend expansion.
• Key level: Daily resistance at 4,179.70 (weak high), immediate support 4,084–4,063.
H1 – Intraday Structure
• Clean Break of Structure (BOS) from 4,090 → 4,137, followed by consolidation.
• Minor lower high confirmed at 4,144, forming temporary range.
• RSI at 57 — neutral, showing balanced order flow.
• MACD histogram contracting, indicating loss of bullish momentum.
• Current structure favors a pullback toward the Golden Zone before next directional move.
15M–5M – Short-Term Precision View
• Clear CHoCH observed below 4,132.
• EMA cluster flattening (20EMA ≈ 4,130, 50EMA ≈ 4,125).
• Short-term buyers defending 4,125–4,120, but volume divergence showing early exhaustion.
• A break below 4,125 would confirm liquidity sweep and open the door for 4,093–4,072 retracement.
⸻
📊 FIBONACCI GOLDEN ZONE ALIGNMENT
• Swing High: 4,179
• Swing Low: 4,090
➡️ Golden Zone = 4,124 – 4,136
This zone coincides with the 1H resistance confluence, trendline touchpoint, and intraday imbalance fill. It serves as the key decision zone for U.S. session traders.
⸻
🎯 HIGH PROBABILITY TRADE SETUPS
1️⃣ Bullish Continuation Scenario
• Confirmation: Break & retest above 4,144.
• Entry: Buy on retest of 4,144–4,147 zone.
• Targets: 4,165 → 4,179 → 4,200
• Stop-loss: Below 4,125 (structure invalidation).
• Rationale: Reclaiming prior supply + momentum expansion expected if DXY weakens.
2️⃣ Bearish Corrective Scenario
• Confirmation: Rejection from 4,136–4,144 (Golden Zone).
• Entry: Sell from 4,136–4,140 range with candle confirmation.
• Targets: 4,110 → 4,093 → 4,072
• Stop-loss: Above 4,150.
• Rationale: RSI divergence + MACD histogram contraction + liquidity sweep above previous highs.
⸻
📅 FUNDAMENTAL CATALYSTS
• 🕐 No major U.S. economic data today, but traders are positioning ahead of tomorrow’s CPI report, which will define midweek volatility.
• 🕐 DXY remains stable near 104.90, keeping gold capped intraday.
• 🕐 Treasury yields flat; risk sentiment mixed — aligning with gold’s consolidation.
⸻
⚠️ KEY TECHNICAL LEVELS
• Major Resistance: 4,144 / 4,165 / 4,179
• Intraday Support: 4,125 / 4,110 / 4,093 / 4,072
• Extreme Levels: 4,050 support pivot / 4,200 macro extension.
⸻
🧩 SENTIMENT & SUMMARY
Gold is currently in a compression phase between intraday supply (4,136–4,144) and demand (4,110–4,125).
Expect low volatility until a clear break of structure occurs.
📈 Above 4,144 → momentum resumes toward 4,165–4,179.
📉 Below 4,110 → corrective wave extends into 4,093–4,072 before potential bounce.
The safest approach for institutional-style execution is to wait for confirmation at the boundaries of the Golden Zone rather than pre-positioning.

Gold (XAU/USD) Bearish Pullback from Resistance Zonea potential bearish setup forming after a strong bullish rally. The price recently surged upward, reaching a key resistance zone (highlighted in light blue). This zone aligns with previous structural highs, making it a likely area for sellers to step in.
After testing this resistance, the chart indicates a pullback or retracement setup — the black curved arrow suggests an expected downward move. The Stop Loss is placed just above the resistance zone around $4,167, protecting against a breakout continuation. The Target is marked near $4,121, where prior support and a minor demand level coincide.
This setup represents a short-term bearish retracement within a potentially larger bullish context, aiming to capitalize on short-term rejection from resistance before any continuation move.
