Gold Near Breakout – Watch $3,369 and $3,330Gold remains in a downtrend, forming a Bear Flag pattern within a broader descending channel. Price is capped below key resistance at $3,360–3,369 and is hovering near $3,340. A breakdown below $3,330 could accelerate losses toward $3,300 and $3,280, while a short-term bullish break above $3,369 may trigger a retracement toward $3,380 before sellers likely re-enter. Overall bias stays bearish unless price closes firmly above the upper resistance zone.
🔑 Key Levels to Watch
- Resistance: $3,360 → $3,369 → $3,380
- Support: $3,330 → $3,300 → $3,280
- Breakout Zones: Below $3,330 → Targets $3,300 and $3,280. Above $3,369 → Target $3,380
Note
Please risk management in trading is a Key so use your money accordingly. If you like the idea then please like and boost. Thank you and Good Luck!
Xauusdshort

XAUUSD SHORT TRADE IDEA Price rejected the 8hr order block yesterday and trapped back into the prior range taking out a STH.
Anticipating a bearish continuation from here as the bearish cycle is still very valid towards the low the range.
There is a chance price could tap into the imbalance below and then run for the Daily BST before dropping again.

Gold (XAU/USD) Short-Term Bearish Setup1. Well-Defined Resistance Zones
Two horizontal shaded areas labeled Resistance R1 and Resistance R2 mark zones near $3,360–$3,380, where price repeatedly failed to break higher.
Trading ideas from analysts on TradingView reinforce that the immediate resistance lies around $3,364–$3,370. As long as price stays below that, sellers remain in control
2. Descending Channel & Bearish Momentum
The chart highlights a shift from an earlier ascending channel (green), followed by breakdown and decline — a classic reversal from bullish to bearish.
In line with this, there’s also mention of a bearish flag pattern forming on the 30-minute (M30) timeframe, offering a potential shorting opportunity
3. Key Support Levels & Targets
Multiple support levels annotated: Support S2 (at two levels) and Support S3, with notable levels around $3,315, $3,301–$3,302, and $3,300.
The annotated price action indicates projected declines toward those levels—especially highlighting $3,314.94, $3,301.55, and $3,300.96 as intermediate and key targets.
Ultimately, the red “High support area” below suggests a broader demand zone, perhaps around $3,280–$3,300, where stronger support may emerge.
4. Trading Plan Illustrated
White arrows depict a descending trajectory: from current levels down to each support, suggesting a sell-on-rally approach.
Blue markers denote possible bounce points for pullbacks before continuation lower.
Broader Market Context
Gold prices have recently been tracking in the $3,330–$3,350 range, facing resistance near $3,350–$3,360 and support near $3,300. Analysts caution that a break below that could push it toward $3,245 or $3,150–$3,120
Overall momentum has turned cautious or bearish—bearish engulfing patterns, weakening rally strength, and below-average technical indicators emphasize the risk of further declines
Weak U.S. economic indicators or dovish signals from Fed officials (like Powell) could offer brief relief rallies; but failure to reclaim resistance may extend the slide
Key Levels at a Glance
Level Type Price Range Notes
Resistance ~$3,350–$3,360+ Strong ceiling—decline confirms bearish bias
Support S1 ~$3,315–$3,320 First potential reaction zone
Support S2 ~$3,301 Intermediate target for sellers
Support S3 ~$3,300 Psychological barrier; near high support zone
High Support Area ~$3,280–$3,300 Zone where bullish buyers might regroup
Conclusion
chart effectively captures a short-term bearish trend in gold (XAU/USD), showing:
Failed attempts to overcome resistance near $3,360.
A bearish flag breakout signaling potential continuation downward.
Clearly plotted support targets, with bounce zones drawn out.
A visual trade plan suggesting sell-on-rallies targeting declining support levels until reaching a strong demand zone.
To succeed with this setup, traders might wait for a brief rally into one of the identified sell zones (e.g. ~$3,314 or $3,325) before entering shorts, with stop-loss placements above the resistance areas and profit objectives aligned with support levels ($3,301 or near $3,300).

XAUUSD: Trade Gold in 15minHello friends, I opened such a trade on gold in 15 minutes and I expect such a trend for it. Be profitable and successful.

GOLD Bullish Breakout!
HI,Traders !
#GOLD made a bullish
Breakout of the falling resistance
And the breakout is confirmed
So we are bullish biased
And we will be expecting
A further bullish move up !
Comment and subscribe to help us grow !

How to correctly grasp the gold trading opportunities?Gold has been fluctuating recently, and the continuity is not strong. Don't chase long easily for the time being. Since it is a volatile market, then now it has rebounded to a high level, you should continue to short. Continue to short gold below 3350 in the US trading session. Gold bottomed out and rebounded in one hour. Although it seems that there has been a strong pullback, it is not certain that gold has reversed for the time being, but it is still within the range of large range fluctuations. Gold has not effectively broken through 3350 and stabilized, so it is still fluctuating in a large range. Continue to short gold in the US trading session. The market is changing rapidly, but gold has not formed a unilateral trend, so don't chase long easily. If gold falls back again and does not break the low point, then gold will continue to fluctuate.

XAUUSD:BUYAfter this rebound to 3330, the market may continue to fluctuate until the New York market opens. Because 3330 serves as support during declines, it will become a resistance level during rallies. If this level stabilizes, you can continue to buy to 3345. Stay tuned for further details.

Gold/Bitcoin → Latest Trading StrategiesGold prices, Bitcoin, and foreign exchange all fell to varying degrees yesterday. Our sell orders all saw profits, which is cause for celebration.
With the Federal Reserve's interest rate decision imminent, the Swing Trading Center's trading outlook is to position long positions in advance, anticipating a significant rise after the decision. Gold prices are currently at a new low this month, hitting 3311, and are currently quoted at 3322. A tentative target for a short-term rebound could be around 3345. Buy below this level for preemptive trading.
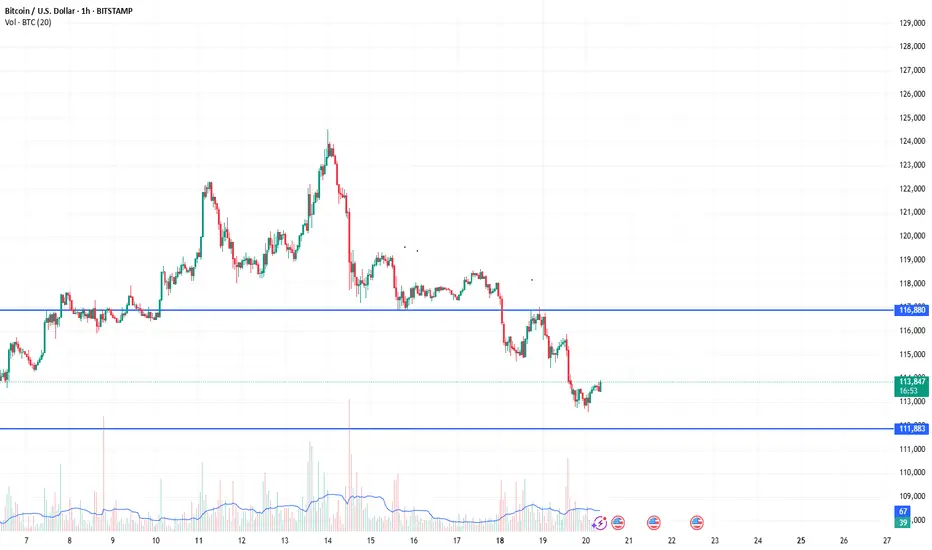
BTCUSD also experienced a significant decline during the US dollar's rise. This may be related to Trump. This is a game between safe-haven assets. Before the US dollar experienced a significant decline, gold and Bitcoin would have to take a back seat, as the US dollar remains the primary safe-haven asset.
The downward trend in gold and BTCUSD requires significant news to revive and break the trend. Therefore, short-term traders can place buy orders in advance and wait for the market to rise.
XAUUSD: Possible Bearish Point Of ViewGold in 4 Hours Time Frame has not moved significantly, currently we have not got ample volume to decide a clear trend. However, with the data that we have we can predict a possible ab=cd pattern where A to B is completed and we are yet to see c to d pattern.
If you like our work then please consider liking and commenting below.
Team Setupsfx

Gold: Correction & Retest of Broken Level1. Fundamental Outlook
Gold is trading close to $3,300, its lowest level in the past three weeks, as market participants remain cautious ahead of key U.S. monetary policy signals. The current weakness is not only tied to technical flows but also to expectations regarding the Federal Reserve’s policy stance. Despite signs of a slowing labor market and softer inflation figures, investors believe that the Fed may resist adopting an overly aggressive easing cycle.
The upcoming release of the Fed minutes and, more importantly, Jerome Powell’s speech at the Jackson Hole Symposium, will likely determine the next big move for gold. Until then, sentiment remains defensive, and investors are reluctant to commit to large positions.
2. Dollar Dynamics
The U.S. dollar has been strengthening, exerting downward pressure on gold. Several factors are contributing to this:
Policy Expectations: Markets still assign around an 85% probability of a September rate cut, but traders expect Powell to signal caution and avoid endorsing steep or rapid cuts.
Housing Market Resilience: Strong housing data has reinforced confidence in the U.S. economy, giving further support to the dollar.
Geopolitical Headlines: News of potential Ukraine negotiations added a layer of optimism for risk sentiment, while also supporting the dollar as investors adjust safe-haven allocations.
As long as the dollar maintains this upward momentum, gold is likely to face headwinds, with upside moves limited to corrective rallies.
3. Technical Setup
From a technical standpoint, gold is in the process of a correction following a bearish rally. This corrective phase is characterized by short-term rebounds toward local resistance zones, but without a confirmed breakout, the overall bias remains negative.
Resistance Levels: 3328, 3331, 3345
Support Levels: 3314, 3300, 3270
The correction could bring gold to test the 3328–3345 resistance zone. However, if the price fails to sustain above these levels, the risk of renewed selling pressure increases. A confirmed breakdown below 3300 would expose the 3270 area, which serves as the next major downside target.
In short, unless gold can establish firm support above 3345, the path of least resistance remains lower.
4. Key Events to Watch
The most critical driver for gold in the near term is Jerome Powell’s speech at Jackson Hole on Friday. Investors will focus on whether Powell signals a cautious approach—supporting the dollar—or hints at policy flexibility, which could provide temporary relief for gold.
Additionally, the Fed minutes release will be analyzed for any details on how policymakers view the balance between inflation risks and economic weakness. Beyond monetary policy, continued monitoring of U.S. economic data releases and geopolitical developments (particularly around Ukraine) will remain essential for short-term positioning in gold.
✅ Conclusion:
Gold remains under pressure, weighed down by a stronger dollar and uncertainty around Fed policy. While technical corrections may push prices higher in the short term, the broader outlook remains cautious. The 3300 level is pivotal—holding above it could allow for a corrective bounce, while a break below may accelerate declines toward 3270. The decisive trigger, however, will come from Powell’s comments at Jackson Hole, which are likely to set the tone for gold’s direction into September.
Gold fluctuates and waits for news,rebound continues to be shortThe current gold daily line shows that the big negative line is weak, but we need to pay attention to the effectiveness of the 3310-3300 first-line support. As long as the price remains above this range, bulls still have a chance to gain momentum for a rebound. Conversely, a break below the 3300 mark could trigger a shift in bullish sentiment, potentially even leading to a test of the previous low of 3280.
The market momentum was relatively weak at the start of this week, with significant resistance at the highs near 3330-3340. Only by breaking through this short-term resistance range can bulls achieve temporary stability. In the short-term trend, the support zone around 3300 needs special attention. At the 4-hour level, the gold price has begun to fall below the previous terraced support band. We need to pay attention to whether there will be a slight rebound and then a downward trend.
Overall, gold is in a wide range of fluctuations in the short term. The current short position is relatively strong. Today's operation is mainly based on rebound shorting. If it touches 3330-3340 for the first time in the European and American markets, you can consider shorting, and the target is 3310-3300.

8/19: Watch Support at 3328-3323 and Look for Buying OpportunitiGood evening, everyone!
Gold remains range-bound between 3323–3348. On the 30M chart, the key resistance is clustered at 3337–3343, while support stays at 3328–3323.
On the 2H chart, the structure remains suppressed, but the bullish divergence on indicators hasn’t been fully corrected yet. Two possible scenarios may unfold:
1️⃣ Price breaks below 3323 first, triggering a stronger rebound;
2️⃣ Support holds, leading to an immediate push higher toward the 3348–3352–3358 resistance zone.
Either way, the medium-term bias favors the upside.
Trading strategy: prioritize buying on dips, selling on highs as secondary.
⚠️ Note: If your account is under pressure, it’s safer to wait for clearer signals rather than rushing in. For detailed guidance, feel free to reach out.

XAUUSD:Continue shorting at high levels to profit.Gold prices did not significantly break through their upper limits yesterday. The London market began its downward trend. New York markets extended their decline after opening, hitting a low of 3326. The meeting is almost over, but there has been no progress. The market has digested the expected gold price trend and is currently rebounding. However, if further news is released, gold prices may fall further. Consider selling between 3345 and 3340.

The dividing line 3330-3340 is not broken and rebounds to short#XAUUSD
After repeated fluctuations in the white session last night, gold fell below 3320 in the NY session and closed with weak fluctuations. 📊This morning, gold hit a low near 3311,📉 which aligns with our short-term outlook.✅
Judging from the monthly chart, the decline of gold in recent weeks has not been smooth, and each time it has been accompanied by a relatively strong rebound. 📈Today, there is a rebound near the 3311 line below. This point deserves our attention.👀 Previously, NFP achieved a big rise after breaking through here.🚀 At the same time, this point is also the area of the daily 100-day moving average.🐂
The first time it hits this point, it is bound to usher in a bullish resistance, and this is indeed the case.⚖️ Once it falls below this point, the next step will be the 3300 integer mark, 🥅and it may even hit the previous low, which is also the lower track of the daily line around 3280.↘️
Although the current market is relatively strong in short-term selling, we should not be overly bearish in the short term.↘️ After all, the impact of the news has not completely dissipated. The Federal Reserve will also release the meeting minutes in the evening NY session, 📰so we still need to be vigilant that the bulls may counterattack at any time.📈
In the short term, pay attention to the upper 3330-3340 bull-bear dividing line. If you encounter resistance and pressure in this range, you can consider shorting in batches with light positions, looking towards 3315-3300, and defending 3345. If the rebound effectively breaks through 3345, gold may fluctuate again.📊
🚀 SELL 3330-3340
🚀 TP 3315-3300

Selling pressure continues to return to 3300Plan XAU day: August 20, 2025
Related Information:!!!
Gold (XAU/USD) slid to its lowest level in nearly three weeks during the Asian session on Wednesday, with bearish sentiment prevailing as market participants await a decisive break below the 100-day Simple Moving Average (SMA) to confirm prospects for further downside. The US Dollar (USD) extended its steady ascent for a third consecutive session, supported by fading expectations of more aggressive monetary easing by the Federal Reserve (Fed), which remains a primary headwind for the non-yielding precious metal.
In addition, renewed optimism over a potential Russia–Ukraine peace agreement has added to the downward pressure on safe-haven gold. Looking ahead, investors will turn their attention to the release of the FOMC meeting minutes, while Fed Chair Jerome Powell’s upcoming remarks at the Jackson Hole Symposium may provide further clarity on the central bank’s policy trajectory. These developments are poised to play a pivotal role in shaping near-term USD demand and guiding the next directional move for the commodity
personal opinion:!!!
Gold price recovered to break through 3327 to gain liquidity and continue the downtrend
Important price zone to consider : !!!
Resistance zone point: 3330 zone
Sustainable trading to beat the market

At the critical moment of gold, can 3320 support the bulls?Based on the current gold hourly trend analysis, the cyclical pattern of a sharp drop followed by a rebound continued in the morning. The 3325-3315 support effectively triggered a pull-up. After touching 3342, the gold price entered a narrow range of fluctuations. The European session broke through the resistance of yesterday's downward trend line and attacked to 3345. After the US session, the correction line should be alert to the risk of inducing a short position, and beware of a repeat of yesterday's high and fall to wash the market. The key is to watch the 10-day moving average position of 3340: if it is effectively lost, it may fall to the 3320 support area and rebound again; if it stabilizes the moving average and breaks through 3345, it is in line with the logic of continued rise in the Asian and European sessions, and is expected to rise again. The current narrow range of fluctuations is obvious, and it is recommended to still focus on buying on pullbacks.
Gold Trading Recommendation: Go long around 3325-3320, with a target of 3335-3345.

XAUUSD Technical Analysis – August 20Overall Trend:
After a sharp decline, gold has formed a descending channel and recently bounced from the key support zone at 3311 – 3318.
Price is currently testing the 3322 – 3325 area, which aligns with short-term EMAs (20–50). This zone will determine whether the recovery can extend further.
Key Resistance Levels
3344 – 3346: Fibonacci 0.5 retracement and EMA 100, acting as the first resistance to watch.
3359 – 3360: Strong resistance on H1. A breakout above this level could open the way towards 3380.
Key Support Levels
3318 – 3311: Strong demand zone (recent swing low + Fibonacci 0.786).
If broken, gold may quickly drop toward 3300 – 3295.
Momentum Indicators
RSI on H1 is rebounding from oversold territory, signaling a potential corrective move.
However, the broader bias remains bearish as price is still trading below EMA 200.
Trading Strategy
Long Setup (counter-trend bounce)
Entry: 3320 – 3325
TP1: 3344 – 3346
TP2: 3359 – 3360
SL: below 3310
Short Setup (trend-following)
Wait for rejection signals at 3344 – 3346 or 3359 – 3360
Entry: 3345 – 3358
TP1: 3322 – 3325
TP2: 3311
SL: above 3365
Conclusion
Gold is showing a technical rebound within a broader downtrend.
For intraday trading, it’s best to stay flexible: look for buy opportunities above 3318, and watch for sell setups at strong resistance zones 3344 – 3360.
Risk management remains crucial as volatility on H1 is still high.
- Save these key levels and follow for more strategies in upcoming sessions.

Gold XAUUSD Intraday Setup 20.08.2025Gold trading in bearish channel with price at 3324 after support at 3312.
Resistance zones: 3329-3331, 3340-3343.
Low volatility indicates consolidation.
Potential for a retest of 3312 if bearish momentum resumes.
Watch for a break above 3341 as it could signal a trend reversal.
Trading Idea:1
Entry: 3329-3331
Stop Loss: 3338
Take Profit: 3312
Condition: Bearish candlestick at resistance.
Trading Idea:2
Entry: 3341-3343
Stop Loss: 3350
Take Profit: 3325
Condition: Bearish candlestick at resistance.
Notes.
Confirm with volume increase on sell-off. Watch for false breakouts above 3340-3341.

Gold Price Analysis August 19📊 XAUUSD – Waiting for trend confirmation
Gold has retreated to the 0.382 Fibonacci zone after reacting at the trendline, however, the buying pressure is still enough to bring H4 back above 3331. Currently, the market is fluctuating in a narrow range (sideway) and needs more momentum to confirm the next direction.
The Fibonacci levels continue to play a guiding role: breaking one level will open the opportunity to move to the next level. Important condition: if H4 closes below 3331, the possibility of a bearish reversal to 3285 will be triggered.
🔑 Sample Trading Plan
BUY: When price breaks trendline & Fibonacci at 3345
BUY DCA: When price breaks 3358 with confirmation candle
🎯 Target: 3400
SELL: When H4 closes candle below 3331
🎯 Target: 3285

Gold Price Analysis August 20Gold reacted correctly to yesterday's scenario when selling pressure dominated and the price touched the important support zone of 3312 - completing the first target. With the current decline, the possibility of returning to 3285 soon is very high. However, investors need to pay attention to the risk of volatility from the FOMC's statements.
In the short term, prioritize the SELL strategy following the downtrend. BUY orders should only be considered when there is a clear confirmation signal from the buyers at the 3385 area.
Trading plan:
SELL: when the price retests the resistance of 3330 and is rejected.
SELL DCA: if the price breaks the support zone of 3312.

XAUUSD Intraday Analysis (H1) – August 20, 2025On the H1 chart, Gold continues its bearish momentum after breaking below the 3322 – 3325 support zone. Selling pressure remains strong with high volume, confirming that bears are still in control.
1. Main Trend
EMA 50 – 100 – 200: Price trades below all major EMAs, confirming a short-term to mid-term downtrend.
Downtrend line: Intact and respected, no breakout signals yet.
Volume: Increasing on bearish candles, showing strong selling momentum.
2. Key Resistance Levels
3345 – 3350: Confluence zone of EMA200 + recent swing high, acting as a major resistance.
3338 – 3340: Minor supply area aligned with EMA100.
=> These zones are ideal for trend-following short entries if price retraces higher.
3. Key Support Levels
3310 – 3315: Immediate support, currently being tested.
3295 – 3300: Strong psychological level, may trigger a bullish reaction.
If broken, downside could extend towards 3275 – 3280.
4. Trading Strategies
Primary Strategy (Sell the rally): Short near 3338 – 3345, stop loss above 3355, targets at 3310 – 3300, extended target 3280.
Breakout Strategy: If 3310 is broken with strong volume, sell breakout aiming for 3295 – 3280.
Counter-trend Buy: Only consider long around 3295 – 3300 if bullish reversal patterns appear + RSI confirms oversold (<30).
5. Technical Indicators
RSI (H1): Approaching oversold territory, suggesting possible short-term pullback.
Fibonacci: 3340 – 3345 aligns with 38.2% retracement of the latest bearish leg, strengthening resistance.
- Conclusion: Gold remains in a bearish structure. Priority should be selling from resistance zones, while carefully watching price action around 3310 and 3295 for potential reactions.
- Follow for more high-probability trading strategies, and save this analysis if you find it useful.

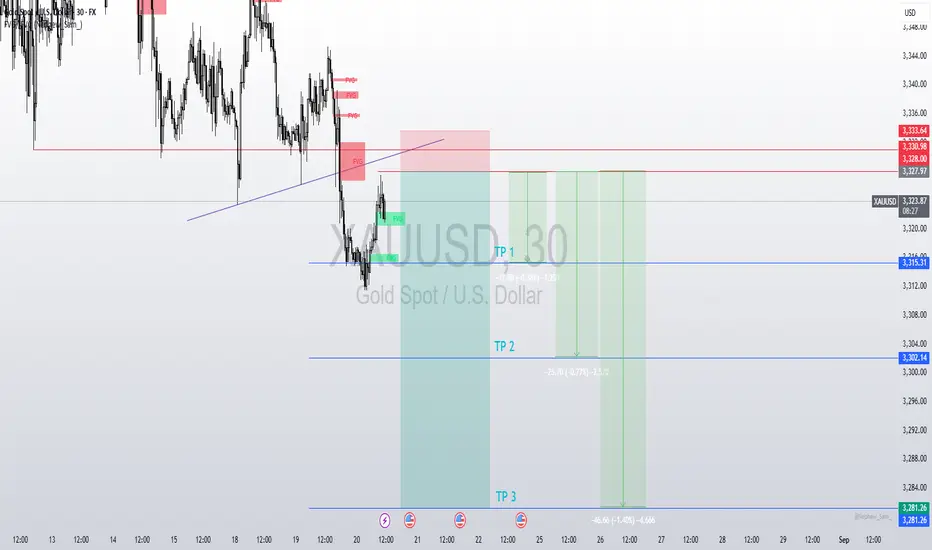
XAU/USD - Bearish Flag Pattern (16.08.2025)The XAU/USD Pair on the M30 timeframe presents a Potential Selling Opportunity due to a recent Formation of a Bearish Flag Pattern. This suggests a shift in momentum towards the downside in the coming hours.
Possible Short Trade:
Entry: Consider Entering A Short Position around Trendline Of The Pattern.
Target Levels:
1st Support – 3318
2nd Support – 3308
🎁 Please hit the like button and
🎁 Leave a comment to support for My Post !
Your likes and comments are incredibly motivating and will encourage me to share more analysis with you.
Best Regards, KABHI_TA_TRADING
Thank you.
Disclosure: I am part of Trade Nation's Influencer program and receive a monthly fee for using their TradingView charts in my analysis.

XAUUSD 15m – EW Short SetupHi fellow traders,
On the 15m XAUUSD chart, I am applying Elliott Wave principles to identify a short opportunity. The current structure suggests a continuation to the downside after the corrective move.
An additional confluence here is the red-shaded supply zone, which aligns with my projected entry area and strengthens the setup.
I am entering at 3347.26, with a Stop Loss at 3351.87 and a Take Profit at 3322.53, targeting the next support level.
Good luck and trade safe.
