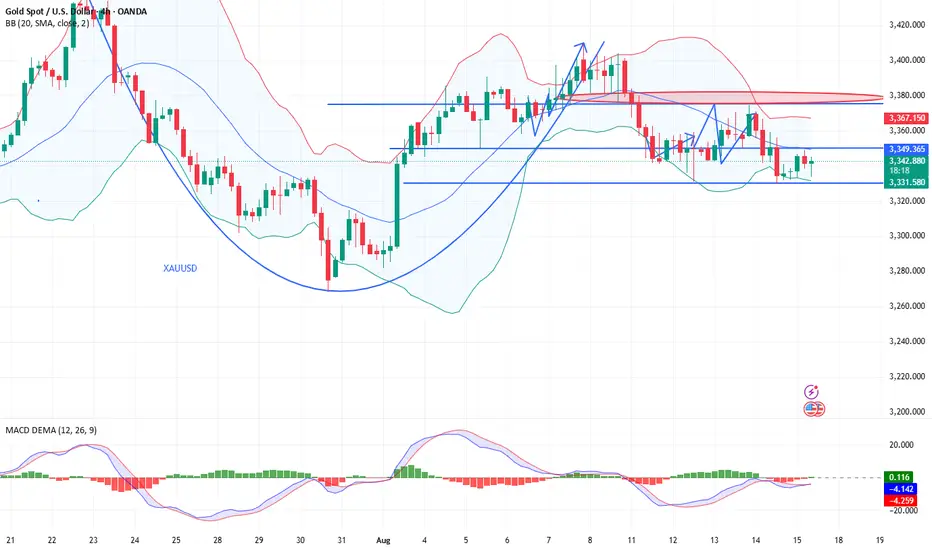
Latest price increase and decrease forecastFrom a technical perspective, Thursday's daily chart showed a sharp decline, engulfing Tuesday's. Wednesday's consecutive rises marked the closing price near the middle Bollinger band. There's no definitive direction for now, and both ups and downs are possible. Therefore, the daily chart's performance is not important, but the H4 chart shows significant momentum. Currently, 3330 is a double bottom, with the closing price just above the lower Bollinger band. If a rebound occurs here, especially with strength in the afternoon, the Bollinger band will tighten and the moving averages will converge, confirming a volatile market today. If the market stabilizes above the middle Bollinger band at 3350, it can be confirmed that today is a rebound. The US market could also reach a high of 3365. Therefore, the rebound strength can be observed around the 3330 support level during the Asian and European sessions. If it breaks through 3330, gold could continue its decline to the 3310-3300 range.
Trading suggestions: If the market rebounds first, short near 3346, with a stop-loss above 3352. If the market weakens, short near 3341, with a stop-loss above 3347. If the market declines first, short below 3300, or go long near 3320, with a stop-loss below 3315. If you currently have short positions at low levels and long positions at high levels and are unsure how to proceed, please leave a message for Charlie. FX:XAUUSD ACTIVTRADES:GOLD ICMARKETS:XAUUSD FOREXCOM:GOLD VANTAGE:XAUUSD FOREXCOM:GOLD VANTAGE:XAUUSD
Xauusdshort
The impact of the meeting on gold prices.Trump: Speaks with Lukashenko. We discussed prisoner releases and a meeting with Putin. The meeting details are as follows:
Trump: "Had a great meeting with Belarusian President Lukashenko. The purpose of the call was to thank him for releasing 16 prisoners. We are also discussing the release of an additional 1,300 prisoners. We had a very pleasant conversation. We discussed many topics, including President Putin's visit to Alaska. I look forward to meeting with President Lukashenko in the future."
The meeting did not clearly indicate any positive or negative impact on the market. However, Jess believes that gold prices will continue to fall in the short term, so it is advisable to sell gold at a high level to profit.

Grasp the market rhythm Steadily improve trading success rateThe previous strategy suggested shorting gold near 3345-3360, and the rebound materialized as expected. This position was under pressure many times during the day, and there were good returns. The bottom also gave a short position near 3345, which fell as expected and smoothly fell to 3335-3334 to take profit and exit. Today, we have repeatedly emphasized that shorting on rebounds should be the main approach. Congratulations to those who followed.
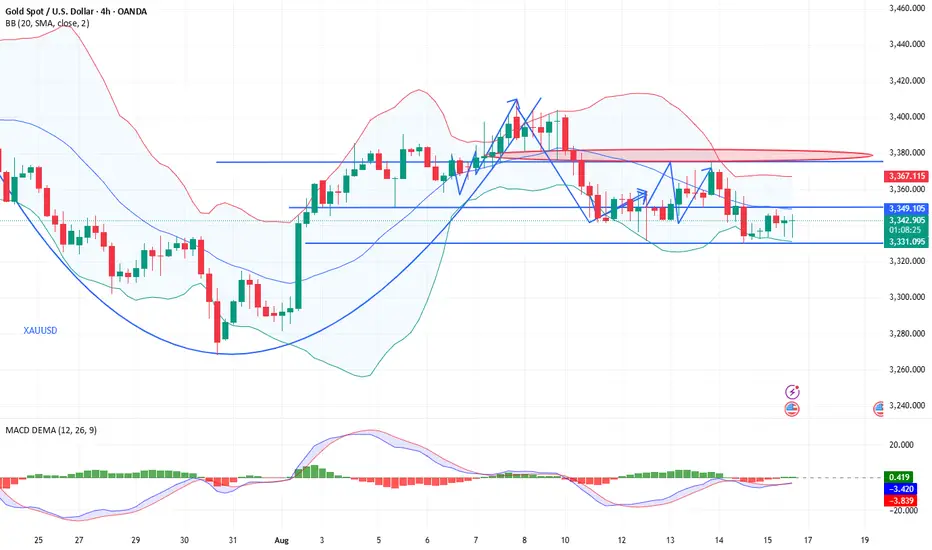
Judging from the current gold trend, gold has fallen in a circuitous and oscillating manner in the 4H cycle. After consecutive negative closings, the Bollinger Bands opened. Relying on the middle track, we can see further room for decline. It is expected to increase in volume after short-term consolidation. Pressure will focus on the 3345-3360 area. The operation will mainly focus on rebound shorting. First look at the area around 3332. If it breaks through, look at 3320 and 3300. I will prompt you with the specific operation strategy at the bottom, so please pay attention to it in time.
Gold operation suggestion: short around 3345-3360, target 3330-3320.

Gold fluctuates, waiting for an effective breakthroughThe MACD is below the zero axis and has already diverged from the bottom, indicating it's poised for a short-term rebound. Each short-term rebound followed a similar pattern to the current MACD. It simply diverges once, twice, or even three times before a sudden surge. Therefore, as long as the price falls below 3330 and then declines again, it's a good opportunity to ambush and buy from a low position. This could also be the next short-term low. Over the past four months of consolidation, the lows have clearly been gradually moving higher, and the end of the converging triangle has been gradually narrowing. One day, a major unilateral breakout will occur. Patiently wait for a return to the bullish trend.
Pay attention to the channel trend resistance line 3358-60. This position is actually the oscillation center axis point of 3330-3380. If the rebound is under pressure here, you can buy on highs and then fall back; once the hourly line closes positive and effectively stands on this position, give up the bearish view; and the low bullish position focuses on the 618 division, the previous top and bottom conversion, the lower track of the channel, etc.; as long as you dare to pull it down, you must dare to be bullish when a stabilizing K appears. The lower the effect, the better, because the lower it is, the more aggravated the divergence effect. FOREXCOM:XAUUSD ACTIVTRADES:GOLD ICMARKETS:XAUUSD ACTIVTRADES:GOLD EIGHTCAP:XAUUSD CMCMARKETS:GOLD VANTAGE:XAUUSD CMCMARKETS:GOLD VANTAGE:XAUUSD
XAUUSDThe bull market seems to be on the verge of another attack next week. The bottom may have formed a double bottom structure.

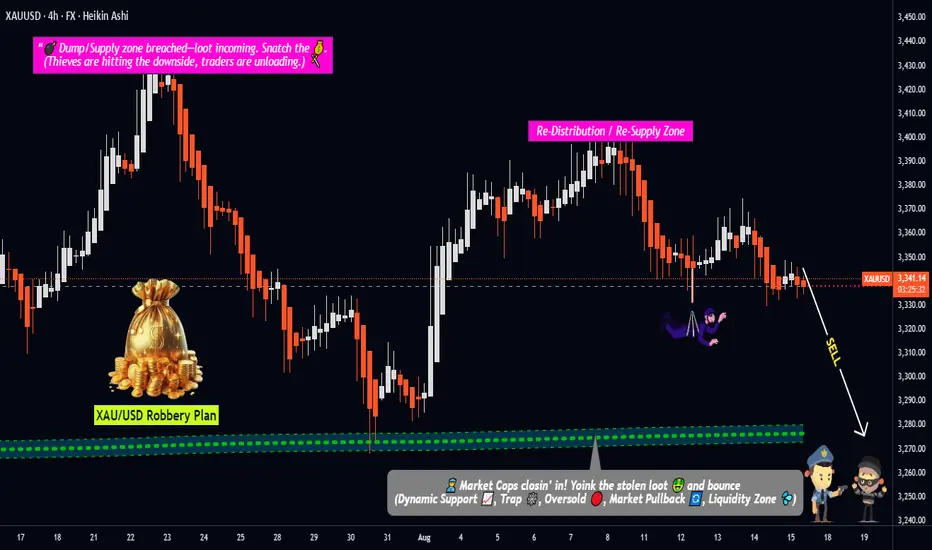
Gold Under Attack! Thief Trader’s Layered Sell Plan in Action!💣 XAU/USD GOLD HEIST: Police Waiting at 3270 – Escape Before They Catch Us! 🔐💰
🕵️♂️ Hello Thief OG’s, Money Grabbers & Market Shadows!
Today’s mission is Gold (XAU/USD) – not to wear, but to steal! 💸✨
🎯 MISSION BRIEF
We’re going BEARISH on Gold. No single-shot nonsense – we’re using layered SELL LIMIT traps to grab the loot piece by piece.
💼 Entry Layers:
3340.00
3350.00
3360.00
(💡 Add more layers if you want to go full gang mode.)
🛑 Stop Loss – The Alarm Trigger
SL @ 3380.00 🚨
But hey… Thief OG’s adjust it to your own strategy & risk. Don’t get caught with your mask off. 😎
💰 Target – The Escape Plan
Main Target: 3270.00 (Police barricade 🚔)
Quick Exit: 3280.00 (Escape van is ready 🚐)
📊 Why This Is the Perfect Hit
Price dancing near resistance – the “vault door” is open.
Weak bullish attempts = fake gold rush trap.
Trend sniffers pointing down on higher timeframes.
Market makers guarding at 3380 = the alarm system.
📜 Thief Trader Rules for This Mission
Avoid entering during major economic news bombs 💣.
Trail your SL once price moves in your favor – thieves who overstay get caught.
Always rob smart – we’re professionals, not gamblers.
💥 Support the Robberhood Crew!
Boost this idea if you want more Thief Trader missions.
Every boost = more ammo for the next market robbery.
Remember: No chase, no case. 🕶️💼💣
#XAUUSD #GoldTrade #BearishPlan #LayeringStrategy #ThiefTrader #RobTheMarket #BoostForMore
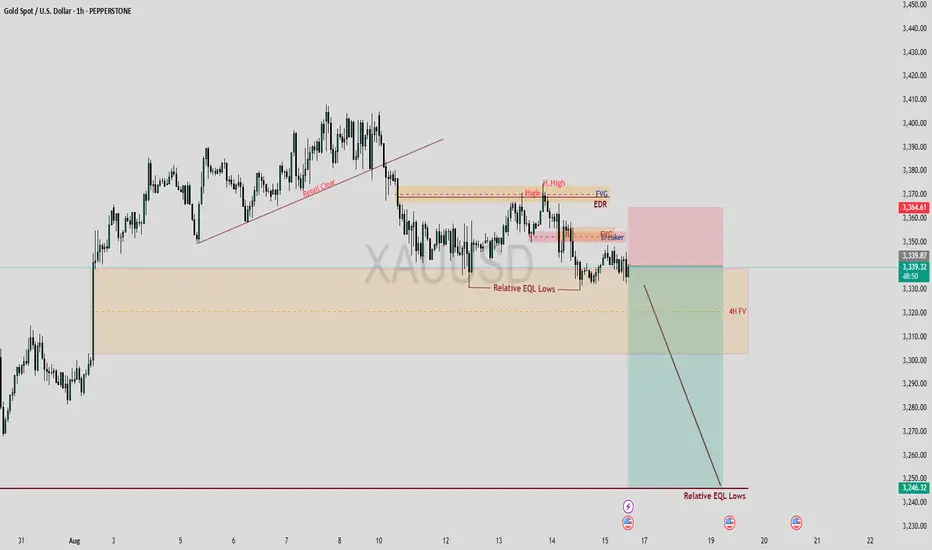
A Bearish Idea on Gold, Are you Bullish yet?Hello Fellow traders,
Today, we are looking at gold and I am expecting a bearish momentum. The daily FVG was succesfully traded to facing a good rjection. Now we keep our eyes on 4H FVG thats residing just below. We willsee how the 50% of that FVG is crossed whether with a displacement which I wuld love to see, like market breaks below the 50% of FVG with a strong momentum, then we expect the price to take the lows around 3250 becuae thats where Equal highs are and price is highly likely to attract towards it just like a magnet.
However, thus far price action has been bearish, as we price got rejected in that 1H FVG as highlighted and price made two highs one top of other making a turtle soup and then broke below the recent low with a displacement and thats where Breaker Block takes birth and also an FVG. Pice then goes back to fill the FVG and trade to the new born beaker and then the low is taken but wait "Relative EQL Lows".
Anyways, the market now seems to return back to the lows and we can expect the market to now displace through these lows wth a strong momentum. If that happens, it's all gonna be easy to trade to lower liquidity "might be a sudden attack, who knows!"
Thats it for today fellows, kee grinding, keep working.
RESPECT THE RISK!
3350, 3330 become the key, rebound continues to shortYesterday, the gold daily line closed with a big negative line, recovering the gains of the previous two days. The daily technical indicators formed a death cross, and the moving average diverged downward. The current trading market is generally weak and volatile.
Judging from the 4H chart, the short-term upper pressure is at 3350 and 3365 points respectively. The middle track of the Bollinger band at 3350 is the weak watershed. If it fails to break through effectively, gold will still fluctuate and be bearish in the short term. If the short-term support of 33330 below fails to hold, the bearish downward range will be further opened, and it is expected to test the effectiveness of the support of 3320-3300 below.
On the whole, if the first rebound in the European and American markets today touches 3350-3365 and does not break, you can consider shorting with a light position. The first target is 3330, and if it breaks, it will be 3320-3300. There have been frequent fluctuations recently. Don't chase rising prices or sell falling prices. Wait patiently for key points to enter the market.

Oscillating downward, shorting again on rebound#XAUUSD
Judging from the current market, gold tends to fluctuate and fall in the 4H. 📉After hitting the high of 3374 yesterday, the bullish momentum lacked continuity, gradually breaking down and declining to give up the previous day's gains. ⚖️
After consecutive negative closings, the Bollinger Bands opened. In the NY period, we will rely on the middle track of the Bollinger Bands to further see the room for decline. It is expected that the volume will increase after short-term consolidation. 📊
The upper pressure is focused on 3348 and 3358. 🌈The operation is mainly short-selling on rebound.🐻 The first target below is around 3330. If it breaks, it will go to 3320-3300.🎯
🚀 SELL 3348-3358
🚀 TP 3330-3320

$3,331 Support Under Siege — Is Gold About to Crash?Price has been trending lower since the left side of the chart, shifting from a distribution top into a sequence of lower highs and lower lows. After the failed rally into the mid-chart, sellers re-asserted control and the market is now compressing under a local supply shelf. The last several candles hover around ~3,338 with shallow bounces and repeated rejections—typical of a market leaning heavy into support rather than springing from it.
The key battleground is the 3,331 zone (two green dotted prints around 3,331.17 / 3,329.85). It has acted as a base multiple times, but every touch is coming from lower highs, which increases the odds of a breakdown. Beneath that, a clean air pocket runs to 3,301.28–3,301.77 (next green level), and if momentum extends, the measured downside points toward 3,268.12 at the bottom of your map. On the topside, supply stacks up tightly: intraday cap at 3,355.98–3,360.00, then higher resistance shelves at 3,374.81, 3,390.60, and 3,409.43 (all marked with red dotted lines). The clustering of red “S” markers around the 3,355–3,375 area reinforces that zone as distribution/sell interest.
Market structure confirms the bearish bias: each rally attempt is getting sold earlier (progressively lower swing highs near ~3,360 → ~3,350), while the base at 3,331 is getting probed more often. That’s classic compression into support. The small-bodied candles near current price show lack of aggressive buying; wicks on the upside into ~3,345–3,355 keep getting faded. The green “B” markers that appeared on recent dips have not driven a higher high, which weakens their signal and suggests they’re catching falling knives inside a down-structure.
A quick invalidation map helps frame risk: any 1H close back above 3,360 would neutralize the immediate short idea and expose a squeeze toward 3,374.8, and only then would 3,390.6 → 3,409.4 come back into play. Until that reclaim, the path of least resistance remains down, with liquidity likely resting below 3,329–3,331.
Trade Setup (bearish)
• Option A — Breakdown Play: Sell the decisive break and 1H close below 3,331, or short a retest of 3,331–3,334 from underneath. Stop: above 3,356–3,360 supply. Targets: 3,301 first, stretch to 3,268 if momentum persists.
• Option B — Fade the Rally: If price bounces into 3,352–3,360 supply, look for rejection wicks to short. Stop: above 3,374.8 (next resistance shelf). Targets: 3,331 initial, then 3,301; leave a runner toward 3,268.
Risk notes: avoid chasing the very first tick below 3,331—gold often does a quick sweep before the real move. If a sweep below 3,331 snaps back inside the range and closes above the level, step aside; that’s a trap. Once the first target is hit, consider taking partial profits and trail the stop above the most recent 1H lower high to stay aligned with the down-trend. Economic calendar icons on the chart suggest upcoming USD events—expect spikes; keep sizing modest until after prints.

Grasp the market rhythm and improve trading success rateAfter a sharp drop on Monday, gold prices saw a volatile rise on Tuesday and Wednesday, closing with small bullish candles. The rebounds on these two days were relatively limited, so for now, we can define them as a correction after a sharp drop. This correction isn't a trend reversal, but rather a brief respite after a sharp decline, reflecting a temporary balance of power between bulls and bears. The 5-day moving average is trending downward, indicating continued downward pressure on gold in the short term. Meanwhile, the 10-day moving average remains upward, suggesting that the previous upward trend in the medium term has not been fully broken. The death cross formed between the two is a key signal, signaling a divergence between short-term and medium-term trends, and increasing market uncertainty. The current moving average system is somewhat disorganized, lacking a clear alignment. In the short term, we should continue to monitor volatility, focusing on shifts in bullish and bearish forces during this period. For today's market, we should prioritize a rebound in gold. On the upside, focus on resistance near 3375-3385, marking the 0.618 golden ratio level during gold's decline from 3409 to 3331. On the downside, focus on support near 3330-3320.
Trading strategy: We recommend buying gold on a pullback near 3335-3320, with the target at 3350-3360-3370.

8/15: Watch Resistance at 3348–3358, Support at 3328–3323Good afternoon, everyone!
Yesterday, gold’s rebound was capped at 3352–3358, failing to turn resistance into support. As anticipated, price then moved into the 3332–3323 battleground.
On the 2H chart, bulls still hold a slight edge, with signs of a potential double bottom. However, if price continues to face resistance at 3348–3352 without breaking out, or loses the key 3328 support on a pullback, bullish momentum will weaken, and a bearish setup may re-emerge, increasing the likelihood of a retest near 3300.
With important US session data ahead, my strategy today differs from yesterday — focusing on buying dips as the main approach, with shorting near highs as a secondary option. Manage risk carefully and feel free to reach out if you need assistance.

Gold prices remain volatile, waiting for direction selectionGold prices (XAU/USD) rebounded modestly during Friday's Asian trading session, recouping some of the previous day's losses, but bullish momentum was limited. The dollar's previous rally, buoyed by strong US Producer Price Index (PPI) data, lacked sustainability. Investors widely expect the Federal Reserve to resume its interest rate cut cycle in September, supporting gold.
According to data released by the US Bureau of Labor Statistics, the PPI grew 3.3% year-on-year in July, exceeding market expectations of 2.5% and significantly higher than June's 2.4%. Despite this, the CME FedWatch tool shows a 90% probability that the Fed will cut interest rates by 25 basis points in September, with a cumulative 50 basis points cut expected by year-end.
Furthermore, market sentiment was supported by multiple positive factors, including easing trade concerns between the US and Asia and the potential for a ceasefire in the Ukrainian conflict following the US-Russia summit. These factors have boosted global risk appetite and limited further gains for gold as a safe-haven asset.
Analysts point out that amidst a rebound in risk appetite, gold's short-term performance may hinge on upcoming data releases such as US retail sales, the New York Fed manufacturing index, and the University of Michigan's consumer confidence index. These indicators could influence the US dollar and, indirectly, gold prices.
Daily chart analysis shows that gold prices are encountering significant resistance near the 100-hour moving average (around $3,355). Multiple rebounds have failed to break through this level, indicating that short-term selling pressure remains significant.
If prices break through this level, they could test the $3,375 and $3,400 levels. However, a break below $3,330 support could trigger an accelerated decline, potentially targeting $3,300 or even lower. Technical indicators show weak daily volatility, and the short-term trend remains downward.
The current rebound in gold is more of a technical correction than a trend reversal. Amidst a lack of sustained US dollar buying and lingering expectations of a Fed rate cut, gold prices are likely to remain range-bound in the short term.
However, if market risk sentiment further heats up, gold's safe-haven properties may continue to weaken. We need to pay attention to the effectiveness of the $3,330 support. Once it is lost, the downside space will open up quickly. FOREXCOM:XAUUSD ACTIVTRADES:GOLD ICMARKETS:XAUUSD FOREXCOM:GOLD ICMARKETS:XAUUSD CMCMARKETS:GOLD ICMARKETS:XAUUSD ACTIVTRADES:GOLD

GOLD IFVG SHORT SETUP TRADE DETAIL :
IFVG ?
Inverse Fair Value Gap 💡
Thats We Are Selling Gold At 3350 / 3354
Stoploss 3360
Take Profit Levels : 3345, 3340, 3335, 3330
Manage Your Trade Properly Follow Us For More Trades

Gold Price Analysis August 15💡 Gold Trend Analysis (XAU/USD)
Gold is currently receiving buying pressure around the 3332 area, which coincides with the Fibonacci 0.382 area, indicating that this is an important support area (Key Level) in the short term. The price is currently fluctuating in the 3332 - 3360 range.
🔸 BUY Trigger: 3360
If the price breaks out of the 3360 area, and at the same time surpasses the resistance Trendline and the Fibonacci area, it will confirm stronger buying pressure and the possibility of the uptrend continuing.
🔸 SELL Trigger: 3332
If the price closes below the strong support area of 3332, it will be a signal confirming the continuation of the downtrend - opening up an opportunity to sell.
📍 Summary:
Gold is sideways in the 3332 - 3360 area.
Wait for a breakout to confirm a clear trend.
Prioritize trading in the direction of breaking the boundary.

Gold - The diligent top formation!🏆Gold ( TVC:GOLD ) finished the bullrun:
🔎Analysis summary:
For the past 10 years, Gold has been trading in a very strong expected bullrun. Just like we witnessed it in 2011, a 10 year bullrun is followed by a shorter term bearmarket. Gold is starting to lose its strength, which is a clear sign of weakness and the beginning of a bearish reversal.
📝Levels to watch:
$2.800
SwingTraderPhil
SwingTrading.Simplified. | Investing.Simplified. | #LONGTERMVISION

Gold Price Analysis August 14Gold – The uptrend is still maintained, the focus is 3345
Gold price has broken through the Fibonacci level of 0.618, confirming the continued uptrend. However, the Asian session witnessed unexpected selling pressure pulling the price back to the breakout zone of 3355.
Since breaking 3358, the 3345 level has become the most important support point of the uptrend – coinciding with the H4 trendline. Only when 3345 is penetrated, the uptrend scenario will be threatened.
Trading strategy:
BUY around 3360 when breaking and retesting the support zone (Fib 0.618).
BUY at 3345 if there is a signal of support rejection with a clear buying candle.
SELL when the price breaks and trades stably below 3343.

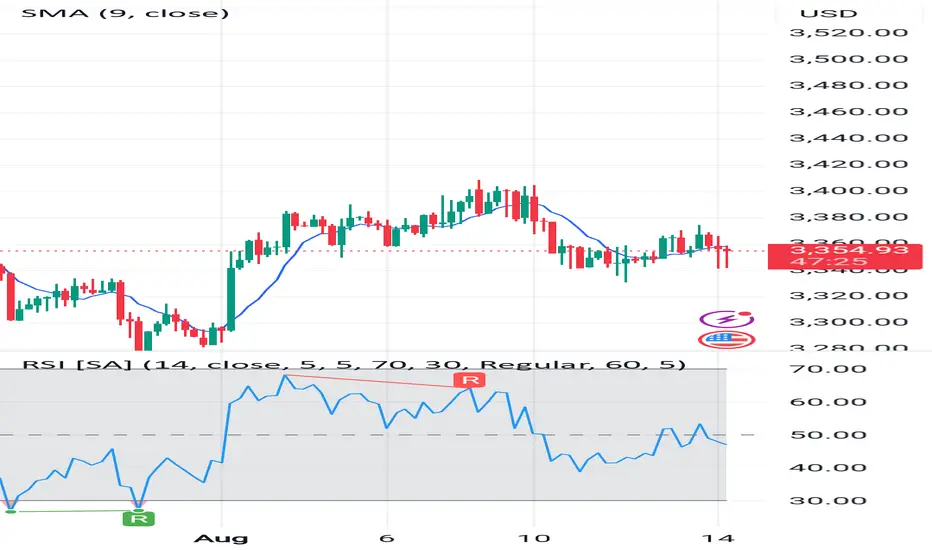
XAUUSD (4H timeframe) technical analysis based on your chartCurrent Market Price
Sell Price: 3,354.08
Buy Price: 3,354.29
Very tight spread, indicating high liquidity.
Indicators Used
SMA (9-period) – Price is currently below the SMA, suggesting short-term bearish momentum.
RSI (14) – Currently around ~50, indicating a neutral zone (neither overbought nor oversold).
Recent RSI Trend – It recently dropped from ~65 to ~45, showing weakening buying pressure.
Price Action
Recent price movement shows:
A sharp drop from ~3,400 to ~3,325.
A small recovery attempt, but failing to break above SMA 9, showing sellers are still in control.
Candlestick patterns show lower highs and lower lows, a classic bearish sign.
Support & Resistance Levels
Immediate Resistance: ~3,375 (SMA 9 area & recent rejection zone).
Immediate Support: ~3,325 (recent bounce area).
Major Resistance: ~3,400
Major Support: ~3,300
Signal
Trend Bias: Bearish in short term.
Momentum: Weak buying strength, sellers still dominant.
Recommendation: SELL
Entry: Around 3,354–3,360 (current price zone).
Stop Loss: Above 3,375 (above SMA & last swing high).
Take Profit 1: 3,325 (near-term support).
Take Profit 2: 3,300 (major support zone).
Risk Management
Risk–Reward ratio target: at least 1:2.
Avoid over-leverage; gold can move fast on news.
📌 Summary:
The market shows weakness after a failed recovery. Price staying below SMA 9 and RSI losing momentum indicates sellers are in control. Unless price breaks above 3,375 with strong volume, the bias remains short-term bearish.
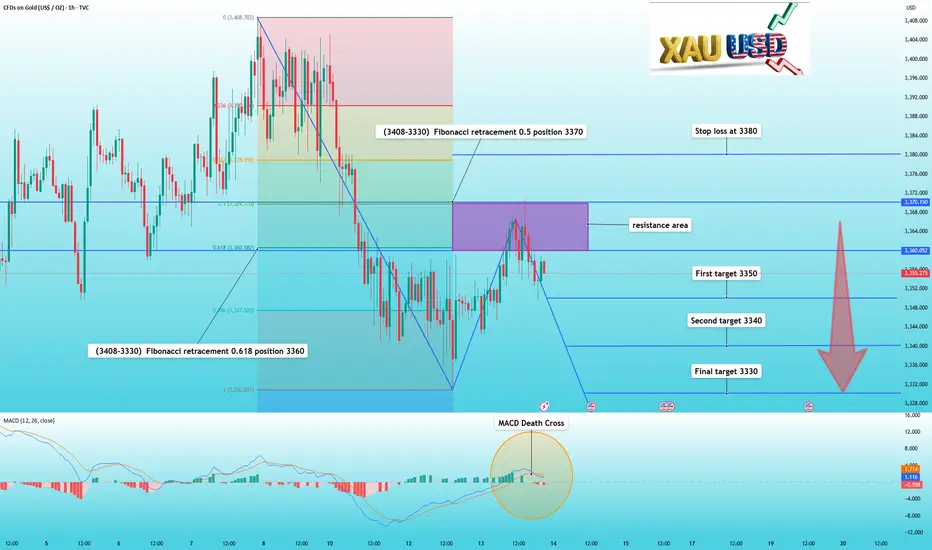
Gold pulls back as expected, you can continue to sellIn my previous trading strategy, I reiterated my view that gold prices would continue to fall if they couldn't break through 3370 in the short term.
And indeed, gold's performance behaved as expected. After hitting 3370, it fell again, reaching a low of 3350.
Technically, the current correction in gold prices hasn't concluded. The Fibonacci retracement indicator for the 3408-3330 trend shows that 3370 is at 0.5, and 3360 is at 0.618, representing resistance. Meanwhile, the MACD indicator has formed a death cross.
Therefore, we do not need to make any changes to our trading strategy. As long as 3370 is not effectively broken, we can continue to short based on the resistance range.
Trade setup is as follows:
Sell near the 3360-3370 area
First target 3350
Second target 3340
Final target 3330
Stop loss at 3380
📣If you have different opinions, please leave a message below to discuss
Accurately capture golden trading opportunitiesGold as a whole rose and fell yesterday, and fell under pressure after being blocked near 3370. The daily line closed with a bullish doji, and rose again after opening. The rise was slow and looked back step by step. It is expected that there is still room for upward movement today, so don’t blindly chase the bulls when you are bullish, and focus on buying on dips. In the 4H cycle, although the Bollinger Bands are closing, the current consecutive positive breaks through the middle track are a slow bull rise pattern, which is still a bullish signal. Therefore, in terms of operation, go long when it falls back to support. Pay attention to the 3355-3340 area below, and the 3375-3390 area above. After breaking through, look at above 3400. I will prompt the specific operation strategy at the bottom, so pay attention in time!
Gold operation suggestion: Go long in batches when gold falls back to around 3355-3340, with the target at 3370-3380.

SHORT TRADE XAUUSDXAUUSD – Short Trade Update 📉✨
Price broke through the key support level at 3358 with strong bearish momentum, confirming a shift in market sentiment. After the breakdown, we saw a clean retest of the broken support (now resistance), giving a perfect entry opportunity for a short position.
Executed the trade with precision — 50 pips secured on the downside move. This is a classic break-and-retest setup, showing how patience and technical levels can align for high-probability trades. 🚀
Key Levels:
Resistance (retest): 3358
Support target: 3352 & 3345 zone
Stay disciplined, follow your plan, and let the market do the work. 🏆

8/14: Watch Resistance at 3352–3358, Support at 3332–3323Good afternoon, everyone!
After entering the 3372–3378 resistance zone, gold attempted two breakouts but failed, forming a double-top pattern and breaking below the 3366 support. It then found temporary support at 3358–3352, but the rebound failed to reclaim 3366, leading to a further drop to test the 3343–3337 area. This is a textbook support-to-resistance shift, worth studying for those interested in technical analysis.
Currently, the structure favors the bears. In the coming moves, watch closely to see if the 3352–3358 area turns from support into resistance again. If selling pressure persists, 3332–3323 will be the next battleground. Should bulls fail to defend it, the 3300 level could be retested.
For the rest of the week, trading should remain focused on these key support and resistance zones. With data coming in during the US session today, risk management is crucial — favor short positions on rebounds, with long trades as a secondary option. If caught in a losing position, and your account is safe, consider averaging down or hedging. If you need assistance, feel free to message me.

XAUUSD analysis – 1H FVG and OB SetupsOn the 1H gold chart, price recently reacted to the FVG (red zone) at 3410, showing a clean rejection and shifting order flow to the downside.
Below the current price, we have three key bullish OB zones:
First green OB around 3460, acting as the closest demand zone.
Second green OB around 3310, a deeper liquidity zone.
Third green OB at 3287, a stronger higher-timeframe demand that may act as a swing point.
If price retraces back into 3410 and rejects with confirmation in lower timeframes (3m–15m), it could provide a short setup toward the 3460–3310 demand range.
Conversely, if price breaks above 3410 with strong momentum, the bias may shift to testing higher liquidity levels.
📊 ProfitaminFX | Gold, BTC & EUR/USD & Crypto
📚 Daily setups & educational trades
