At which support zone will the correction wave end?✏️The accumulation of Gold price in today's trading day from Fibocacci 0.5-0.618 is raising the question of whether the bullish wave structure will continue. Previously a perfect push of Gold price from 3282 to 3406 formed a wave 3 increase, currently the decline in the beginning of the week of Gold is running in the corrective wave of wave 4. 3330 is an important zone in the bullish wave structure, if this zone is broken, the market will end the bullish wave towards ATH.
📉 Key Levels
BUY trigger The reaction of the buying candle at 3330
BUY trigger The confirmation of the candle closing above 3357 (fibonacci 0.618)
Target 3383 Higher is 3431
Leave your comments on the idea. I am happy to read your views.
Xauusdshort

XAUUSD Trend Analysis – H1 TimeframeOn the H1 chart, gold is moving within an ascending channel after completing a consolidation phase around the 3,340 – 3,345 USD support zone. Current price hovers near 3,368 USD, positioned in the upper half of the channel, reflecting short-term bullish control.
1. Key Technical Levels
Nearest Support: 3,355 – 3,360 USD (mid-channel, confluence with EMA support)
Major Support: 3,340 – 3,345 USD (previous consolidation low)
Immediate Resistance: 3,380 USD (upper channel boundary)
Key Resistance: 3,399 – 3,405 USD (confluence of previous highs and horizontal resistance)
2. Price Action Insights
Following the drop from 3,410 USD, price formed a double bottom around 3,340 USD and rebounded.
Trading volume is increasing as price approaches the upper channel, indicating stronger buying pressure.
Both EMA20 and EMA50 are trending upward, acting as dynamic support.
RSI remains above 50 and below overbought territory, signaling further upside potential.
3. Suggested Trading Strategies
Scenario 1 (Preferred): Buy on pullback to 3,355 – 3,360 USD, SL below 3,345 USD, short-term TP at 3,380 USD, extended TP at 3,399 – 3,405 USD.
Scenario 2: Buy on breakout above 3,380 USD with strong volume, enter after successful retest, SL below 3,370 USD, TP at 3,399 – 3,405 USD.
Risk Scenario: A break below 3,340 USD invalidates the short-term uptrend, opening the way to 3,320 USD.
Conclusion
XAUUSD maintains a clear short-term bullish structure. The 3,355 – 3,360 USD area offers a strategic buying opportunity, but traders should monitor reactions at 3,399 – 3,405 USD to avoid reversal risk. Follow for more quality trading strategies.

Gold rebounded, but its future trend is still full of variables.Spot gold (XAU/USD) saw a second consecutive day of buying on Wednesday (August 13), attempting to build on its previous day's rebound from around $3,331. The latest US Consumer Price Index (CPI) data for July was largely in line with expectations, reinforcing market expectations of a September interest rate cut by the Federal Reserve. This data kept the US dollar at a more than two-week low and further supported gold, a non-yielding asset.
However, gold's intraday gains appeared to lack sufficient momentum, particularly as the US-Russia summit, potentially contributing to an end to the Russia-Ukraine conflict, has somewhat suppressed its safe-haven properties. This shift in market sentiment suggests that holding long gold positions remains prudent without strong follow-on buying.
US Consumer Price Index (CPI) data for July showed that the CPI remained unchanged at 2.7% year-on-year, but the core CPI (excluding food and energy prices) rose to 3.1%, exceeding expectations of 2.9%. While this data failed to stoke market concerns about inflation, signs of labor market weakness still support expectations that the Federal Reserve may cut interest rates twice before the end of the year.
CME Group's FedWatch tool also indicates that the market generally expects the Fed to cut interest rates, which may put pressure on the US dollar in the coming days, further benefiting gold.
Technical Analysis
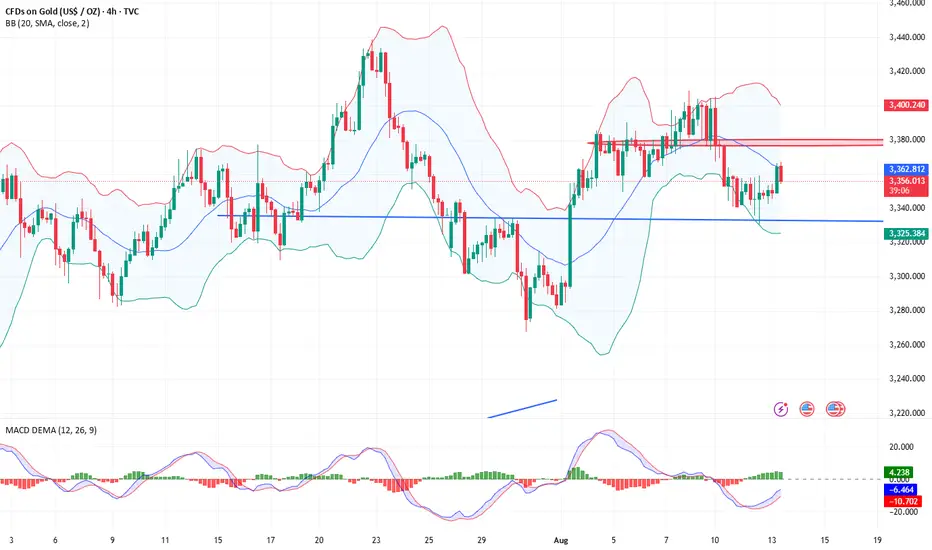
From the chart, gold's current price trend shows some signs of recovery. After falling to the $3,331 area, the price found support and rebounded on August 13, breaking through the previous day's high. This suggests that bullish momentum has strengthened in the short term and may continue to push gold prices to test higher resistance levels.
The Bollinger Bands indicate that the price is currently near the middle band of the Bollinger Bands, and the bands are showing a certain expansion pattern, indicating increased market volatility. If the price maintains this level, it may open up further room for growth, further testing the resistance level of $3,400.
The MACD indicator shows that the current MACD lines have begun to converge, and the green histogram is shortening, indicating a rebound in bullish market momentum. However, attention remains to be paid to whether the MACD will form another death cross, leading to a price pullback.
Market Sentiment Observation:
Current market sentiment is mixed. Gold's rebound is supported by expectations of a Fed rate cut and easing global trade and geopolitical risks. Nevertheless, strong stock market performance may weaken gold's safe-haven demand, especially amid growing optimism about the global economy.
The S&P 500 and Nasdaq hit record highs, while Japan's Nikkei 225 index broke through 43,000 points. These positive stock market performances may weaken demand for gold, especially as market sentiment favors a risk-on outlook.
Market Outlook:
Bullish Outlook:
Gold is likely to continue to be supported in the short term by a weak dollar and expectations of rate cuts, with prices expected to test the previous high near $3,409. If gold breaks through and stabilizes above this level, further upside potential is likely, potentially targeting the $3,450 area.
In the long term, if global economic uncertainty persists and the Federal Reserve maintains its pace of rate cuts, gold is likely to remain relatively strong.
Bearish Outlook:
However, if the stock market continues to strengthen and the global economy recovers further, gold's safe-haven demand may gradually decline. In this case, gold's upward momentum may weaken, and prices may retreat to support levels around $3,329 or even lower.
Overall, in the current market environment, gold's short-term trend still needs to closely monitor changes in the stock market, the US dollar, and the global geopolitical situation, and traders should adjust their positions flexibly based on these factors. PEPPERSTONE:XAUUSD ACTIVTRADES:GOLD VANTAGE:XAUUSD ACTIVTRADES:GOLD EIGHTCAP:XAUUSD FOREXCOM:GOLD PYTH:XAUUSD CAPITALCOM:GOLD
8/12: Key Support at 3343–3337, Resistance at 3366–3372Good morning, everyone!
Yesterday, the market saw a one-sided drop, with selling pressure on the 4H chart largely released. However, the daily bullish structure has been damaged. Given the size of yesterday’s decline, there’s a decent chance of an intraday rebound today.
Key support levels to watch are 3343–3337 and 3328–3323, while resistance sits at 3352–3358 and 3366–3372–3378. Trading should focus on these zones.
With today’s news-driven volatility likely to exceed yesterday’s, if the downtrend continues, I see 3312–3298 as an attractive buying opportunity. My overall bias for the day remains buying on dips, with potential short opportunities near resistance.

XAUUSD – Intraday Trading Plan (1H Chart) Gold has completed a corrective phase after breaking down from its previous ascending channel. On the H1 chart, price has formed a base around 3,340 – 3,350 and is now pushing higher, showing signs of bullish momentum with a clear breakout from the consolidation box.
Key Technical Levels:
Immediate Support: 3,353 – 3,340 (Option 1 SL zone)
Major Support: 3,314 – 3,306 (last defensive demand zone)
Immediate Resistance: 3,377 – 3,380 (minor obstacle)
Primary Target Resistance: 3,399 – 3,405 (Option 2 TP zone)
Technical Insights:
Trend Structure: Price previously respected the ascending channel but lost momentum, leading to a downtrend. Current breakout suggests a potential reversal attempt
Volume: Increasing volume during breakout adds confidence to bullish bias.
Risk-Reward: Current setup offers R:R ~ 3.47, attractive for intraday swing.
EMA & RSI: EMA turning upward; RSI is neutral, allowing more upside before overbought pressure kicks in.
Fibonacci: The 0.5–0.618 retracement from the last swing drop aligns with the 3,399–3,405 target zone.
Trade Strategy:
Option 1 – Breakout Continuation (Active Setup)
Entry: 3,365 – 3,366 (current price zone)
Stop Loss: 3,353
Take Profit: 3,405
R:R: ~3.47
Option 2 – Pullback Buy
Entry: On retest of 3,353–3,340 support zone with bullish confirmation.
Stop Loss: Below 3,330
Take Profit: First TP at 3,380, second TP at 3,405.
Bias:
Bullish short-term outlook while holding above 3,340. A break and close above 3,380 would strengthen the case for reaching 3,405.

Rebound is still a good opportunity to shortGold was trading sideways at a low level yesterday, with bulls and bears oscillating back and forth. After the data was released, it broke the bottom slightly, touching the lowest point of 3331, and then quickly recovered to the range. The overnight daily line closed with a bullish cross star, indicating that bulls and bears are temporarily balanced. Today, we will maintain the idea of oscillation. Before the range is effectively broken, short-term long and short operations will be the main focus. The Bollinger Bands in the 4H cycle are closing. After oversold, the decline has temporarily stopped and stabilized. There is a need for a rebound and repair in the short term, but the strength is expected to be limited. Pay attention to the pressure in the 3357-3370 area on the top. In terms of operation, the rebound is mainly under pressure at high altitude. The lower targets are 3340-3331 in turn. If it breaks, it will further look to the 3320 line.
Gold operation suggestion: short gold around 3357-3370, target 3340-3331-3320. If the support area of 3335-3320 stabilizes, you can consider going long.

EURUSD GBPUSD and DXY Analysis todayHello traders, this is a complete multiple timeframe analysis of this pair. We see could find significant trading opportunities as per analysis upon price action confirmation we may take this trade. Smash the like button if you find value in this analysis and drop a comment if you have any questions or let me know which pair to cover in my next analysis.

Gold Technical Analysis August 13, 2025Gold prices fell sharply as US President Donald Trump clarified his tax policy on precious metals.
The gold market is still waiting for an official announcement from the White House on the possibility of applying it to imported gold bars of 100 ounces and 1kg. However, on social media, US President Donald Trump said that this precious metal will not be subject to import tax.
Despite strong selling pressure on world gold prices, a market strategy still predicts a price of $4,000/ounce by the end of the year.
Mike McGlone - Senior Commodity Strategist at Bloomberg Intelligence said that looking at the bigger picture, gold is still supported at an important level above $3,300/ounce and the technical forum could signal an upcoming breakthrough.
“ETFs have turned to strong inflows after four years of net outflows. A slight correction in US stocks could be the catalyst to push gold closer to $4,000 an ounce”

XAUUSD H1 Technical Outlook - Key Levels & Strategies for Today1. Trend & Price Structure
Previously, gold moved within an ascending channel but broke down on Aug 9, accompanied by strong selling pressure.
The price is now consolidating sideways around the 3,350 – 3,351 support zone (Option 1), with decreasing volume.
Short-term EMAs (EMA20, EMA50) are still below EMA200, indicating the short-term trend remains bearish.
2. Key Support & Resistance Levels
Immediate Support: 3,350 – 3,351 (a breakdown could send the price toward 3,325).
Near-term Resistance: 3,360 – 3,361 (aligned with EMA50 on H1).
Major Resistance: 3,375 – 3,380 (Option 2).
Deeper Support: 3,311.
3. Fibonacci Analysis
The recent drop from 3,390 to 3,346 shows the 0.5 retracement at ~3,368 and the 0.618 retracement at ~3,375.
Both levels overlap with strong resistance, increasing the likelihood of a bearish reaction from these zones.
4. Trading Strategies for Today
Scenario 1 (Preferred – Short): Wait for a pullback toward 3,360 – 3,375. If a reversal signal forms (e.g., pin bar, engulfing), consider short positions.
TP: 3,351 → 3,325
SL: Above 3,380
Scenario 2 (Countertrend – Long): If the price holds above 3,350 and breaks 3,361 with strong volume, consider a quick long trade toward 3,375.
SL: Below 3,346
Note: The H1 trend remains bearish, so long trades should have tighter risk management.
5. Additional Confirmation Signals
RSI on H1 is around 45–50, showing a neutral zone – watch for a breakout from the current range for confirmation.
Volume is decreasing, suggesting a potential volatility breakout soon.
Keep these levels on your watchlist and wait for a clear breakout or rejection before entering trades to avoid false moves.

Three techniques to accurately capture the gold marketAt present, gold as a whole still maintains a range-bound pattern. Although the CPI data is bullish, the overall trend structure of rising and falling has not changed. It is still under pressure from the high point of the range, and supported by the low point of the range. In the case that there is no breakthrough unilateral market in the current volatility, the operation is still based on the range thinking. From the hourly line structure, the high point has not been refreshed and the low point has been lost. The short-term bearish operation characteristics are obvious. The bearish reference suppression area is around 3357-3370. The support below focuses on the 3335-3320 area. If it is lost, the strategy will be adjusted.
Gold operation suggestion: short sell under pressure near 3357-3370, target 3345-3335. If the 3335-3320 area stabilizes and is not broken, a short-term long layout can be considered.

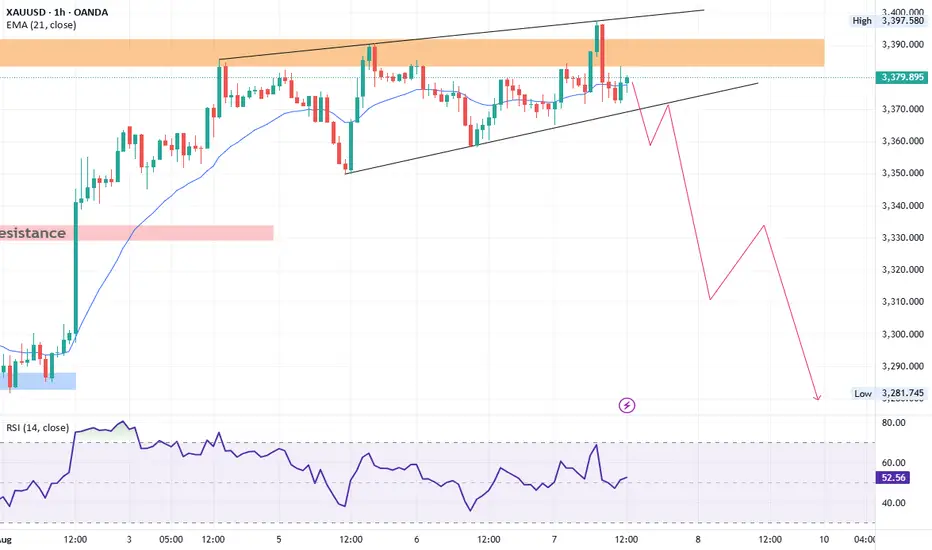
XAUUSD Technical AnalysisGold is currently trading within a rising wedge pattern on the 1-hour chart. The price recently touched the upper trendline of the wedge and faced a strong rejection, indicating bearish pressure. If the price breaks below the lower boundary of the wedge, it will likely trigger a sharp bearish move.
Key downside targets after a confirmed breakdown are:
3340
3300
3270
If Gold drops below 3270, the next significant support lies at 3250 on the daily chart. A daily close below 3250 will confirm a shift in the medium-term trend, opening the path toward the 3000 psychological level.
OANDA:XAUUSD
XAUUSD Intraday Analysis – H1 Chart 12/8Technical Overview:
On the H1 chart, gold (XAUUSD) is trading around 3,346 USD after a decline from the recent high near 3,394 USD. Price is now reacting at the strong support zone 3,340 – 3,335 USD, which previously acted as a key demand area before a bullish breakout.
Key Technical Levels:
Major Support: 3,340 – 3,335 USD (recent low, aligned with prior accumulation zone).
Near-term Resistance: 3,360 – 3,370 USD (short-term supply zone).
Major Resistance: 3,390 – 3,394 USD (previous swing high).
Short-term Structure: Price is showing signs of forming a double bottom around support, with selling pressure slowing down
RSI (if applied) is approaching oversold territory → potential rebound setup.
EMA Outlook: If price holds above 3,340 and reclaims short-term EMAs, a strong bullish recovery could follow.
Trading Strategy Ideas:
Primary Long Setup
Entry: 3,340 – 3,335 USD.
Stop Loss: Below 3,328 USD.
Take Profit 1: 3,360 USD.
Take Profit 2: 3,390 USD.
Alternative Short Setup
Condition: A clean break below 3,335 USD with strong volume.
Stop Loss: Above 3,345 USD.
Target: 3,320 USD.
Outlook:
If the 3,335 USD support holds, gold could stage a rebound toward 3,360 and 3,390 USD. Traders should closely watch price action in this zone for confirmation before entering positions.
Follow for more high-quality trading strategies.

XAU/USD Bullish Bounce from Demand Zone !Gold (XAU/USD) on the 4H chart is showing a potential bullish reversal setup. Price has pulled back into a Fair Value Gap (FVG) and high supply/demand zone near 3,329–3,315, aligning with the 0.382–0.5 Fibonacci retracement.
Key Points:
Support Zone: 3,329–3,315 (demand + FVG).
Bullish Rejection Expected: Price may bounce from this zone, targeting upper resistance levels.
Upside Targets:
TP1: 3,356
TP2: 3,375
TP3: 3,440–3,459 (major resistance)
Invalidation: A daily close below 3,315 could open room for deeper downside toward 3,278–3,245.
Indicators: EMA(9) and Ichimoku showing potential for trend resumption if price closes above 3,362.
Overall, the chart suggests a buy setup on bullish confirmation, aiming for the 3,375–3,459 zone.

How to correctly grasp the gold trading opportunities?Yesterday, gold showed obvious weakness on the technical side. It fell rapidly after opening, broke through the 3380 mark and showed a narrow range of fluctuations. The decline continued in the European session, further testing the 3360 mark, and the weakening trend was obvious. In the U.S. session, it was under pressure and fell back to break the bottom, forming a medium-sized negative line. The overall gold price showed a unilateral short rhythm. Today, focus on the important support position of 3340-3330. If it falls back and does not break, you can consider short-term long positions, but the overall trend is still dominated by rebound shorting.
The upper resistance on the 4-hour chart is concentrated in the 3365-3380 area. The intraday rebound will continue to short in this range. The main tone remains unchanged. It is recommended to follow the trend and participate in the operation. I will prompt the specific operation strategy at the bottom, so stay tuned.
The gold operation strategy is as follows: short sell when it rebounds to 3365-3380 area, with the target at 3350-3345; if it falls back to 3340-3330 area and stabilizes without breaking, consider going long, with the target at 3355-3360.

XAUUSD Analysis todayHello traders, this is a complete multiple timeframe analysis of this pair. We see could find significant trading opportunities as per analysis upon price action confirmation we may take this trade. Smash the like button if you find value in this analysis and drop a comment if you have any questions or let me know which pair to cover in my next analysis.

Gold Price Analysis August 12Gold – Testing the strength of the bullish wave structure
Today's session, gold prices are fluctuating in the Fibonacci 0.5 – 0.618 zone, raising the question: is the current uptrend still strong enough to sustain?
Previously, a strong increase from 3282 to 3406 completed wave 3. Currently, the downward pressure at the beginning of the week is considered a correction phase in wave 4.
The 3330 zone plays a "key" role in the bullish wave structure. If this level is broken, the market may end the uptrend and head towards the previous historical highs (ATH).
Trading strategy
BUY when there is a clear buying signal at 3330
BUY when the candle closes above 3357 (Fibonacci 0.618)
🎯 Target: 3383 – beyond 3431

CPI is about to be announced, 3342 life and death lineGold prices rebounded during the Asian and European trading hours on Tuesday (August 12), stalling their rebound. Spot gold briefly rose 0.4% to around $3,357/oz, but the rebound lacked momentum and has now retreated to around $3,346.82/oz, still near the previous day's one-week low. Market expectations are that the Federal Reserve will resume its rate cut cycle in September, but this expectation limits the dollar's potential for recovery, which in turn provides some support for gold, a non-interest-bearing asset.
However, gold bulls appear reluctant to make large bets, opting instead to await the latest US inflation data. This key data will provide fresh clues about the Fed's rate cut path, in turn impacting dollar demand and providing a substantial boost to gold prices. Meanwhile, the extension of the US-China trade truce and optimistic expectations for a US-Russia summit aimed at ending the war in Ukraine could pose bearish factors for gold.
Market Dynamics: Gold prices benefited from Fed rate cut bets, while US dollar demand remained subdued.
Gold prices fell sharply on Monday as easing geopolitical tensions weighed on traditional safe-haven assets. Investors are pinning high hopes on Friday's US-Russia summit, believing it will increase the likelihood of an end to the long-running Russia-Ukraine conflict. Furthermore, continued buying of the US dollar contributed to a sharp drop of approximately 1.65% in precious metals overnight.
Market participants are generally betting on a 25 basis point interest rate cut by the Federal Reserve in September, with at least two more by year-end. This expectation is bolstered by a recent string of disappointing US economic data, including the closely watched non-farm payroll report, which suggests the economy may be weakening.
However, traders are likely to refrain from making large directional bets, opting to wait and see ahead of US inflation data, which could provide further clues about the interest rate outlook.
The US Producer Price Index (PPI) will be released on Thursday, followed by US retail sales data and the Michigan Consumer Confidence Index on Friday. Furthermore, speeches by several key Federal Reserve (FOMC) officials will also influence the US dollar's short-term trajectory and provide significant support for gold prices.
On the trade front, US President Trump signed an executive order on Monday extending the US-China trade truce for three months, easing market concerns about a trade war between the world's two largest economies. Trump previously stated in a social media post that gold would not be subject to tariffs, but provided no further details.
Gold bears need to wait for a break below the key support level near $3342.
Technically, gold has successfully held the key support level of the 200-period SMA on the 4-hour chart, currently located in the $3344-3342 range. Given that oscillators on the chart are showing downward momentum, a break below this support level could drag gold towards the intermediate support level of $3315 and, subsequently, the $3300 mark. Any subsequent selling would be seen as a new trigger for short traders and pave the way for further declines in gold prices.
Conversely, a rebound above the $3358-3360 area could face strong resistance near $3380. A sustained break above this resistance level would allow gold to make another attempt to conquer the $3400 mark. A further break above last week's swing high of $3409-3410 would reverse the current bearish outlook and push gold prices towards testing the next key resistance level of $3422-3423. Upward momentum could extend to the strong horizontal resistance level of $3434-3435. A clear break above this resistance could challenge the historical peak of $3500 reached in April.
Overall, the gold market is currently caught in a tug-of-war between expectations of monetary policy easing and easing geopolitical risks, with technical indicators showing signs of consolidation and volatility. Investors are advised to closely monitor this week's inflation data and exercise caution until key levels are breached. PEPPERSTONE:XAUUSD VELOCITY:GOLD PEPPERSTONE:XAUUSD ACTIVTRADES:GOLD VANTAGE:XAUUSD CMCMARKETS:GOLD

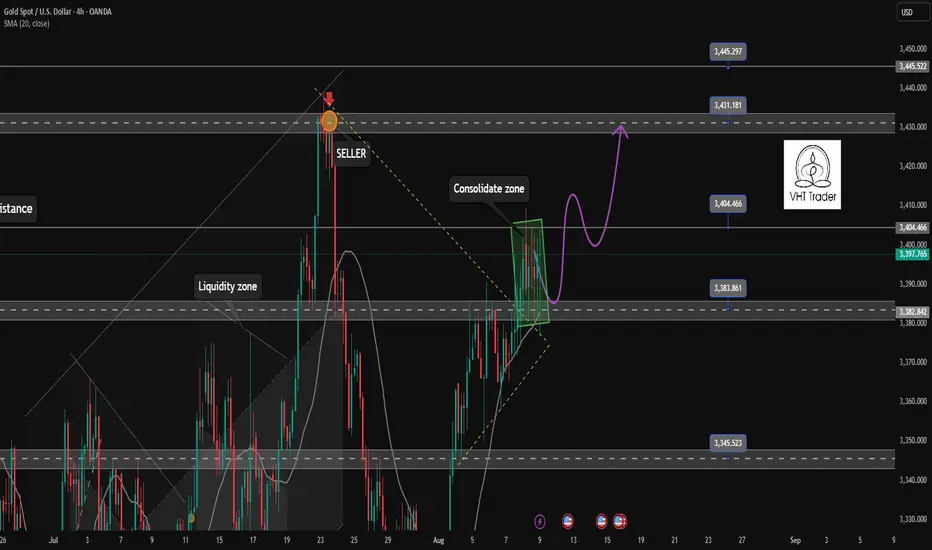
Waiting for new confirmation after 6th day of accumulation✏️Last weekend with a trading day in the accumulation range. Early this week waiting for new momentum to break the accumulation range from 3385 and 3405 to trade on the winning side. When breaking the lower range, a corrective wave will be formed and then create increasing waves to ATH. If breaking the upper range of the accumulation model, buying force can completely push the gold price to approach ATH around 3445 soon.
📉 Key Levels
Support: 3383-3345
Resistance: 3404-3431-3445
BUY Trigger: Price rejection of the candle around support 3383
BUY Trigger: Break resistance 3405
Target 3445
SELL trigger Break and trading bellow 3383
Target 3345
Leave your comments on the idea. I am happy to read your views.
EURUSD waiting for recovery to buy✏️EURUSD is still trading in an uptrend and is facing last week's top resistance at 1.170. The lower boundary of the price channel at 1.160 forms a 10-price boundary of the pair. Wait for support retests and buyers' reactions to trigger buying strategies towards the resistance at 1.181 next week
📉 Key Levels
Support: 1.159-1.145
Resistance: 1.169-1.181
BUY Trigger: Rejection of the support zone at 1.159
BUY zone 1.145 (Strong support zone)
Leave your comments on the idea. I am happy to read your views.

Reasons for gold price plunge in today's trading session 11/8Gold prices fell 1% on Monday as markets focused on upcoming talks between the United States and Russia over the Ukraine conflict, along with July data that could bring more concerns about the Federal Reserve's interest rate outlook.
Gold was trading at $3,363.31 an ounce at 0703 GMT, having hit its highest since July 23 on Friday. US gold futures for December delivery fell 2% to $3,423.10 an ounce.
"Easing geopolitical tensions over the Ukraine war sent gold prices lower, following Friday's announcement that US President Donald Trump will meet Russian President Vladimir Putin on US soil"
Meanwhile, US consumer price data is due on Tuesday, with recent tariffs expected to push the core index up 0.3%, taking the annual rate of growth to 3%, above the Federal Reserve’s 2% target.
“If inflation is high, the US dollar could strengthen and make it difficult for gold to rise. However, I think gold prices will still be supported as investors buy on dips.”
The recent weaker-than-expected US jobs report has increased expectations that the Fed will cut interest rates in September. Markets are pricing in about a 90% chance of easing in September and at least one more cut before the end of the year.

Gold Price Drops After Rally – What’s Next?Hello everyone, let's take a closer look at today's gold price
Gold has unexpectedly dropped significantly today after a notable rise early last Friday. The market's initial concerns stemmed from rumors that the U.S. would impose an import tax on gold, which caused some panic. However, after the White House officially clarified its position and assured the market, the initial worries eased
From a technical perspective, gold has broken through the upward trendline and is moving swiftly. According to Dow Theory, a short-term correction might occur soon, but if the price remains below key resistance levels, the decline could extend toward the Fibonacci 1.272 region, or even down to the Fibonacci 1.618 level if the downtrend persists.
Do you agree with this outlook? Share your thoughts in the comments below.
Good luck and happy trading!

Grasp the key opportunities in gold tradingBefore and after the European session, gold fell back and adjusted again; in the U.S. session, it stabilized and rebounded above 3340 as expected, and continuous low-long layouts achieved steady profits. From the hourly chart structure, the gold trend was highly consistent with the prediction, which not only continued the downward adjustment rhythm, but also released the profit space of rebound long orders, showing the fierce game between the long and short forces in the market.
The 1-hour moving average has begun to turn downward, significantly strengthening bearish momentum. During the US trading session, gold failed to break through the key resistance zone of 3365-3380. This area remains a key defense for bears in the short term.As long as gold fails to effectively break through and hold 3380, the bearish trend will continue to dominate the market, and rebounds will provide favorable opportunities for short positions. The continuous breaking of new lows indicates that bears have a stronger advantage, and bulls are unlikely to achieve a sustained reversal. During trading, it is recommended to strictly implement risk management, reasonably control positions, and position accordingly, seizing every rebound short opportunity. Subsequently, monitor the performance of the key support level of 3340-3330. If this support level fails, bearish momentum will further intensify. Otherwise, there will be limited room for short-term adjustments. Overall, gold is still in a bear-led, volatile downward phase. The main strategy is to short on rebounds, supplemented by buying on pullbacks, and respond flexibly to market changes.
Gold operation suggestion: short gold when it rebounds around 3365-3380, target 3350-3340. If gold falls back to 3340-3330 and stabilizes, consider going long with the target at 3355-3360.

Gold long and short two-way layout ideasI write every article hoping to connect with those I'm connected with. I hope to help investors in need. Regardless of initial impressions, I should give them a chance to understand me. I believe that the fact you've read all this is fate, and investing is largely about fate. If you believe in fate and believe I can do something for you, you might want to talk to me.
Gold has been falling steadily today. Technically, the hourly moving average is turning upwards from its highs. This suggests a potential short-term rebound for gold bulls, and they may need significant news to stimulate their decline. Otherwise, they may struggle to achieve significant gains in the short term. With this hourly decline, there's little chance of a major rebound. The key level for gold remains around 3365-3380. After all, previous support levels have become resistance levels. If your current trading isn't ideal, I hope I can help you avoid investment setbacks. Feel free to discuss your options.
From the perspective of the 4-hour cycle structure, the lower support is focused on the 3340-3330 area, which is an effective support zone that has been verified many times; the upper resistance is focused on the 3365-3380 area, which may form a key suppression level in the short term. In terms of operation ideas, we should maintain a two-way strategy of shorting on rebounds and going long on pullbacks. According to the changes in the shape and momentum of prices touching key positions, we should flexibly adjust the entry direction, specific execution points and risk control plans. I will remind you as soon as the market touches key areas, so please pay attention in time.
Gold Trading Strategy:
1. Short gold in batches when it rebounds around 3365-3380, targeting 3350-3340.
2. Go long on gold when it falls back to around 3340-3330, with the target at 3355-3360.
