Critical Resistance Ahead–Will Gold Confirm the Bullish Reversal🔶 What happened last week on Gold (XAUUSD)?
Last week was an excellent one for Gold bulls – the price surged by nearly 1500 pips, fully recovering the drop from the 12–16 May week.
Looking at the chart, the decline from the last ATH at 3500 appears clearly corrective, forming a classic ABC 3-wave pattern which now seems complete.
Gold is currently testing a major confluence resistance zone, aligned with:
• The 17 April ATH
• The end-of-April resistance
• And the early May support
Also worth noting: this week’s breakout above resistance followed the formation of an ascending triangle, which is typically bullish.
________________________________________
❓ Key question – Will the bullish move continue, or will price reject from here?
________________________________________
🔍 Why a bullish continuation is probable:
1. The ABC corrective structure seems to have ended.
2. Price broke out after an ascending triangle – a bullish signal.
3. The broader structure still leans bullish after the ATH at 3500.
________________________________________
⚠️ But this resistance zone is critical:
• Without a clear breakout above 3360 zone, bulls don’t have full control.
• A drop below 3300 would shift momentum back to the bears, with 3360 becoming a potential lower high.
________________________________________
🧭 My Trading Plan:
✅ I favor a bullish scenario, aiming for:
• 3430
• 3500 (ATH retest)
❌ This outlook gets invalidated if price falls below 3300 – in that case, I’ll reassess for more downside.
________________________________________
🚀 The market must confirm the direction. We’re just here to read the map.
Disclosure: I am part of Trade Nation's Influencer program and receive a monthly fee for using their TradingView charts in my analyses and educational articles.
Xauusdsignal

Trump's tariff measures trigger market shocks
📌 Driving events
Last Friday, as Trump threatened to raise tariffs on the European Union to 50%, and also pointed the finger at smartphone manufacturers such as Apple and Samsung, the market's risk aversion sentiment suddenly heated up, and spot gold closed up nearly 2% on the day.
On Sunday local time, US President Trump announced after a call with European Commission President von der Leyen that he would extend the deadline for the European Union to face 50% tariffs to July 9. Trump told reporters on his way back to Washington on Sunday: "We had a very pleasant call, and I agree to postpone the deadline."
Bloomberg analysis said that there are signs that US President Trump may relax his radical stance on EU trade, which will affect gold's safe-haven status.
At the geopolitical level, the conflict between Israel and Iran is imminent. The Israeli army's shooting of a diplomatic delegation has triggered international condemnation. Netanyahu has maintained a tough stance in the Israeli-Kazakh conflict; Trump's mediation of a ceasefire between Russia and Ukraine has been frustrated. The Wall Street Journal revealed that when he spoke with the European side, he said that Putin believed that the Russian army was "winning", which contradicted his public statement. This week, the market focus shifted to the Fed's policy minutes, the Bank of Japan's rate hike expectations, European and American economic data, and OPEC+'s production increase plan. The interweaving of trade frictions, debt risks and geopolitical conflicts has kept the uncertainty of the global pattern high.
📊Comment Analysis
The first support level for gold prices may be in the range of $3290-3300/ounce. If it falls below the above support, the next support for gold prices will be $3250/ounce and $3200/ounce (50-day moving average). On the upside, the first resistance for gold prices is $3370/ounce. If this obstacle is overcome, the next resistance for gold prices will be $3430/ounce and $3500/ounce (historical high).
Labaron will digest a series of economic data to be released by the United States this week, such as durable goods and home sales, as well as the consumer confidence index. The U.S. stock market will be closed on Monday due to the Memorial Day holiday.
💰Strategy Package
⭐️SET UP GOLD PRICE:
🔥SELL GOLD zone : 3388- 3390 SL 3395
TP1: $3376
TP2: $3363
TP3: $3350
🔥BUY GOLD zone: $3301- $3299 SL $3294
TP1: $3312
TP2: $3325
TP3: $3338
⭐️ Note: Labaron hopes that traders can properly manage their funds
- Choose the number of lots that matches your funds
- Profit is 4-7% of the capital account
- Stop loss is 1-3% of the capital account

Gold is in the bullish direction after correcting the supportHello Traders
In This Chart GOLD HOURLY Forex Forecast By FOREX PLANET
today Gold analysis 👆
🟢This Chart includes_ (GOLD market update)
🟢What is The Next Opportunity on GOLD Market
🟢how to Enter to the Valid Entry With Assurance Profit
This CHART is For Trader's that Want to Improve Their Technical Analysis Skills and Their Trading By Understanding How To Analyze The Market Using Multiple Timeframes and Understanding The Bigger Picture on the Charts
Trump's tariffs roiled markets; gold roseOn the U.S. trading session of May 23, Trump's tariff remarks on the EU and Apple hit the market like a storm 🌪️. He announced that a staggering 50% tariff would be imposed on EU goods starting from June 1, citing "unfair trade practices." Meanwhile, he threatened Apple with a 25% tariff if iPhones sold in the U.S. were not manufactured domestically.
This news sent gold prices soaring 🚀. As a safe-haven asset, gold surged amid investors' concerns about global economic impacts. The previously firm 3280 support level became increasingly critical in the upward trend.
If the tariff dispute remains unresolved and tensions continue between the U.S., the EU, and enterprises like Apple, the upward momentum of gold prices may persist. Analysts note that gold is likely to break through the 3500 mark 🏔️—tariffs disrupt global supply chains and raise inflation fears in the U.S., driving investors to flock to gold to hedge against economic and currency risks.
⚡️⚡️⚡️ XAUUSD ⚡️⚡️⚡️
🚀 Buy@ 3340 - 3360
🚀 TP 3400 - 3450
Accurate signals are updated every day 📈 If you encounter any problems during trading, these signals can serve as your reliable guide 🧭 Feel free to refer to them! I sincerely hope they'll be of great help to you 🌟 👇

Dangers and opportunities for gold? Trend change?In early Asian trading, spot gold fluctuated in a narrow range and is currently trading around $3,300. After rising in the first three trading days of this week, gold prices briefly hit a two-week high of $3,345 in Asian trading on Thursday, then fell sharply and finally closed around $3,294. This rapid change hides the fierce struggle between the strengthening of the US dollar, the turmoil of US bonds and geopolitical changes.
The rebound of the US dollar is the biggest pressure for the rise in gold prices.
Another major pressure on the gold market comes from the sharp fluctuations in US bond yields. The 30-year US bond yield hit a 19-month high, reflecting the market's deep concerns about the $3.8 trillion in new debt. The cold auction of $16 billion in 20-year US bonds on Wednesday further confirmed the judgment that the demand for sovereign bonds is undergoing structural changes.
The current gold market is being pulled by multiple forces. In the short term, the technical rebound of the US dollar and the selling of US bonds do pose pressure. But in-depth analysis shows that the pressure of currency depreciation brought by the $3.8 trillion fiscal expansion, the safe-haven demand caused by the damaged credit of US debt, and the risk of stagflation are three factors that are building long-term support for gold.
I think the shadow of global bond market turmoil will become a potential factor for the bullish gold market.
There are relatively few economic data during Asian trading hours. The focus should be on the annualized total number of new home sales in the United States in April after seasonal adjustment and the speeches of Federal Reserve officials, as well as news related to the geopolitical situation and the international trade situation.
I will also analyze the latest international news and its impact on gold prices for you as soon as possible.
Short-term operation strategy:
First rise: short near 3345, stop loss 3255, profit range 3280-3270.
First fall: long near 3275, stop loss 3265, profit range 3300-3310.

#XAUUSD: +2000 Pips Correction US-China Trade Deal ConfirmedGold has experienced a significant decline in recent days, primarily due to fundamental market factors that have caused its price to fall from 3430 to 3209, resulting in a loss of approximately 2210 pips. Consequently, we recommend that you consider selling Gold if it aligns with your analysis and assessment. It is imperative that you implement strict risk management measures while trading Gold.
It is important to note that this analysis does not guarantee a price decline or that the market will behave as described. Therefore, we strongly advise you to conduct thorough trade planning before making any trading decisions.
We extend our sincere gratitude for your unwavering support over the years.
Our primary objective is to assist you in making well-informed decisions. Therefore, we encourage you to contact us if you have any inquiries or require further information.
Additionally, we would be delighted to receive your insights on which cryptocurrency pair you would like to explore next. Please do not hesitate to share your preferences.
Best regards,
Team Setupsfx_

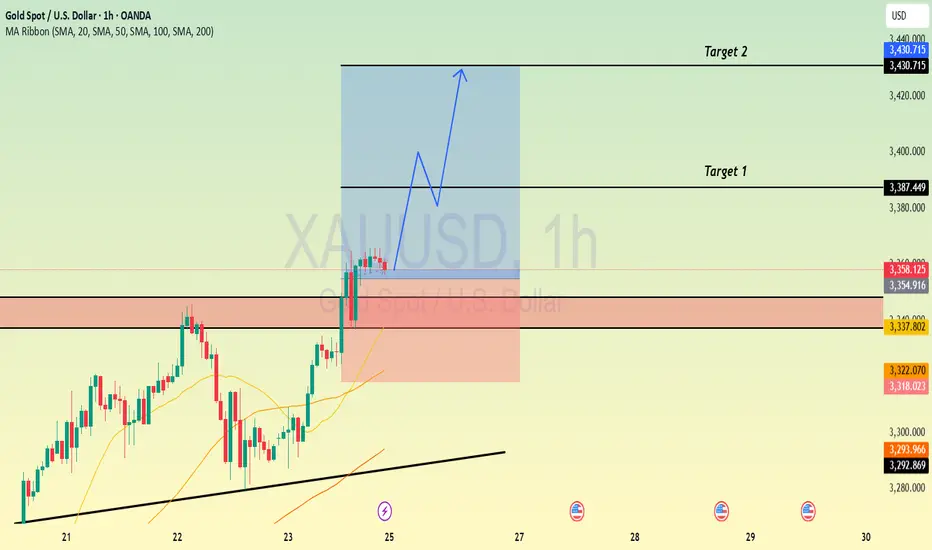
XAUUSD[GOLD]: Another Possible Swing Sell Happening! Swing MoveGold rejected twice as we had described in our last two analyses on Gold. We remain heavily bearish on Gold and expect a swift bearish move within the next week or following week. We are eyeing two targets. Please use this analysis accordingly and avoid overtrading. This is not a confirmation, and do not use the marked arrow as an entry or exit point. The marked red area drawn there represents a potential reversal zone from which price may reverse.
As always, this analysis does not guarantee that price will move as described in the chart. Please use your own knowledge and trading plan while trading Gold. Good luck and trade safely.
Want to support us? Do the following ❤️
-LIKE THE IDEA
-COMMENT YOUR VIEW
-SHARE IF YOU AGREE
Much love ❤️
Team Setupsfx_

XAUUSD[GOLD]: 1 Hour View Show Extreme Seller Volume Gold in a shorter time frame shows extreme bearish volume kicking in the market, where bulls are failing to push prices higher. Additionally, if you’re someone who analyses patterns, a HEAD AND SHOULDERS pattern has also formed. There are three targets you can aim for.
We extend our best wishes and good luck in your trading endeavours. Your unwavering support is greatly appreciated.
If you’d like to contribute, here are a few ways you can assist us:
- Like our ideas
- Comment on our ideas
- Share our ideas
Team Setupsfx_🚀❤️

Gold Analysis
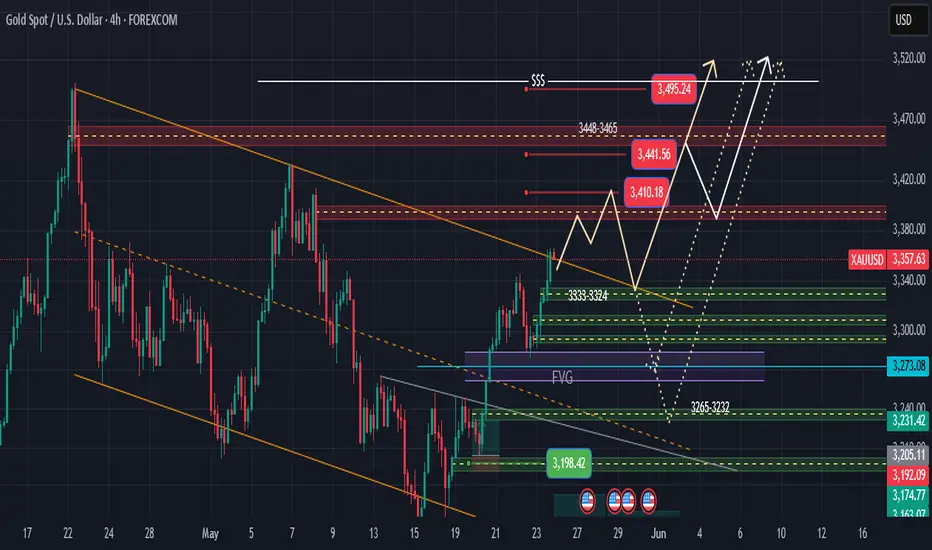
4-hour time frame - To start the market, I expect an increase to the desired resistance areas and after collecting liquidity levels, the internal structure will correct the price. I have two correction scenarios in mind, with important support points whose numbers are clear, and a buy trigger can be taken in these areas for the main market liquidity that is indicated on the chart.
Gold Heist Blueprint: "XAU/USD" Short Setup!?Greetings, wealth snatchers and market bandits! 🤑💸
Welcome to the Thief Trading Style, where we combine slick technicals and crafty fundamentals to pull off the ultimate XAU/USD heist. This is our plan to raid the "Gold" market with a short entry, targeting the high-stakes GREEN MA Zone. Expect a risky, oversold setup with consolidation and a potential trend reversal—a trap where bullish robbers get outplayed. 💪🎯 Stick to the chart, execute with precision, and treat yourself to the spoils! 🍾
Why This Trade? 💰
XAU/USD is showing a neutral trend with a bearish tilt as of 18 May 2025, driven by:
📊Technicals: Price is testing a key support zone (~3120) after a breakout from a consolidation pattern on the 30-minute chart. Oversold RSI signals a potential reversal, with the Pink MA (50-period) acting as dynamic resistance.
📰Fundamentals: Recent COT reports indicate reduced speculative long positions, hinting at weakening bullish momentum. Quantitative analysis suggests gold’s correlation with USD strength is tightening, supporting a bearish outlook.
😇Sentiment: Intermarket analysis shows rising Treasury yields pressuring gold, while market sentiment leans cautious ahead of upcoming economic data releases.
💡Data Point: Gold’s average daily range (ADR) over the past 5 days is ~35 points, aligning with our target and stop-loss levels for a day/scalp trade.
Entry 📈: Set your trap at 3120 post-breakout.
Option 1: Place sell stop orders below the support breakout level (~3115) for confirmation.
Option 2: For pullback entries, set sell limit orders near the swing low/high on a 15/30-minute timeframe.
Pro Tip: Set an alert to catch the breakout in real-time. Don’t miss the heist! 🚨
Stop Loss 🛑: Protect your loot!
Place your stop loss above the nearest swing high (~3270) on the 30-minute chart for day/scalp trades.
Adjust based on your risk tolerance, lot size, and number of orders.
Note: If using sell stop orders, wait for breakout confirmation before setting your stop. Risk is yours—play it sharp! 🔥
Target 🎯: 3000 (120-point move, aligning with ADR and support zones).
Trading Alert 🚨:
News Risk: Upcoming economic releases (e.g., CPI, FOMC minutes) could spike volatility. Avoid new trades during high-impact news and use trailing stops to lock in profits.
Position Management: Scale out at key levels (e.g., 50% at 3060) to secure gains.
Join the Heist! 💥
Hit the Boost Button to power up our robbery squad. With the Thief Trading Style, we make markets bleed profits daily. 🏆 Stay sharp, follow the plan, and let’s stack those wins! Another heist is coming soon—keep your eyes peeled. 🐱👤💰
Check fundamentals, COT reports, and intermarket trends for deeper insights.
check linkkss..🔗
Happy thieving! 🤝🚀

XAUUSD[GOLD]: Bearish Correction Is Happening! Gold rejected at 3350, dropping almost 600 pips to 3290. We can expect the price to drop further to around 3250, potentially reversing from there. A possible entry point is 3304, followed by a drop from there.
If you’d like to contribute, here are a few ways you can assist us:
- Like our ideas
- Comment on our ideas
- Share our ideas
Team Setupsfx_🚀❤️

GOLD D1 chart update for the 26-30 May weekkindly read level carefully as market on it's way to ATH but keep in mind downside some major retracements are remains pending
Right all eyes on 3330 level if market successfully sustain below 3330 then it will definitely move towards 3300 or even 3280 and then 3250
Main levels for the week 3400 \ 3250 \ 3308

Tariffs are on the rise again, gold is jumping.Information summary:
The Trump administration has once again launched a tariff war, threatening to impose a 50% tariff on the EU from June 1, and said that the negotiations between the United States and the EU have made no progress. Because the timing of this threat is quite delicate. Just earlier this week, the EU just submitted a new framework proposal to the US to restart bilateral trade negotiations. This directly led to a jump in gold.
Faced with the tough stance of the United States, the EU is not without countermeasures. It is reported that the EU has formulated a contingency plan. If the negotiations fail, it will impose additional tariffs on US exports worth 95 billion euros in response to Trump's "reciprocal" taxation and 25% tariffs on automobiles and some parts, which will inevitably cause further impact on the market.
Market analysis:
Today, the European session was under pressure at 3335 and the correction method was adopted. This correction method can better show that the price is strong, and the bulls are not willing to give the bears too many opportunities. Therefore, the layout should be aggressive. The stronger the market, the less likely it will fall back. At the same time, the correction of the strong market will definitely not break the low for the second time.
Operation strategy:
Short near 3375, stop loss at 3380, and target 3350-3340.
The price fell back to around 3335, and we will adopt a long strategy based on the downward trend.

Gold Bounces Back – Is the Road to a New ATH Open Again?📈 Gold Back Above 3300 – Is the Correction Over?
In yesterday’s analysis, I mentioned that Gold could start a correction from the strong confluence resistance zone and drop toward the 3260 area.
While price briefly dipped below 3300, it quickly reversed above that level, showing that bulls remain in control. At the time of writing, Gold is trading at 3306, and the ascending trendline from 3120 is still intact.
📌 Key Zone Holding – Bullish Structure Intact
The 3270–3280 area is now acting as a strong support, and yesterday’s price action could signal that the correction is already complete.
If Gold breaks above the 3350–3360 resistance, it would not only confirm a short-term continuation, but could also mean that the entire one-month correction from 3500 is over — opening the door for a new all-time high in the medium term.
📊 Trading Plan:
As long as 3260 holds, the bias remains bullish both in the short and medium term.
Buying dips below 3300 could be a viable strategy while targeting a break above resistance.
Disclosure: I am part of Trade Nation's Influencer program and receive a monthly fee for using their TradingView charts in my analyses and educational articles.

Gold bulls rampage! 3310 holds as "bull's hoof," targeting 3380 Currently, the overall strong bullish pattern for gold continues, with a clear and vigorous upward trend! A robust large bullish candlestick has shot up like an arrow released from a bow 🚀, rapidly pushing prices higher and breaking through all resistance with overwhelming force 💥. The moving average system shows a strong support signal – short-term moving averages can even only "chase" the footsteps of the bullish candlesticks 🏃♂️💨, highlighting how quickly the gold price is rising and how powerful the bulls are! The 3310 level below is akin to a "bullish fortress" 🔒 – short-term K-lines have tested it several times but failed to break through, and the gold price is continuing its upward attack relying on this key pivot point 💪.
On the daily chart, a bullish carnival is unfolding 🔥: Two large bullish candlesticks that have collectively pushed prices up by over 100 USD have emerged, completely engulfing the upper shadows of previous bearish candlesticks. Like a "bullish giant ship" cutting through the waves 🌊, they directly establish dominance! The moving averages have all turned upward, forming a perfect "bullish alignment" 📊, as if building an "upward staircase" for the gold price. Currently, the 3380 resistance level is clearly visible 🚦 – this level is both a previous dense trading area and a potential target endpoint for this bullish trend 🎯.
Gold Trading Strategies
sell@3360-3370
tp:3300-3310
Professional trading strategies are pushed daily 📊
Lock in precise signals amid market fluctuations 🚀
Confused about market trends? Stuck in strategy bottlenecks?
Real-time strategies serve as your "trading compass" 🌐
From trend analysis to entry/exit points, dissect market logic comprehensively
Refer now 📲
Help you move steadily forward in investments ✨
👇👇👇

Tariff threat. Gold prices rose sharply?Information summary:
Gold prices climbed in the short term during trading after Trump threatened to impose new tariffs on the European Union, as this increased market uncertainty and increased demand for safe-haven assets. Trump said in a post on Truth Social that he suggested a 50% tariff on the European Union starting June 1, and complained that trade negotiations were stalled.
After the news came out, gold prices rose rapidly, breaking the $3,345 resistance level, but did not stabilize above the $3,365 resistance level I predicted in the morning; it reached a high of around $3,360 and then fell back slightly.
I think the short-term gains have been too large, and if there is a rapid adjustment, the amplitude will also be large.
Technical analysis:
From the 4-hour chart, gold prices continue to trade above all moving averages, and the 20-day moving average has broken through the 100-day and 200-day period moving averages. At present, indicators show that the upward momentum is not very strong.
If the price breaks through the 3365 resistance level strongly, it may hit the cycle high of around 3380.
Because of the weekend, if the resistance level fails to be broken strongly, the price may adjust in the range of 3360-3330 US dollars, and a new trend needs to be found.

Gold Retests Broken Resistance – Is the PRZ Next?As I expected in the previous IDEA , Gold ( OANDA:XAUUSD ) managed to break the Resistance zone($3,280-$3,245) and touched the first target .
Gold appears to be completing a pullback to the Resistance zone($3,280-$3,245) .
On my chart , the Resistance zone($3,280-$3,245) is currently labeled Support zone($3,280-$3,245) .
I expect Gold to move towards the Potential Reversal Zone(PRZ) and Resistance lines after the pullback is completed .
Note: If Gold touches $3,243 , we should expect a drop.
Gold Analyze ( XAUUSD ), 1-hour time frame.
Be sure to follow the updated ideas.
Do not forget to put a Stop loss for your positions (For every position you want to open).
Please follow your strategy; this is just my idea, and I will gladly see your ideas in this post.
Please do not forget the ✅' like '✅ button 🙏😊 & Share it with your friends; thanks, and Trade safe.

Will gold continue to rise? Be alert on Friday.On Thursday, the US dollar rebounded after three consecutive days of decline and once returned to above the 100 mark, but failed to stand firm here. It is still maintaining at the 100 mark for consolidation. Due to the strengthening of the US dollar, gold began to retreat after hitting a high of 3345 yesterday, and once lost the 3300 US dollar mark, with the lowest reaching around 3280.
First of all, from the current 4-hour chart of gold:
In the Asian session, the lowest gold touched around 3290, and then rebounded. As of now, the highest reached around 3330. At present, 3310 should be a relatively important support position for gold. If it can be maintained above 3310, then gold may continue to rise. It can also be seen from the figure that once it continues to rise, 3345 is likely to be refreshed, and the highest should be around 3360.
From the 1-hour chart:
3280-3330 range, around 3310 is exactly the current 618 position. Therefore, if gold cannot pull back below 3310 again, it is highly likely that it will continue to reach a new high.
Secondly, as time goes by, the early low of 3290 can no longer be touched, and the current support is already near 3300. That is to say, it cannot fall below 3300 again. Once it falls below 3300, gold will refresh the low of 3280 and continue to fall.
Operation strategy:
If it can retreat to 3310 and stabilize, then we will go long at 3310.
On the contrary, if it falls below 3310, then we will focus on 3300. Once it falls below 3300, the trend will go down.
Then you can short at 3290-3300, and the profit range is around the early intensive trading area of 3260-3250.

5/23 Gold Analysis and Trading SignalsGood afternoon everyone!
Gold did not touch our key buy or sell zones yesterday, but flexible intraday range trading worked well, resulting in decent profits.
Currently, the price has reached around 3330, and from a technical standpoint, bulls remain in control. If no negative surprise hits the market, gold could target 3368 today, with a potential to test 3400 resistance next week.
🔔 On the news front, two key events during the U.S. session today deserve attention:
A speech by Fed Governor Lisa Cook on financial stability — may provide hints about the Fed’s stance.
An executive order signed by Donald Trump, which might impact markets depending on its content (e.g., taxes, tariffs, or spending).
Also, note that U.S. markets will be closed next Monday, but this is unlikely to cause major disruptions. Positions held over the weekend can still be adjusted during the Asian session on Monday.
📈 Today’s Trading Recommendations:
📉 Sell near 3382–3398 (Resistance zone)
📈 Buy near 3274–3256 (Support zone)
🔁 Flexible trading levels:
3285 / 3296 / 3307 / 3316 / 3328 / 3337 / 3346 / 3361 / 3373

How will the price of gold go? Prospect analysis is here.In the Asian session, spot gold rebounded modestly after a sharp drop in the previous trading day, and the price of gold is currently around $3,330.
Gold prices lost some upside momentum on Thursday, but downside remains limited. Gold prices suffered a correction on Thursday, ending the previous three consecutive trading days of gains, mainly due to the rebound of the US dollar and traders taking profits after the price of gold hit a two-week high. Spot gold closed down $20.14, or 0.61%, at $3,294.81 per ounce on Thursday.
We see gold encountering some profit-taking selling pressure after its recent gains, while a stronger U.S. dollar index is another bearish factor. However, affected by the turmoil in the global bond market, the gold market continues to be bullish and the decline is limited.
Short-term technical analysis:
Looking at the gold daily chart, the high point of gold prices on Thursday moved up from the previous trading day, while the low point moved down. Buyers continue to defend on the downside near the flat SMA 20-day, which provides support near $3,288.00. The 100-day and 200-day moving averages continue to move upwards at levels well below current gold prices, consistent with the dominant bullish trend. Finally, technical indicators have lost bullish power but are flat within positive levels, limiting the possibility of further declines.
Looking at the 4-hour chart, there is no sign that gold will fall further. Gold prices continue to trade above all its moving averages, with the 20-period SMA crossing above the directionless 100-period SMA and 200-period SMA. Meanwhile, technical indicators are moving lower, but with limited downside power, they remain above their midlines.
Short-term focus on important support and resistance levels:
Support: $3,290; $3,270; $3,250.
Resistance: $3,325; $3,345; $3,360.
I hope my analysis can help you make profits easily in the trading market.

XAUUSDToday, the follower executed accurate signals in the band trading center and made a profit. The current news is relatively stable. The technical side continues to pursue long orders.
Combined with SMA, there is a support position below 3300-3290. The retracement range is 1%. It is currently in perfect agreement with the expected value.
The current price is 3312. At present, we need to wait for the market to digest some negative factors before looking for opportunities to buy. Below 3310 is a good buying position. Above 3345 is a pressure position that needs to be paid attention to in the short term. If it breaks through, you need to pay attention to whether the position of 3350-3360 can break through stably before considering buying.
Do not trade independently during the trading process. To avoid any losses. If you don’t know how to trade, remember to pay attention to the buying and selling suggestions of the band trading center.

PMI Boosts USD but Caution Lingers Ahead of Fed DecisionOANDA:XAUUSD TVC:GOLD The recent release of stronger-than-expected S&P Global PMIs in the U.S. has offered short-term support to the dollar, pressuring gold from intraday highs. Manufacturing and services PMIs both improved to 52.3 in May, fueling speculation that the U.S. economy may still be resilient despite persistent concerns over Trump's proposed tax reforms and renewed tariffs.
Still, market sentiment remains cautious. While Wall Street recovered slightly, it continues to post weekly losses. Investors are balancing upbeat data with longer-term risks — including a potential economic slowdown triggered by aggressive fiscal tightening and global demand headwinds.
With the FOMC meeting approaching (June 17–18), gold traders are likely to remain reactive to macroeconomic signals. Any dovish shift or mention of a potential rate cut timeline could reignite demand for non-yielding assets like gold. Until then, price action around the $3,289 support and the Quasimodo pattern will be crucial for short-term direction.
Resistance : $3,319 , $3,343
Support : $3,289 , $3,239

Gold starts to go down? Double opportunities.Analysis of Asian market trend:
To summarize the short-term trend, "continue to step back and continue to seek key support". Gold rose and then fell in the Asian market yesterday, and the final rebound stopped at 3350. The trend is in line with our short-term bearish expectations. As for the market falling and breaking, it is a normal market. This means that the adjustment needs to continue. Today, the main focus below is still the support level of 3280. The early decline has approached this point, but it has not been completely touched; if this position is not broken, the bullish rebound is still there and it will rise at any time.
Operation adjustment, mainly low and high, supplemented by high and low, look at the shock sideways, wait for the market to break through the range and gradually look down; then the two main points of short-term focus, if the downward trend does not break 3280, then the rebound will first look at the high point of 3320. Strong breakthrough and stabilization at this position, if it does not break through yesterday's high point, it will continue to be mainly shocking; at the same time, unlike the previous consecutive rises in the past few weeks, this week's trend is slightly weak, and it is almost the weekend, so let's look at the amplitude of the range trend first.
Operation strategy:
Short around 3320, stop loss at 3328, target at 3290;
Long around 3280, stop loss at 3270, target at 3315.
Short-term trading is temporarily operated in this range, and a new layout will be made if it breaks.

Gold Hits 3360 Resistance After Breakout – Reversal Ahead?📈 Gold Breaks Out – Now Approaching Key Resistance
Two days ago, I highlighted the ascending triangle forming on Gold and warned that a breakout could lead to strong acceleration in the direction of the move.
As expected, price broke to the upside and rallied 1,000 pips, confirming the bullish breakout.
🧱 B ut now, Gold faces a major test...
Price is now approaching a critical confluence resistance zone around 3360, where I expect a possible reversal.
Given the recent pattern of strong two-way volatility, a pullback from here could send Gold back down to retest the broken 3250 zone — now acting as support.
📊 Trading Plan:
I’m watching closely for signs of weakness near 3360 to open short trades. This level is key for both bulls and bears, and price action here could define the next move.
Disclosure: I am part of Trade Nation's Influencer program and receive a monthly fee for using their TradingView charts in my analyses and educational articles.
