GOLD Short From Falling Resistance!
HI,Traders !
#GOLD is rising and will soon reach a falling
Resistance line. After retesting it, we expect
a decline and a move down toward the target!
Comment and subscribe to help us grow !
Xauusdtrade

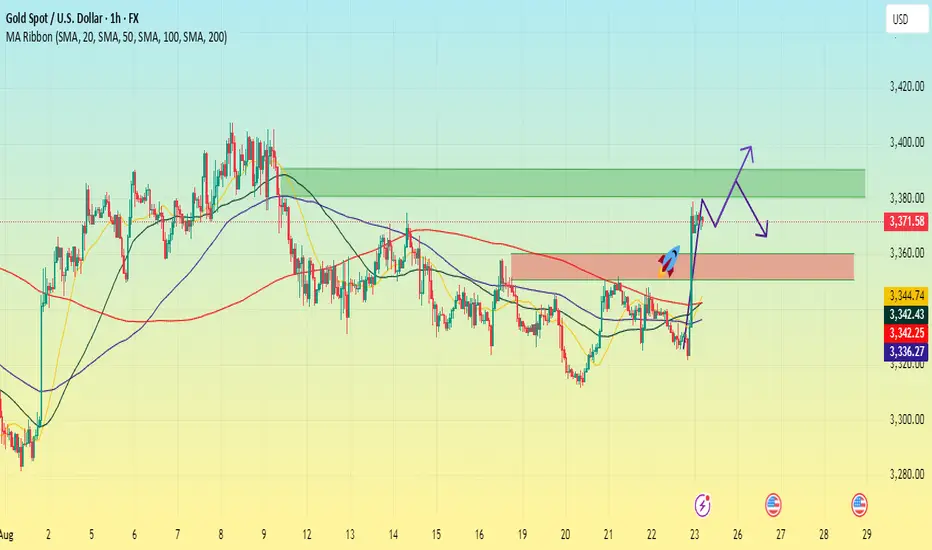
Trend reversal? Continued upward movement next week?On Friday, gold fluctuated weakly downward, hitting a low of 3321. However, during Powell's speech, prices surged, breaking through the previous resistance level of 3350-3360. The price reached a high of around 3378 before retreating to around 3371, a gain of 57 points. This strong breakout has given the market a clearer trend, transforming all previous resistance levels into support levels, further allowing bulls to exert their remaining momentum. The trend has also broken through the resistance of the short-term moving average, which overall suggests significant positive news for bulls.
However, Powell's speech did not reveal any interest rate cuts, and most traders believe that the lack of a clear indication of no rate cuts suggests a possibility. This view has yet to be confirmed. I believe a short-term wait-and-see approach is recommended for the Asian market opening next week to see how the market digests the impact of the speech.
Currently, support is focused around 3350-3360, while resistance is focused around 3380-3390.
Next Monday, we will focus on the continued strength of the upward trend. If gold retreats but fails to rebound, especially if it fails to maintain its upward momentum during the European and American trading sessions, a potential weakening trend cannot be ruled out. The specific situation will depend on how the market processes this event.
The weekend is here, I wish you all a happy weekend. See you next week.
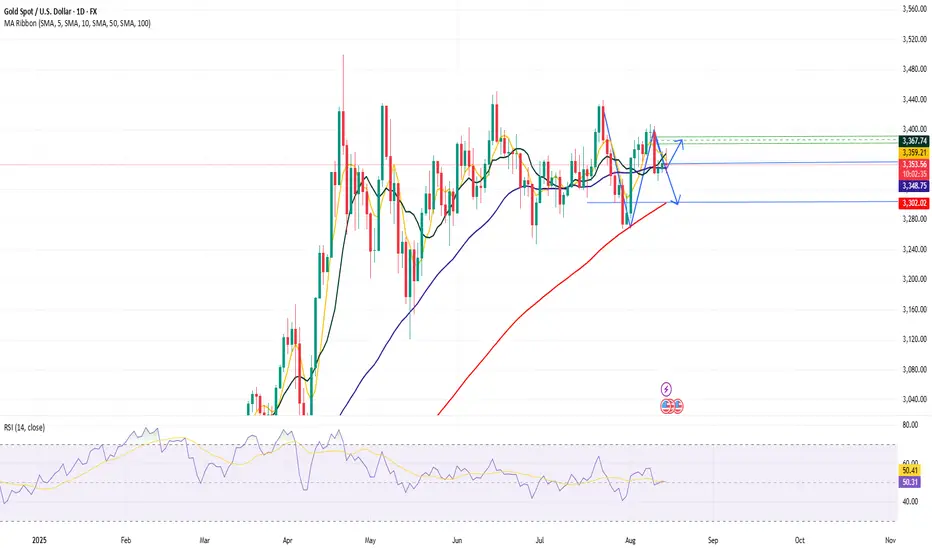
Is a rate cut confirmed? Next week's trend.Friday's US trading saw a bullish rebound. This week's persistent weakness finally ended during Powell's speech. Gold surged to a high of 3378 before closing around 3371.
From the daily chart, gold is currently converging within a triangle pattern, with prices firmly above the middle Bollinger Band, and the RSI trading above the central axis. Technical indicators suggest that gold still has ample upward momentum.
From panel 1, Friday's sharp rise in US trading recouped all of this week's losses, and the moving averages have now perfectly shifted to an upward trend. Although there was a slight pullback after reaching a high near 3378, prices remained volatile at this week's close.
It's undeniable that gold currently has untapped upward momentum, but how this energy is released remains a key concern. If Monday's Asian session continues its upward trend from Friday, a technical correction is highly likely in the US and European markets. Similarly, if the price starts to slowly pull back when the Asian market opens, we need to pay attention to whether this trend will continue. If the rebound is weak after the pullback, then the impact of Powell's speech on the market trend has been fully released, and gold needs to wait for new catalysts to form a new trend.

Gold is sideways. Will it fall under pressure?After sideways trading in the Asian morning on Wednesday, gold began to gain momentum in the European session. It broke out in the US market, reaching a high near 3352, completely erasing the previous day's losses and ushering in another turning point for bulls and bears. Things are often unexpected, and so are the markets.
Amidst a series of negative factors, bulls staged a comeback on Wednesday, refreshing Wednesday's market outlook and casting the market into renewed confusion. At present, the upper pressure is still maintained in the 3350-3360 range, while the lower support continues to be maintained around 3330. Wednesday's bullish rebound has once again left the market shrouded in uncertainty. Whether this is a bullish reversal or a bearish rebound remains uncertain, so we can only continue to try to trade within the range. In the short term, it is likely to remain in a range between 3360 and 3330, awaiting a potential breakthrough later in the day.
Trading strategy:
Go long near 3330, stop loss at 3320, profit range 3345-3355.

Gold is rising slowly. Should we trade within a range?Gold hit the strong resistance of 3350 on Wednesday and then fluctuated at a high level. The slow rise on Wednesday broke the fixed trend of the previous few days, that is, the trend of rising first and then falling. So under the current trend, will there be any different changes today? A surge and then a fall cannot be ruled out on the hourly chart, but for now, the overall trend remains within a range, with upper resistance remaining within the 3350-3360 range seen at the beginning of the week.
Gold's short-term support remains near 3330, the second rally point on Wednesday. With no new events impacting gold's trend in the short term, trading within this range is recommended. Market fluctuations have been irregular these past few days, and aggressive trading can easily lead to losses. Most of the time, it's best to adapt to market conditions.
Trading strategy:
Go long near 3330, stop loss at 3320, profit range 3350-3360.
Short sell near 3355, stop loss at 3365, profit range is 3340-3330.

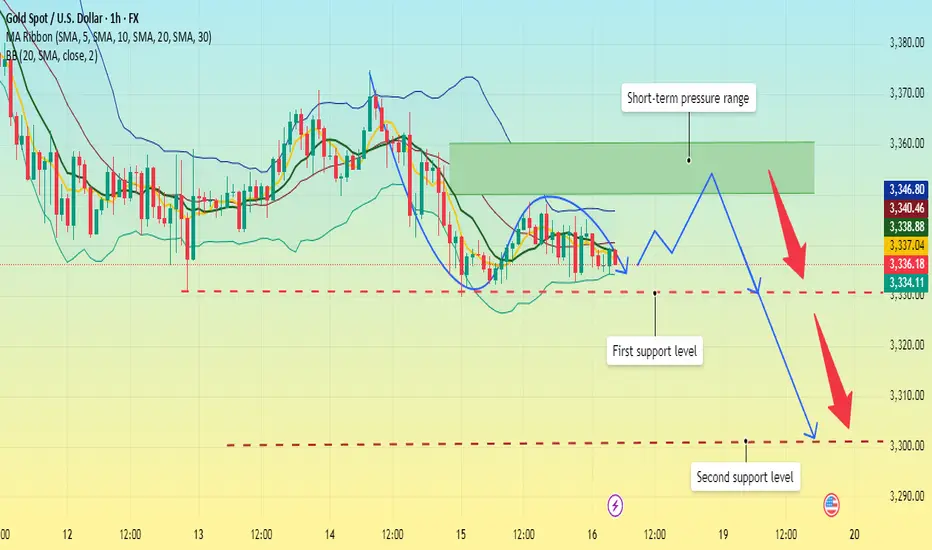
8/19: Watch Support at 3328-3323 and Look for Buying OpportunitiGood evening, everyone!
Gold remains range-bound between 3323–3348. On the 30M chart, the key resistance is clustered at 3337–3343, while support stays at 3328–3323.
On the 2H chart, the structure remains suppressed, but the bullish divergence on indicators hasn’t been fully corrected yet. Two possible scenarios may unfold:
1️⃣ Price breaks below 3323 first, triggering a stronger rebound;
2️⃣ Support holds, leading to an immediate push higher toward the 3348–3352–3358 resistance zone.
Either way, the medium-term bias favors the upside.
Trading strategy: prioritize buying on dips, selling on highs as secondary.
⚠️ Note: If your account is under pressure, it’s safer to wait for clearer signals rather than rushing in. For detailed guidance, feel free to reach out.

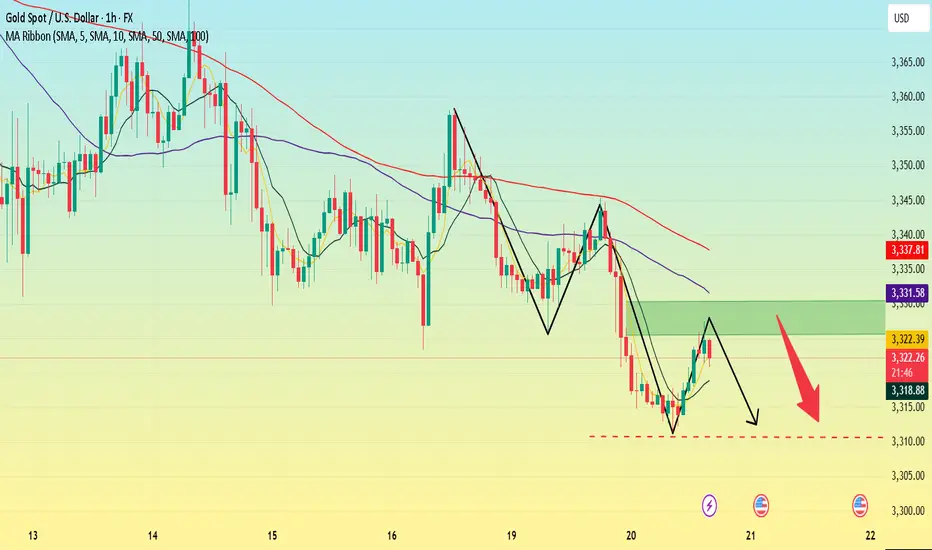
The downtrend hasn't bottomed out. Will it follow the breakout?Gold experienced a breakout on Tuesday, rebounding to a peak near 3345 before retreating under pressure. It fell to 3314 in the US session before stalling, a 41-point drop.
Overall, while the decline isn't significant, key support levels have been broken one after another, suggesting the possibility of continued breakdowns and further downside potential. The 1-hour chart also shows a relatively strong bearish trend. The slight rebound in the early Asian session could well trigger a short-term correction. Support has also shifted down to the 3300 mark, a key resistance level for a top-to-bottom reversal.
At present, the main upward pressure remains near the previous support level of 3325-3330. If the price rebounds near this position today, you can still choose to short and wait. The first target below is 3310. If the resistance in the European session is strong, then it may be necessary to adjust the short selling point. Judging from the current market situation, the bears are in a strong advantage.
Trading strategy:
Short around 3325-3330, stop loss at 3340, profit range 3310-3300.
If you're looking for a safe trade, wait for the price to stabilize above 3330 before implementing a short position strategy.
Volatility gathering momentum. A downward trend?Information Summary:
On Tuesday, the White House was finalizing the location for the Russia-Ukraine summit. As traders began betting on a possible end to the conflict, gold prices fell, hitting a new low of 3314.8, a drop of 0.51%. On Thursday, investors focused on the Federal Reserve meeting minutes, which could be a catalyst for a turnaround in gold's performance.
Market Analysis:
On Tuesday, gold rebounded slightly in the Asian session, but faced resistance at the 3345 level before retreating and fluctuating downward. The downward trend continued in the European session, with the market even breaking through the key support level of 3320, completely opening up short-term downside potential. This week has emphasized gold's weakness, and the current trend is in line with my expectations.
From the 4-hour chart, upward resistance is expected around 3330-3335. We will continue to short on a rebound to this level today, waiting for a pullback. The short-term dividing line is around 3345. If the daily chart fails to break through and stabilize above this level, we will maintain our strategy of shorting on rebounds.
Trading Strategy:
Short at 3330-3335, add to your position when it rebounds to 3340-3345, stop loss at 3350, profit range 3320-3310-3300. If it falls below 3300, hold a small position and wait for a new low.

Gold (XAU/USD) 4H- 20th August 2025Gold continues to trade in a bearish transitional phase after extended bullish movement. Current structure shows price reacting from premium supply zones, with liquidity resting below prior lows. This suggests short setups remain favorable, while discount levels could still attract buyers if deeper pullbacks occur.
✅ Primary Trading Levels
Primary Buy Zone – $3280 to $3288
Gold has a fresh 4H demand block aligning with a discount zone and liquidity resting under recent equal lows. A rejection here could fuel a rebound back into $3338 and potentially $3350.
Stop Loss: Below $3270
Targets: $3338 → $3350
Primary Sell Zone – $3346 to $3354
This area sits in premium territory, overlapping with a refined supply block and an unfilled imbalance. Liquidity above equal highs at $3355 makes this the most attractive level for sellers.
Stop Loss: Above $3364
Targets: $3305 → $3288
⚠️ Fallback Levels
Fallback Buy Zone: $3252 – $3260 → Targeting $3305 / $3332
Fallback Sell Zone: $3372 – $3380 → Targeting $3330 / $3305
🏆 Golden Zone of the Day
Sell Zone $3346 – $3354 is the highest-probability, institution-grade level for today. This zone aligns with liquidity above equal highs and offers the best risk-reward for shorts into downside targets.
📌 Trading Plan
Focus on short setups near $3346 – $3354
Look for confirmation: wick rejection or displacement within the zone
Manage risk tightly around liquidity shelves
📢 Conclusion:
Gold is offering a clean sell-side opportunity from premium levels, with downside targets into $3305 and $3288. Buyers may only regain control if $3280 holds firmly. For now, sellers have the upper hand.

Gold's rebound is weak. Will it continue to fall?Gold prices were stable in early Asian trading on Wednesday, currently fluctuating around 3315. Gold prices experienced a surge and then decline in both of the first two trading days of this week, but the upward momentum was insufficient, preventing it from breaking through the upward pressure. This decline was driven by the combined influence of a stronger US dollar, geopolitical uncertainty, and expectations for Federal Reserve policy.
Gold prices fluctuated downward, breaking through the weekly low to set a new low. The daily chart shows a bearish trend, with the moving averages forming a downward crossover, and the Bollinger Bands opening downward in the short term.
From the 4-hour chart, the upper short-term resistance has moved downward and is currently around 3330-3335. The lower support is around 3300. The overall main tone of high-altitude participation is maintained.
Gold's 1-hour moving average is also continuing its bearish divergence, indicating that bears still have downward momentum in gold, and the rebound is beginning to weaken. If the Asian market rebound fails to break above 3330, it will be extremely weak, and any small rebound in gold will continue to be dominated by bears.
Trading Strategy:
Long around 3290, stop loss at 3280, profit range 3320-3340;
Short around 3330, stop loss at 3340, profit range 3300-3280;
Key Points:
First Support Level: 3300, Second Support Level: 3295, Third Support Level: 3285
First Resistance Level: 3325, Second Resistance Level: 3330, Third Resistance Level: 3340

The bulls are powerless. Continued decline?Gold hit a low near 3326 in early Asian trading. Despite repeated downward pressure to build upward momentum, it hasn't broken through. Bullish attacks have been fruitless, and the pressure from the highs has shifted downward. While it has once again bottomed out and rebounded, it still hasn't broken through the upward pressure zone. The current resistance level is around 3345, the site of Monday's rapid decline, which also represents a previous top-bottom reversal.
Analysis of the 1-hour chart shows that gold prices have fallen to the key support level of 3330-3320. The moving averages are crossing downward, with upper resistance at 3345 near the MA100. A breakout could see the second resistance level of 3350-3360. The current range is oscillating between 3320-3360. We recommend caution in chasing orders within this range and patiently wait for key entry points.
Trading strategy:
Short around 3350, cover shorts at 3360, set a stop-loss at 3370, and profit range between 3330-3320. Below this level, target 3300.
If gold falls below 3320, try a light long position around 3315, with profit range between 3340-3350.

Peace Signal. A New Trend?Event Summary:
On Monday, US time, after several hours of talks with Ukrainian President Volodymyr Zelensky and other European leaders, Trump contacted Putin, attempting to organize a trilateral meeting to end the Russia-Ukraine conflict.
Trump stated that after the meeting, he spoke with Putin and began arranging a meeting between Putin and Zelensky, the location of which is yet to be determined. The US hopes to facilitate a meeting between Putin and Zelensky before the end of August.
This Friday, Powell will speak at the Jackson Hole Fed annual meeting. Such events are most likely to trigger new market fluctuations. Therefore, gold is likely to be bearish before the annual meeting.
Market Analysis:
After falling below 3355 in Asian trading on Monday, gold has so far experienced multiple pullbacks to build momentum towards the 3350-3360 resistance range, but has been unable to break through and maintain its position. It has repeatedly fallen under downward pressure and continued to create new lows.
Looking at the 1-hour chart, gold has been trading below the middle Bollinger Band in the short term, with the RSI indicator below the mid-axis, indicating a relatively flat trend. Gold is still in a weak market.
Trading Strategy:
Short around 3345-3350, with a stop-loss at 3360. Profit range: 3330-3320.
Long around 3315, with a stop-loss at 3305. Profit range: 3340-3350-3360.

Gold prices fluctuated downward. Waiting for a breakout?Spot gold is currently trading around 3332 in Tuesday's Asian session. Concerns about the situation between Russia and Ukraine led to a brief rebound to around 3358. However, growing expectations of peace have directly dampened gold's safe-haven demand, leading to the price reversal of all gains.
On the 4-hour chart, the 5- and 10-day moving averages are trending downward. Gold prices remained below the middle Bollinger Band during Tuesday's Asian session. A short-term upward trend followed by a decline has formed, maintaining trading within the lower and middle Bollinger Bands.
Recent price action has formed a clear triangle consolidation range, which has persisted for a significant period, seemingly accumulating momentum for a subsequent major rally. Upper resistance remains stable around 3350-3360, while lower support lies in the 3330-3320 range.
On the whole, if the gold price can break through 3360 and stabilize above this position, it is likely to start a rebound and give the market hope of an upward trend; on the contrary, if it falls below 3320 US dollars, the short-selling force may be further released, accelerating the price decline, and market sentiment will also be affected.

Gold is under pressure. Bearish theme?Gold experienced a sharp drop in the early Asian session on Monday, hitting a low of 3323 before rebounding slightly. It reached a high of around 3358 in the European session and began to retreat under pressure. I also gave a short-selling strategy based on the views of the early Asian session. Currently, gold continues to fluctuate around the 3330 support level, and a breakout of 3330 is only a matter of time.
Judging from the 1-hour chart, the first upper pressure position is still at 3350-3360. The price has failed to break through this position despite repeated shocks and is under downward pressure at this position. The current support is still focused on the neckline near 3330. The overall main tone of high-altitude participation remains unchanged. In the middle position, please be cautious and wait patiently for key points to enter the market.
Trading strategy:
Short around 3355, and cover shorts on a rebound to 3365-3375. Stop-loss at 3385. Profit range: 3330-3320-3310.

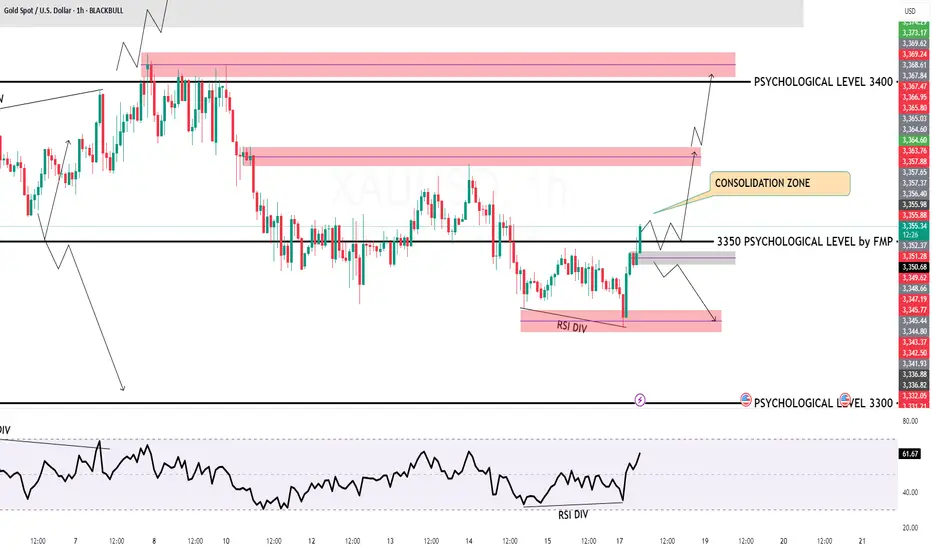
GOLD H1 Intraday Chart Update For 18 AUG 2025Good Morning Traders
as you can see that GOLD successfully break 3350 Psychological for Shorter term scenario
All eyes on 3330 level breakout for the day if market breaks 3330 level then it will move towards 3310 level otherwise market will move towards 3380 level soon
Disclaimer: Forex is RISKY
Has gold bottomed out? A strong upward trend?Last Friday, gold prices fluctuated and consolidated below 3350, remaining range-bound near 3340 at the close of the US session. On Monday morning, gold prices quickly retreated to test support near 3325. The hourly chart then rebounded, breaking through and stabilizing above 3345, forming a V-shaped rebound. Looking at the 1-hour chart, gold prices rebounded quickly after falling in the early Asian session, and the moving average system continued to cross upward, indicating that there is upward momentum in the short term; however, after the current price broke through the suppression position of 3350, it continued to fluctuate at this position. If the price cannot break through the range of 3350-3360 for a long time, then there is a high probability that it will technically retreat and accumulate momentum to impact upward again. In the short term, focus on the upward resistance level of 3350-3360, with support near 3330.
Trading strategy:
Short around 3355-3360, stop loss at 3370, profit range 3330-3320-3310.
Long around 3320, stop loss at 3310, profit range 3340-3350-3360.

Next Week's Analysis: Will the Price Continue to Fall?Gold has been trending downward throughout this week. While it has generally remained within a broad range, with minor rebounds at lows, there's still a chance it will continue its decline and find strong support. The current strong support level is 3330, and the second support level is around 3300. The upper pressure is maintained at 3350-3360. After touching this position on Friday, it was under pressure again.
From the 1-hour chart, the moving averages are currently crossing downward, and this trend is likely to continue. After hitting a high near 3375 on Thursday, the price has been fluctuating downward, trading mostly below the middle Bollinger Band. Although it rebounded slightly after hitting a low at 3329, it failed to break through the resistance level of 3350, and after coming under pressure there, it has continued its downward trend. Overall, gold bears still have momentum, and there are currently no signs of a reversal.
Therefore, we can continue our bearish trend position at the beginning of next week.
The Asian gold market is about to open. Good luck to all traders.
GOLD RAID ON – Bullish Limit Orders Are LIVE! XAU/USD💰GOLD HEIST IN PROGRESS! XAU/USD BULLISH RAID BEGINS! 🏴☠️📈
Asset: XAU/USD – Gold vs U.S Dollar
📊 Plan: BULLISH ROBBERY
🎯 Target: 3460.00
🛑 Stop Loss: 3330.00
📥 Entry: ANY level – vault is wide open!
👑 THIEF MODE ACTIVATED – Time to raid GOLD like a pro. We’re stacking multiple limit orders (layering entries) just like setting traps for those greedy bears 🐻💥
🚪💼 Entry strategy:
“The vault is unlocked – grab your bag and go!”
Place buy limits at recent swing lows (15m/30m) or jump in live with your bullish crew. Use alerts to catch price at key pullback zones.
🛑 SL placed at: 3330 – Just below thief territory. Adjust based on your lot size + number of entries 🔐
🎯 Target: 3460 – Hit and run, or trail that SL and let the gold rain! ☔💸
🧠 Thief Tactics for GOLD:
Only trade Long-side – scalpers, swing traders, all aboard 🚂
Use trailing SL to protect your loot
Avoid trading during high-impact news (CPI, NFP, Fed, etc) ⚠️
Stay alert for manipulations + fake-outs at key levels – it's a trap game out here 🎭
📰 Before the Heist:
🧾 Read Fundamentals • COT Report • Sentiment • Macro Outlook
📌 Always stay updated, news can flip the market faster than a backstab 🗡️
🗣️ Boost this idea if you’re robbing with us!
💥 Smash that LIKE if you believe in the heist
🚨 Follow for more high-voltage thief trades
💎 Daily playbooks. Clean getaways. All signals, no noise.
Join the crew. Trade like a THIEF. Get rich or get smarter.
🕵️♂️💰🚀🔥🐱👤📈

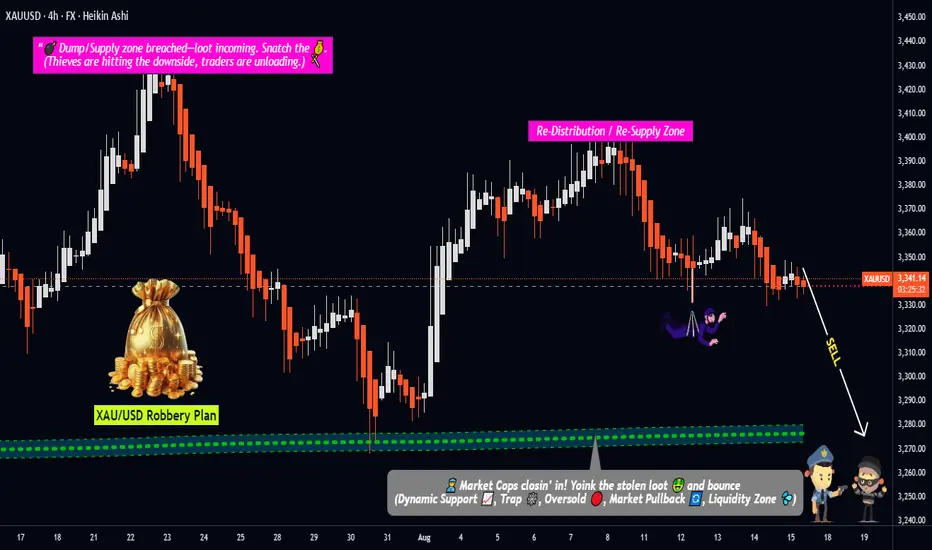
Gold Under Attack! Thief Trader’s Layered Sell Plan in Action!💣 XAU/USD GOLD HEIST: Police Waiting at 3270 – Escape Before They Catch Us! 🔐💰
🕵️♂️ Hello Thief OG’s, Money Grabbers & Market Shadows!
Today’s mission is Gold (XAU/USD) – not to wear, but to steal! 💸✨
🎯 MISSION BRIEF
We’re going BEARISH on Gold. No single-shot nonsense – we’re using layered SELL LIMIT traps to grab the loot piece by piece.
💼 Entry Layers:
3340.00
3350.00
3360.00
(💡 Add more layers if you want to go full gang mode.)
🛑 Stop Loss – The Alarm Trigger
SL @ 3380.00 🚨
But hey… Thief OG’s adjust it to your own strategy & risk. Don’t get caught with your mask off. 😎
💰 Target – The Escape Plan
Main Target: 3270.00 (Police barricade 🚔)
Quick Exit: 3280.00 (Escape van is ready 🚐)
📊 Why This Is the Perfect Hit
Price dancing near resistance – the “vault door” is open.
Weak bullish attempts = fake gold rush trap.
Trend sniffers pointing down on higher timeframes.
Market makers guarding at 3380 = the alarm system.
📜 Thief Trader Rules for This Mission
Avoid entering during major economic news bombs 💣.
Trail your SL once price moves in your favor – thieves who overstay get caught.
Always rob smart – we’re professionals, not gamblers.
💥 Support the Robberhood Crew!
Boost this idea if you want more Thief Trader missions.
Every boost = more ammo for the next market robbery.
Remember: No chase, no case. 🕶️💼💣
#XAUUSD #GoldTrade #BearishPlan #LayeringStrategy #ThiefTrader #RobTheMarket #BoostForMore
Gold is weak. Continue to decline?Last week, gold prices fluctuated upward, but Monday's sharp drop wiped out all the gains, sparking market concerns about further downside. Subsequently, Tuesday and Wednesday saw a fluctuating rise, with small gains closing in on the day. The rebound was relatively limited, failing to form a valid reversal signal, and can be seen as a correction of Monday's decline. Thursday's breakout and subsequent decline became a key turning point, with the daily candlestick chart directly swallowing up the gains from Tuesday and Wednesday. In technical analysis, this pattern often signals the end of the previous rebound and the re-establishment of market control by bears.
In terms of indicators, the 5-day moving average is extending downward, signaling a short-term downward trend and a suppressive effect on prices. Meanwhile, the 10-day moving average is also showing signs of downward movement, suggesting a gradual divergence in the medium-term trend toward the bears, with the moving average system showing a bearish alignment.
On the final trading day of this week, upward pressure will focus on the 3350 level, followed by the 3360 level, the high point where Thursday's European session rebound was stalled and the decline continued. Focus on support around 3320-3310 below.
Trading strategy:
Short around 3355, stop loss at 3365, profit range 3330-3320-3300
Long around 3315, stop loss at 3300, profit range 3330-3350.

Be cautious when trading. Will data trigger a market ripple?Information Summary:
Currently, most gold traders are awaiting US Producer Price Index (PPI) and Initial Jobless Claims data for renewed trading incentives. US Treasury Secretary Bensont issued his clearest call yet for the Federal Reserve to begin a cycle of rate cuts, stating that the Fed's benchmark rate should be at least 1.5 percentage points lower than it is now.
According to the Fed Interest Rate Watch Tool, market expectations for a rate cut at the Fed's September 17 meeting continue to rise, with traders betting on a 25 basis point probability of a cut to 99%, a significant increase from 91.4% the previous day.
Meanwhile, the probability of a 50 basis point rate cut in September has also risen to 1.4%, from almost zero previously.
Market Analysis:
The relative strength index remains above its midline, favoring a bullish outlook for gold on the daily chart.
Quaid believes that gold prices need to break through the static resistance level near 3380 to unlock additional upside potential and launch an attack on the 3400 round-figure mark. The 5-day and 10-day moving averages formed a death cross, indicating a directionless market movement, suggesting that pending the release of the data, the market will maintain minimal volatility, awaiting a new trend. The current resistance level of 3380-3390 will be tested.
On the downside, the 50-day moving average (SMA) currently around 3350 provides short-term support. A break below this level would prompt sellers to target the 100-day moving average around 3302.
Quid believes that if the US data is mild, the market reaction is likely to be limited, as traders turn their attention to Friday's meeting between US President Trump and Russian President Putin in Alaska on the Ukraine peace agreement.
Market Analysis: Gold Pulls BackMarket Analysis: Gold Pulls Back
Gold price started a fresh decline below $3,380.
Important Takeaways for Gold Price Analysis Today
- Gold price climbed higher toward the $3,410 zone before there was a sharp decline against the US Dollar.
- A key bearish trend line is forming with resistance near $3,355 on the hourly chart of gold.
Gold Price Technical Analysis
On the hourly chart of Gold at FXOpen, the price climbed above the $3,380 resistance. The price even spiked above $3,400 before the bears appeared.
A high was formed near $3,409 before there was a fresh decline. There was a move below the $3,380 pivot level. The bears even pushed the price below the $3,350 support and the 50-hour simple moving average.
It tested the $3,330 zone. A low has formed near $3,331 and the price is now consolidating losses near the 23.6% Fib retracement level of the downward move from the $3,409 swing high to the $3,331 low.
Immediate resistance on the upside is near a bearish trend line at $3,355 and the 50-hour simple moving average. The next major hurdle is near the 50% Fib retracement level.
The main barrier for the bulls could be near the $3,380 level, above which the price could test the $3,400 zone. Any more gains might call for a move toward $3,410. An upside break above $3,410 could send Gold price toward $3,425.
Initial support on the downside is near $3,330. The next key level is $3,320. If there is a downside break below $3,320, the price might decline further. In the stated case, the price might drop toward the $3,300 zone.
This article represents the opinion of the Companies operating under the FXOpen brand only. It is not to be construed as an offer, solicitation, or recommendation with respect to products and services provided by the Companies operating under the FXOpen brand, nor is it to be considered financial advice.

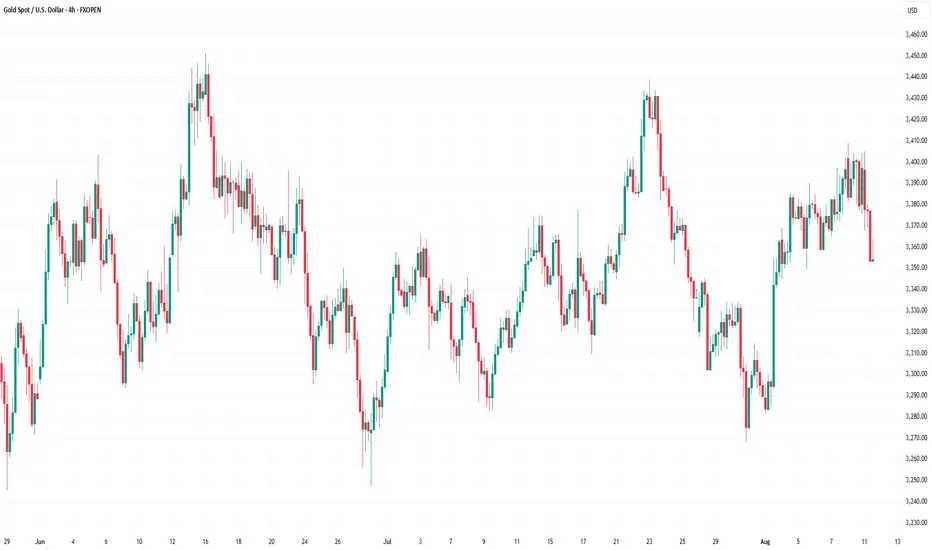
Gold Price Declines Amid Easing Geopolitical TensionsGold Price Declines Amid Easing Geopolitical Tensions
It has been announced that a meeting between the Presidents of the United States and Russia will take place this week. Donald Trump and Vladimir Putin are expected to meet in Alaska. This will mark the first face-to-face talks between the leaders of the two major powers since 2021, when Putin met with Biden in Geneva.
The upcoming meeting is widely seen as a potential step towards ending the full-scale military conflict in Ukraine, which began in 2022. Anticipation of the talks is easing geopolitical tensions, which is reflected in today’s downward movement of the gold price, visible on the XAU/USD chart.
XAU/USD Technical Analysis
Today, gold prices have fallen to the $3,360 area, with several bearish signals apparent on the chart:
→ The decline occurred on long bearish candles (as shown by the arrow). From a price action perspective, this suggests mounting selling pressure.
→ The MACD histogram has moved below zero, with the indicator lines pointing downward.
→ Gold has broken the upward trendline support from above (marked in blue). The breakout level, around $3,380, may now act as resistance, as sellers have asserted their dominance here.
→ From a broader perspective, the price appears to be reversing from the resistance line drawn through this summer’s highs.
Given these factors,we could assume that gold is heading towards the lower black trendline, which runs through the notable July lows and forms a channel with the upper line. However, along the way, sellers will need to overcome a key support zone in the form of a bullish Fair Value Gap (marked in purple). The upper boundary of this zone is reinforced by the 50% Fibonacci retracement level plotted from the bullish impulse points A→B.
Whether the bears can push the price through the FVG zone will largely depend on gold’s reaction to tomorrow’s US inflation data (CPI release scheduled for 15:30 GMT+3).
This article represents the opinion of the Companies operating under the FXOpen brand only. It is not to be construed as an offer, solicitation, or recommendation with respect to products and services provided by the Companies operating under the FXOpen brand, nor is it to be considered financial advice.