Keep gold shorts open and look forward to profits!After breaking through the resistance areas near 3335 and 3355, gold continued to rise to around 3379; although the rise in gold was relatively large, after gold touched above 3370, the bullish momentum weakened and there were signs of high-level stagflation, so gold is still expected to usher in a wave of retracement in the short term.
After the sharp rise in gold, the current relatively obvious support area is located in the 3345-3335 area. If gold cannot effectively break through 3380, then gold is expected to retrace to test the support of the 3345-3335 area again.
As the trading strategy shared in my previous opinion, I have shorted gold in batches in the 3370-3380 area as planned. At present, we still hold short positions. Let us look forward to the expected retracement of gold!
CAPITALCOM:GOLD OANDA:XAUUSD FOREXCOM:XAUUSD TVC:DXY
Xauusdtrade

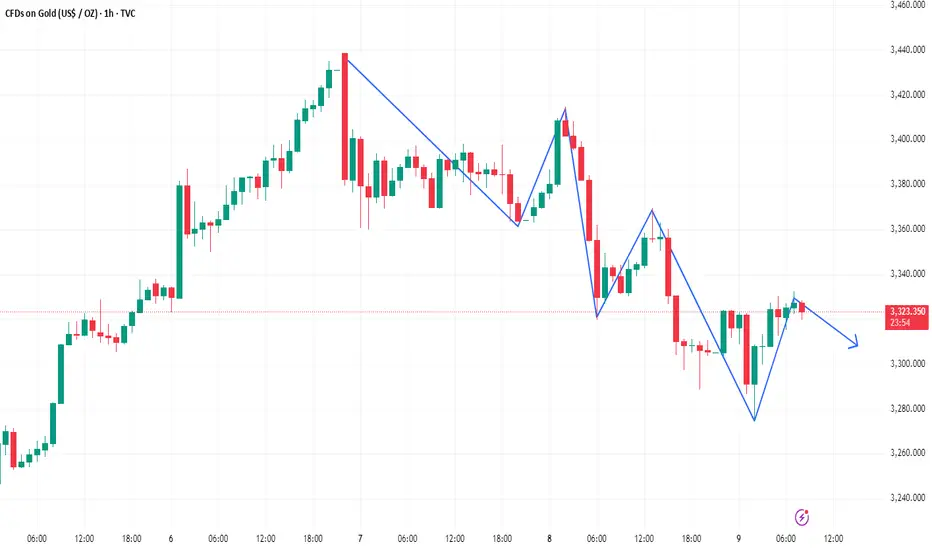
Affected by tariffs, gold prices rebounded to above 3,300
Gold finally broke the calm of the past and resumed its upward trend. What happened? This is also thanks to President Trump, who imposed tariffs again over the weekend, and there was also news of air strikes. The combination of the two directly broke the calm of gold prices in the past.
So where can this wave of gold go? Technically, gold 1-hour cycle, maintained fluctuations around 3,348, and the support line is expected to be around 3,330.
Our strategy today is also very simple. As long as the gold price retests around 3,360-3,350, I will go short. Which specific position can stop profit? I will tell my VIP.

Market Analysis: Gold Price Could Gain Bullish PaceMarket Analysis: Gold Price Could Gain Bullish Pace
Gold started a fresh increase above the $3,300 resistance level.
Important Takeaways for Gold Price Analysis Today
- Gold price started a steady increase from the $3,250 zone against the US Dollar.
- A connecting bearish trend line is forming with resistance at $3,318 on the hourly chart of gold at FXOpen.
Gold Price Technical Analysis
On the hourly chart of Gold at FXOpen, the price found support near the $3,250 zone, formed a base, and started a fresh increase above the $3,280 level.
The bulls cleared the $3,300 zone and the 50-hour simple moving average. There was also a move above the 61.8% Fib retracement level of the downward move from the $3,331 swing high to the $3,271 low. The RSI is now above 50 and the price could aim for more gains.
Immediate resistance is near the 76.4% Fib retracement level of the downward move from the $3,331 swing high to the $3,271 low at $3,318. There is also a connecting bearish trend line forming with resistance at $3,318.
The next major resistance is near the $3,330 level. An upside break above the $3,330 resistance could send Gold price toward $3,382. Any more gains may perhaps set the pace for an increase toward the $3,400 level.
Initial support on the downside is near the $3,300 zone. If there is a downside break below the $3,300 support, the price might decline further.
In the stated case, the price might drop toward the $3,270 support. The next major support sits at $3,250. Any more losses might send the price toward the $3,220 level.
This article represents the opinion of the Companies operating under the FXOpen brand only. It is not to be construed as an offer, solicitation, or recommendation with respect to products and services provided by the Companies operating under the FXOpen brand, nor is it to be considered financial advice.

XAU/USD Chart Analysis: Gold Price Stabilises Around $3,300XAU/USD Chart Analysis: Gold Price Stabilises Around $3,300
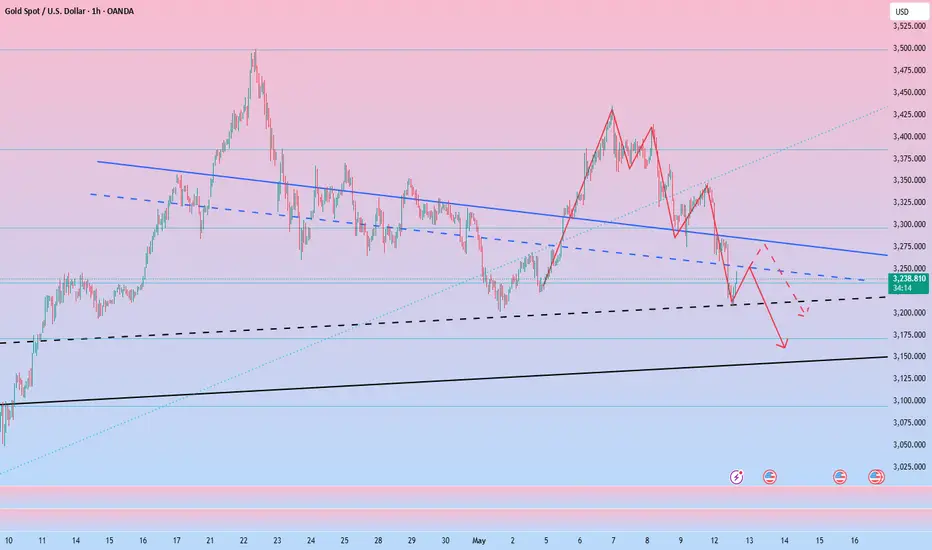
Throughout May, a turbulent news backdrop — involving both international trade tariffs and armed conflicts — led to the formation of a peak around $3,430 and a low near $3,130 on the XAU/USD chart. As of today, the price per ounce stands around $3,300 — roughly the same level as at the beginning of the month.
This suggests that supply and demand forces are largely balanced, keeping the price contained between these extremes. The XAU/USD chart provides further confirmation, emphasising the significance of the $3,300 level.
Technical Analysis of the XAU/USD Chart
From a bearish perspective: The A→B→C→D→E sequence forms lower highs and lower lows — a clear sign of a downtrend. This trajectory is marked in red, with the upper line acting as resistance.
From a bullish perspective: Since the beginning of 2025, the gold price has been moving in an uptrend,indicated by a blue channel, with its lower boundary serving as key support (highlighted with arrows).
Notably, these support and resistance lines are converging, forming a narrowing triangle — an indication that supply and demand are balancing, finding consensus around the $3,300 level, where the axis of the triangle lies.
Given this, it is reasonable to assume that in June, the gold price on the XAU/USD chart may continue to fluctuate within this triangle — unless an extraordinary event causes a significant shift in the current balance.
This article represents the opinion of the Companies operating under the FXOpen brand only. It is not to be construed as an offer, solicitation, or recommendation with respect to products and services provided by the Companies operating under the FXOpen brand, nor is it to be considered financial advice.

Gold is still washing out, beware of a fall below 3326!
📊Comment Analysis
After gold fell in the Asian session, the entire European session rebounded continuously, and the US session hit the 3318 line. Overall, it is still a wide range of shocks and washes out. No matter whether it rises or falls, it is not continuous, and the fluctuation range is large, which is difficult to grasp in short-term operations.
The current rise cannot be regarded as a strong trend. The characteristic of the shock market is repetition. The 4H cycle opens at 3326 as a watershed. Beware of a fall below this position in the US session. You can try to go short near 3320/3325. At present, it is a key position to bet on the short position. If it goes up, it will be 3340/3350. The rise in a short period of time is too large, and once it falls back, the strength will be the same.
⭐️ Note: Labaron hopes that traders can properly manage their funds
- Choose a lot that matches your funds
- Profit is 4-7% of the fund account
- Stop loss is 1-3% of the fund account

5/28 Gold Analysis and Trading SignalsGood morning everyone!
Yesterday, gold saw a sharp downward move, and we profited well by trading short based on the double-top pattern.
Yesterday, gold has reached the 3287 support area, and by the end of the U.S. session it rebounded slightly above 3300. Although the rebound lacks strong momentum, it does show that the support zone held on the first test. Whether the bulls can take back control depends heavily on today's follow-up strength.
📊 Key Technical Levels:
If bulls break above and hold 3323–3336, a bullish reversal is likely;
If the bounce is weak, short positions remain the preferred strategy;
4H support: 3268
Daily support: 3172
Before that, 3301–3275 also forms an important support zone;
If price breaks below 3301–3275, especially under negative news impact, a drop to 3150 or even 3100 is not out of the question.
🗞 Key News Focus Today:
Watch for May FOMC-related remarks during the U.S. session, which could become a catalyst for major market movement.
📈 Today’s Trading Plan:
📉 Sell in the 3342–3362 zone (strong resistance)
📈 Buy in the 3258–3248 zone (strong support)
🔁 Flexible intraday levels to monitor:
3336 / 3328 / 3319 / 3306 / 3295 / 3286 / 3274 / 3266
Stay sharp and combine technicals with key news events to make informed trades. Feel free to reach out if you need support — wishing you a profitable day ahead!

The market trend is highly consistent with the chart analysisGold opened with a gap up today, returning to the decline starting point near 3,252 last Friday before falling again. The short-term trend has entered a repeated oscillation, but the key level of 3,200 has not been broken.👉👉👉
On Monday, the international gold price rebounded by more than 1%, boosted by a weaker U.S. dollar and increased safe-haven demand. Gold first fell to the 3,206 level before recovering to the 3,250 level, reversing the early session decline. Gold has been under pressure in recent weeks as markets gradually digest stagflation expectations and reprice rate-cut expectations. The market now expects the Federal Reserve to cut rates by about 58 basis points by the end of the year, compared with the peak expectation of 120 basis points during the panic in April.
From the analysis of the 4-hour chart, the lower support continues to focus on the vicinity of 3170-75. The primary support level is the 3150 threshold, and the important resistance to pay attention to is 3270-3280. Overall, within this range, the main tone of participating in a cycle of selling at high levels and buying at low levels remains unchanged. At intermediate positions, it is advisable to observe more, act less, and be cautious about chasing orders. Be patient and wait for entry at key points.
XAUUSD trading strategy
buy @ 3215-3220
sl 3195
tp 3235-3240
If you think the analysis helpful, you can give a thumbs-up to show your support. If you have different opinions, you can leave your thoughts in the comments. Thank you for reading!👉👉👉

Gold Market Analysis for Next WeekLast Friday's chart analysis was highly consistent with the market trend, and satisfactory results were achieved in trading.👉👉👉
Based on the 4-hour trend analysis, for the opening of gold on Monday, we will first focus on the short-term resistance at the 3,224-3,230 level, and the key resistance at the 3,253-3,260 level. Below, we will pay attention to the short-term support at the 3,170-3,175 level. The operational suggestion is to focus on shorting on rebounds.
XAUUSD trading strategy
sell @ 3230 - 3240
sl 3260
tp 3215 - 3220
If you think the analysis helpful, you can give a thumbs-up to show your support. If you have different opinions, you can leave your thoughts in the comments. Thank you for reading!👉👉👉

Gold Market Summary for Last WeekLast Friday's chart analysis was highly consistent with the market trend, and satisfactory results were achieved in trading.👉👉👉
On Friday, the international gold price fell, potentially recording its largest single-week decline in six months. This trend is mainly attributed to the strengthening of the U.S. dollar and the easing of concerns about the China-U.S. trade war, which together weakened gold's appeal as a safe-haven asset. Gold prices plummeted by more than 2% at one point on Friday, with a cumulative decline of nearly 4% this week—largely driven by increased risk appetite brought about by the trade agreement—marking the largest single-week drop since last November.
The mitigation of the trade war has led to a rebound in risk appetite across the market. This shift has prompted futures traders to take profits, particularly in the gold market, triggering a week-long wave of position liquidation. Gold has faced pressure in recent weeks as the market has ruled out stagflation expectations and repriced rate-cut expectations. Currently, the market expects the Federal Reserve to cut interest rates by approximately 58 basis points by the end of the year, compared to 120 basis points at the peak of panic in April. However, in the short term, the repricing of rate-cut expectations may exert pressure on gold.
XAUUSD trading strategy
sell @ 3230 - 3240
sl 3260
tp 3215 - 3220
If you think the analysis helpful, you can give a thumbs-up to show your support. If you have different opinions, you can leave your thoughts in the comments. Thank you for reading!👉👉👉

Gold Price Drops to Lowest Level in Over a MonthGold Price Drops to Lowest Level in Over a Month
As shown on the XAU/USD chart, the price of gold fell below $3,130 this morning – its lowest level since 10 April.
Since its peak in May, gold has lost more than 8% in value per ounce.
Why Is Gold Falling?
Bearish sentiment in the gold market may be fuelled by easing geopolitical tensions. According to media reports:
→ China and the US have already reported progress in reaching a trade agreement, while details of potential deals with India, Japan, and South Korea are currently being developed.
→ Iran is reportedly willing to sign a nuclear deal in exchange for the lifting of sanctions. In addition, Donald Trump may lift sanctions on Syria during his visit to the Middle East.
→ The situation between India and Pakistan has stabilised, and today, talks between Russia and Ukraine are expected to take place in Istanbul, with a potential ceasefire on the agenda.
These developments could be seen as reducing the appeal of gold as a safe-haven asset.
Technical Analysis of the XAU/USD Chart
In our 7 May gold price analysis, we:
→ outlined a descending channel (marked in red);
→ noted that bearish pressure persisted above $3,400.
Since then, the gold (XAU/USD) price has continued to move within this channel, breaking support around the $3,200 level and approaching a key support zone formed by:
→ the lower boundary of the red channel;
→ a long-term trendline (marked in blue);
→ a former resistance level (highlighted with arrows) at $3,140.
Given these conditions, traders should consider a scenario in which a minor rebound may occur – for instance, towards the median line of the red channel.
This article represents the opinion of the Companies operating under the FXOpen brand only. It is not to be construed as an offer, solicitation, or recommendation with respect to products and services provided by the Companies operating under the FXOpen brand, nor is it to be considered financial advice.

XAUUSD Analysis today: Unemployment spike? Hello traders, this is a complete multiple timeframe analysis of this pair. We see could find significant trading opportunities as per analysis upon price action confirmation we may take this trade. Smash the like button if you find value in this analysis and drop a comment if you have any questions or let me know which pair to cover in my next analysis.

Gold crash alarm is sounding!
Technical aspects:The pressure area of gold is concentrated in the range of 3250-3260. If the market remains weak and under pressure, it will be difficult for gold prices to break through this area. The key support around 3210-3200 should be focused on for gold to go down. If the gold price falls below the support of 3200, it may trigger a waterfall-like decline, and the expected support bottom is in the area of 3100-3050.
In terms of operation, you can wait for the opportunity to rebound and come under pressure after the position is broken, and take advantage of the trend to place short orders. It is important to remember that 3200 is like a key line of defense. Once it falls, it will trigger a chain selling.

CPI data market, buy gold!Fundamentals:
Focus on CPI;
Technical aspects:
As expected in my previous article, gold has rebounded to the area around 3250-3260 as expected.According to the current structure, gold tends to fluctuate upward in the short term; it may even extend to the 3280-3290 area.Gold rebounded after touching 3207, and combined with the secondary low point near 3215 to form a "W" structure. This technical structure has formed a strong support structure for gold prices; and after the bad news is exhausted, the on-site wait-and-see funds will gradually enter the market, which will also push up the gold price to a certain extent. So I think gold still has the conditions to challenge the 3280-3290 area!
Trading strategy:
Consider starting to go long on gold in batches in the 3250-3240 area, target price: 3270-3280

XAUUSD Analysis todayHello traders, this is a complete multiple timeframe analysis of this pair. We see could find significant trading opportunities as per analysis upon price action confirmation we may take this trade. Smash the like button if you find value in this analysis and drop a comment if you have any questions or let me know which pair to cover in my next analysis.

XAU/USD Bearish Trade Setup Supply Zone Rejection to Target 3350Trend Overview
📉 Downtrend in Play
Price has reversed from the peak near $3,354
Currently trading below the 70 EMA (📍$3,299.86)
Forming lower highs – indicating bearish momentum.
Key Zones & Levels
🔶 Supply Zone (Resistance)
📍 $3,290.72 – $3,353.41
Strong selling pressure expected here
Possible short entry if price gets rejected
🟦 Support Zone (Previous Support)
📍 Around $3,254 – $3,210
Price has previously bounced here
🎯 Target Point (Take Profit)
📍 $3,050
Clear support level – used as a profit target
Trade Setup – Bearish Bias
🟩 Entry Point
📉 Sell near $3,290.72 (inside supply zone)
🛑 Stop Loss
❌ Above $3,354.69 (above resistance line)
✅ Take Profit
💰 Target $3,050
⚖️ Risk-Reward Ratio
Approx. 1:3 – Favorable for short trades.
Summary
🔍 Watch for a rejection in the supply zone
💼 Setup is ideal for short sellers
📊 Downtrend is supported by structure and EMA

Continue to short gold after the reboundFundamentals:
The positive signals from the China-US negotiations have eased the market's concerns about the US economic recession, and the weakening of risk aversion has stimulated a sharp pullback in gold. Market funds are no longer eager to seek safe-haven assets, so they withdraw their funds from gold and turn to risk markets.
Technical aspects:
The gold price plummeted by $110 during the day. Although it has rebounded slightly at present, the overall rebound momentum is relatively weak. The upper 3280-3290 area is currently the main short-term suppression level, followed by the 3240-3250 area. If the rebound in this area is not broken, you can continue to short gold, and the shorts may continue to reach new lows; focus on the support of the 3200 mark below. If 3200 is not broken, then the bulls may try to counterattack and fill the upper gap; if gold falls below 3200, gold will continue to fall to the area around 3170.
Trading strategy:
1. Consider shorting gold after it rebounds to the 3245-3255 area, TP: 3220
2. Consider going long on gold after it continues to fall to the 3180-3170 area, TP: 3220;
3. If gold stabilizes above 3200, we can consider going long on gold around 3200 in advance.
Gold is still in a short-term bearish trendGold's 1-hour moving average continues to turn downward. If it crosses below to form a downward death cross, then gold's room for decline may further open up. The short-term short position of gold has not ended yet. Gold has a trend of falling again. The short-term trend of gold is still short.
Trading ideas: short gold near 3325, stop loss 3340, target 3290
Gold is expected to pull back, short gold!Fundamentals:
Focus on the Fed's interest rate decision and Powell's speech;
I think the Fed will keep the interest rate decision unchanged this time, at least it will not announce a rate cut this time, which may suppress the gold market;
Technical aspects:
Before the Fed's interest rate decision, gold is currently in a volatile state. However, relatively speaking, it is currently in a volatile and bearish state, with short-term resistance in the 3395-3405 area; and gold has repeatedly tested the 3370-3360 below during the retracement process. After multiple tests, gold may be more likely to break through this support area; the key support below is in the 3360-3350 area, followed by the 3320-3310 area.
Trading strategy:
Consider shorting gold in the 3395-3405 area, TP: 3370-3360

Gold is under pressure at 3400, with a short-term decline expectGold is under pressure around 3400. Today we will have the Fed's interest rate decision and Powell's speech. If gold is under pressure at 3400, it is expected to fall. Before the data, we need to be cautious.
In terms of trading ideas, we can short short-term, pay attention to the short near 3393-96, stop loss 3403, take profit 3360/3350

Has the road to gold adjustment begun?Gold has reached a high of around 3404, so this position can be used as an important pressure point. In this continuous upward trend, once there is a sharp decline, it is likely to be a signal that the short-term bulls have peaked. Then we need to consider whether the bears can reverse, and the current upper pressure point is also the high point of the last wave of pullback near 3393, and the lower support is at 3360.
Trading idea: short near 3387, sl: 3400 tp: 3370

XAU/USD Analysis: Chart Indicates Elevated VolatilityXAU/USD Analysis: Chart Indicates Elevated Volatility
The XAU/USD chart shows that the ATR (Average True Range) indicator has reached its highest level in several weeks, signalling increased market volatility.
In addition, trading activity is being fuelled by heightened geopolitical tensions, now including an escalation of the conflict between India and Pakistan.
The price action analysis of the precious metal also provides valuable insight, highlighting the ongoing battle between supply and demand.
Technical Analysis of the XAU/USD Chart
On 23 April, we noted a sharp shift in sentiment after the price of XAU/USD peaked around $3,500.
Gold price fluctuations today suggest continued bearish pressure above $3,400, leading to a downward reversal at peak B, which sits below the previous high at A.
This forms the basis for outlining a descending channel and suggests that bears may attempt to keep the price within its boundaries. On the other hand, the $3,333 level was decisively broken by a wave of buying (shown with a blue arrow), and a bullish “cup and handle” pattern is emerging in the background — it is possible that, as part of the May rally, bulls may try to surpass peak B.
Whatever the outcome, elevated volatility appears likely to persist — especially with the US Federal Reserve’s interest rate decision due today at 21:00 GMT+3, followed by Jerome Powell’s press conference at 21:30.
This article represents the opinion of the Companies operating under the FXOpen brand only. It is not to be construed as an offer, solicitation, or recommendation with respect to products and services provided by the Companies operating under the FXOpen brand, nor is it to be considered financial advice.

Are gold bulls regaining control of the market?
📌 Driving factors
The latest news from the Chinese Ministry of Foreign Affairs on Wednesday showed that Chinese Vice Premier He Lifeng will visit Switzerland from May 9 to 12. During this period, he will serve as the Chinese leader of Sino-US economic and trade and hold talks with the US leader, US Treasury Secretary Benson.
Beijing said that on the basis of fully considering global expectations, Chinese interests, and the calls of the US industry and consumers, China decided to agree to engage with the US. Any dialogue and negotiation must be carried out under the premise of mutual respect, equal consultation, and mutual benefit. If the United States attempts to continue to coerce and blackmail under the guise of talks, China "will never agree."
The market is paying attention to the policy decision announced by the Federal Reserve on Wednesday. It is expected that the Fed will keep interest rates unchanged at the meeting, but this meeting may be the last meeting with such a clear result.
Federal Reserve Chairman Powell is unlikely to provide clear guidance on how the Fed plans to respond to U.S. tariffs. Macquarie analysts led by Thierry Wizman wrote in an investor report, "If traders naively believe that the Fed will save the world and use obvious "dovish" signals to alleviate the recent increase in policy and political uncertainty, then they should think again."
In addition, investors also need to pay attention to the impact of news related to the geopolitical situation. This week, Israel and the Houthi armed forces "fought hard", which also provided safe-haven buying support for gold prices. There have also been some conflicts between India and Pakistan, which investors need to pay attention to.
📊Comment Analysis
Gold price awaits today's interest rate result, rebounded well above 3400 but then fell immediately, indicating that the market is not ready for the first rate cut, and if there is, gold price may face strong selling pressure today
💰Strategy Package
Long position:
Actively participate near 3365 points, profit target is around 3420 points
⭐️ Note: Labaron hopes that traders can properly manage their funds
- Choose the number of lots that matches your funds
- Profit is 4-7% of the fund account
- Stop loss is 1-3% of the fund account

Gold still has the potential to extend to 3420-3430.Fundamentals:
Focus on the Fed's interest rate decision;
Technical aspects:
Gold rose to 3397 and encountered resistance and fell back, and the bulls' momentum was insufficient. But I think the gold bulls are far more than that. Gold is bound to hit 3400, and even continue to the 3420-3430 area; since gold rebounded after hitting 3200, it has repeatedly built a solid bottom structure support below, and the oscillating rise has effectively supported the continued rebound of gold. As the center of gravity of gold moves up, the support structure also gradually moves up. The current short-term support is in the area around 3380-3370, and the second is in the area of 3365-3355.
Trading situation:
According to today's trading strategy: Go long on gold at 3350 in the morning and around 3375 in the afternoon. In order to lock in profits in time, manually close orders at 3366 and 3394 respectively. Today, the total profit in gold long transactions exceeded 360pips.
Trading strategy:
During the rising shock, there are profit opportunities for both long and short parties in some areas, but currently, overall, bulls have the advantage and are mainly long gold. Consider the opportunity to go long when gold falls back to the area around 3380-3370, TP: 3400.
