17/9/68 : XAUUSD ( US Session )Using it from US Session until 11.00AM , I'll new analysis and update at 12.00PM
Resistance
3697-3703
3687-3692
3677-3682
3671
Support
3661
3651-3656
3640-3646
3630-3635
Xauusdtrend

17/9/68 : XAUUSD ( Europe / London Session )Using it from Europe Session until 7.00PM , I'll new analysis and update at 8.00PM
Resistance
3703-3708
3691-3697
3686
Support
3676
3665-3670
3654-3660

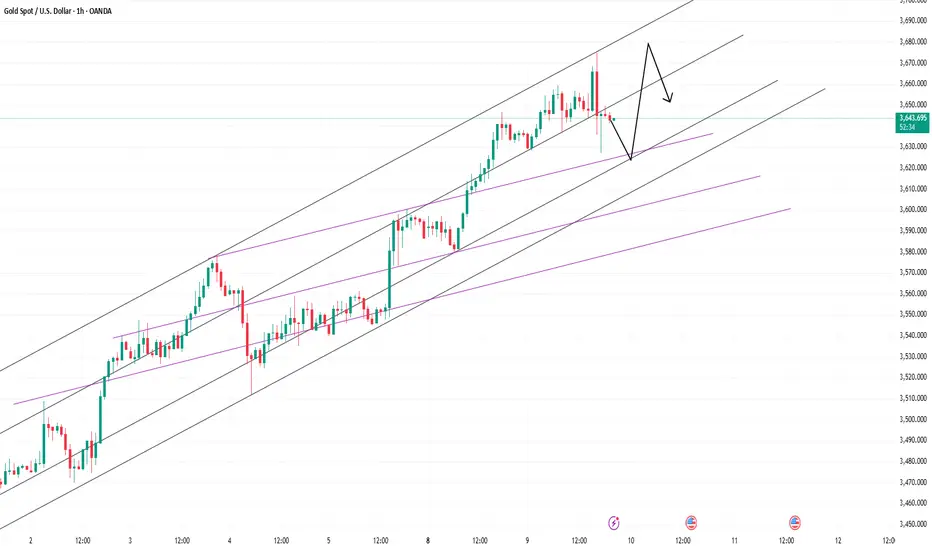
False Break at 3700:Retreating Toward 3680-3670Currently, the highest price of gold has reached around 3699, and it is only one step away from the 3700 mark! I have to say that against the backdrop of significantly increased market expectations for interest rate cuts, the resonance of technical and news factors has pushed up gold prices. The current bullish momentum is strong, and there has been almost no obvious pullback during the rise. At this stage, most of these are tricks played by big funds, and it is actually difficult for retail investors to participate in long transactions. Therefore, at this stage, I will not rush to chase the rise in gold prices.
From an intraday perspective, gold still has the potential to hit the 3700-3710 area, so my latest trading plan is to continue shorting gold near this area. With gold bulls so strong, why I am still optimistic about a gold pullback. The main reason is that the current market is facing a critical time window. The Federal Reserve will announce its interest rate decision tomorrow, but I think the Federal Reserve may announce a 25 basis point interest rate cut in a step-by-step manner, rather than the 50 basis points expected by the market. If the rate falls far short of market expectations, gold could experience a significant pullback or even a crash. However, the sharp rise in gold prices near the Fed's rate decision suggests it may be an attempt to reserve room for further declines. In addition, based on the current trading volume, the small trading volume may not be able to support the continued upward trend of gold. It is for this reason that while I avoid chasing high gold prices, I also always remain optimistic about gold shorts.
Therefore, at this stage, I would consider shorting gold in batches based on market price performance. By effectively raising the average entry price, we can reap the first bite of the pie after gold prices fall.
However, we must note that short-term support for gold currently lies in the 3680-3670 area, with strong structural support below that at 3660-3650. Therefore, in order to lock in profits in time, these two support areas will be our primary target areas for short trading.

16/9/68 : XAUUSD ( US Session )Using it from US Session until 11.00AM , I'll new analysis and update at 12.00PM
Resistance
3719-3724
3707-3713
3702
Support
3691
3681-3686
3671-3676

16/9/68 : XAUUSD ( Europe / London Session )Using it from Europe Session until 7.00PM , I'll new analysis and update at 8.00PM
Resistance
3705-3710
3695-3700
3690
Support
3679
3668-3673
3657-3663

15/9/68 : XAUUSD ( US Session )Using it from US Session until 11.00AM , I'll new analysis and update at 12.00PM
Resistance
3664-3669
3653-3658
3648
Support
3638
3627-3633
3617-3622

Gold Price Stabilises Ahead of Central Bank DecisionsGold Price Stabilises Ahead of Central Bank Decisions
Following the ECB’s decision last week to leave interest rates unchanged, traders will closely monitor this week’s monetary policy announcements from the US Federal Reserve, the Bank of England, the Bank of Japan, and other central banks from Toronto to Taipei.
As the XAU/USD chart shows today, the gold price has stabilised after its recent record highs, with investors adopting a wait-and-see stance. The ADX indicator is trending lower, suggesting a diminishing directional momentum.
Key Drivers Influencing Gold Prices
Market participants are almost fully convinced that the Federal Reserve will cut rates by a quarter point this week, while also pricing in the likelihood of further reductions next year amid signs of labour market weakness. Lower rates are generally seen as supportive for gold, making it a more attractive asset relative to yield-bearing US Treasuries.
Additional factors underpinning bullish sentiment include:
→ Weakness in the US dollar.
→ Persistent geopolitical tensions.
→ Pressure on the Fed from Donald Trump, who recently attempted to dismiss Board Governor Lisa Cook.
→ Central bank gold purchases.
On the other hand, profit-taking could dampen demand. Nevertheless, gold prices remain elevated.
Technical Analysis of XAU/USD
Recently, we outlined three reasons why gold’s rally might pause. Since then, the price has consolidated within the $3,610–3,660 range.
This has confirmed the assumption that the median line of the long-term ascending channel is acting as resistance. The steep upward channel (marked with orange lines) has been broken.
What Could Happen Next
→ From a bullish perspective, the resistance levels at $3,510 and $3,575 have been broken to the upside and successfully retested – a sign of strong demand.
→ From a bearish perspective, the candlestick’s long upper shadow, where gold set its record high, reflects aggressive selling pressure.
An attempt to break below the $3,575 support level and the orange dotted line (an additional support trendline plotted beneath the orange channel) could happen.
However, whether this scenario materialises will largely depend on upcoming central bank announcements. Traders should brace for heightened volatility.
This article represents the opinion of the Companies operating under the FXOpen brand only. It is not to be construed as an offer, solicitation, or recommendation with respect to products and services provided by the Companies operating under the FXOpen brand, nor is it to be considered financial advice.

15/9/68 : XAUUSD ( Europe / London Session )Using it from Europe Session until 7.00PM , I'll new analysis and update at 8.00PM
Resistance
3666-3671
3656-3661
3651
Support
3641
3631-3636
3620-3626

12/9/68 : XAUUSD ( US Session )Using it from US Session until 11.00AM , I'll new analysis and update at 12.00PM
Resistance
3667-3672
3657-3662
3652
Support
3641
3631-3636
3620-3626

Quiet Storm:Bulls vs Bears in Waiting!Under the influence of CPI and initial jobless claims data, gold rose directly to the area around 3644. The short-term rise seems exaggerated, but it did not stand firmly above 3650, and even failed to reach the intraday high of 3649. The release of bullish momentum was relatively convergent; it can be clearly seen from the short-term candlestick chart that gold showed long upper shadows many times in the short term, and the trajectory and structure began to shift downward, and tested support downward many times, which also proved that the short-selling force was gradually recovering after being suppressed.
However, gold rebounded after touching the 3620-3610 support area several times during the retracement. Although the bullish momentum has declined in the short term, the bullish structure has not been completely destroyed, so the overall structure is still controlled by the bulls, and the bullish force still has enough strength to support gold.
Overall, as the bulls become more cautious and the bears gradually recover, gold is expected to maintain high-level fluctuations in the short term, and the fluctuation range is likely to remain in the 3655-3615 area. Therefore, for short-term trading, we can strictly stick to the trading points and execute high-selling and low-buying transactions within the area.

12/9/68 : XAUUSD ( Europe / London Session )Using it from Europe Session until 7.00PM , I'll new analysis and update at 8.00PM
Resistance
3676-3681
3666-3671
3661
Support
3650
3640-3645
3630-3635

11/9/68 : XAUUSD ( Europe / London Session )Using it from Europe Session until 7.00PM , I'll new analysis and update at 8.00PM
Resistance
3651-3656
3641-3646
3636
Support
3625
3615-3620
3605-3610

Bulls vs Bears: Race to 3700 or 3600 ?!Currently, gold is fluctuating above the 3640 line. We can clearly see that gold has not effectively fallen below 3640 during multiple pullbacks in the short term. This proves that during the pullback period of gold, a lot of funds have entered the market, thereby pushing the gold price to fluctuate upward. However, during the upward fluctuation, gold encountered resistance and fell back in the 3655-3660 area many times, exacerbating the short-term volatility trend!
But we need to note that gold has rebounded since 3620 and formed a band-like low point structure; and it has tested 3640 many times and has not fallen below it, showing signs of forming a band-like secondary low point structure. Judging from the characteristics of the low point gradually rising, the current bullish force has a slight advantage, so short-term trading is still dominated by going long on gold.
Judging from the current structure, the short-term support area below is located in the 3635-3625 area, followed by the 3615-3605 area; and the short-term resistance is located near 3660. If gold breaks through the area near 3660 during the volatile upward process, gold may test the high point area near 3675. Once the high point near 3675 is refreshed again, it is expected to directly touch around 3700.
Therefore, it is not completely certain that gold has peaked at present, and we should not blindly chase short gold in trading; on the contrary, when gold retreats to the support area of 3635-3625, we can try to go long on gold, first aiming at the target area: 3660-3670, and once it breaks through this area, the target area will be postponed to the 3690-3700 area.

Battle Lines Drawn — Which Comes First, 3700 or 3600?Gold started to fall from around 3675, but failed to effectively fall below 3620 many times during the retracement, so the current retracement cannot be regarded as a market reversal. If the gold market has really peaked, I think the minimum requirement is to effectively fall below 3620, but it is obvious that this condition has not been met yet. Under the current conditions, it can only be regarded as a pullback correction. So at this stage of trading, we cannot be overly bearish on gold.
Currently, gold bulls and bears are competing with each other for control, and the price will remain in a wide range of fluctuations in the short term. However, since gold rebounded from 3620, the bullish structure has not been destroyed. The short-term support below is in the 3635-3625 area, and further strong support is in the 3615-3605 area. If gold fails to break below the 3635-3625 area, it will favor bulls and could serve as a springboard for further gains. Once gold continues its upward trend and breaks through the 3665 area, it could potentially reach the 3680-3690 area.
Therefore, in short-term trading, since gold remains bullish, we can continue to buy gold within the 3635-3625 support area, with the primary target being the 3660-3670 area.

10/9/68 : XAUUSD ( Europe / London Session )Using it from Europe Session until 7.00PM , I'll new analysis and update at 8.00PM
Resistance
3664-3669
3654-3659
3649
Support
3638
3628-3633
3617-3622

ANFIBO | I think XAUUSD on 09.09.2025 ???Currently, gold is moving within a clearly defined upward trend channel. Our strategy for today should focus on monitoring key resistance and support zones in order to identify potential entry points for both scalp trades and swing trades. The levels I consider noteworthy are as follows:
>> SELL SCALP: 3650 - 3660, SL 3670, TP 3600
>> BUY SCALP: 3598 - 3603, SL 3595, TP 3680 - 3690
>>> SWING BUY: 3560 - 3570, SL 3550, TP 3680 - 3690 - OPEN
>>> SWING SELL: 3790 - 3801, SL 2820, TP 3680 - 3570 - 3450 - OPEN
Have fun!!!

High-Level Consolidation: A Playground for Both Bulls and BearsToday, I clearly predicted that "cyclical patterns suggest a 600-pips drop in gold." Gold surged to around 3675 before retreating, reaching a low of around 3626, a fluctuation of 490 pips. It was very close to my expectation, so according to my trading model, I won a big victory in long and short trading today!
Day Trading Results:
1. First, we shorted gold near 3658 and closed the trade at TP: 3638, for a profit of 200 pips.
2. We shorted gold twice at 3655-3656, closing the positions manually at 3647 and 3645, respectively, for a total profit of 190 pips.
3. We shorted gold in batches near 3667 and 3673, closing the trade at TP: 3650, for a total profit of 400 pips.
4. We longed gold in batches near 3632 and 3628, closing the trade at TP: 3642, for a total profit of 240 pips.
Thus, today's total profit on both long and short trades was 1030 pips. I am very satisfied with today's trading model and results.
As for my view on the gold market in the future, I believe that the current gold market is still in an environment of interest rate cut expectations, and the macroeconomic background still has a significant supporting effect on gold. The current bullish trend of gold has not changed, and short-term fluctuations will not affect the overall direction. Therefore, before the interest rate cut is implemented (the Federal Reserve announces its interest rate decision on September 17), gold will still maintain an upward structure.
Judging from the candlestick chart, as long as gold remains above 3600, gold will remain in a bullish structure and maintain an overall upward trend. Although gold began to retreat after touching around 3675, and the bullish momentum no longer seems strong, I believe that gold has limited room for retreat in the short term. Even if the bulls no longer recover their previous strong momentum, gold is expected to maintain a high-level volatile trend, with the short-term support below at 3630-3620. If it is difficult for gold to fall below this area in the short term, gold may still hit the 3670-3680 area during the rebound.
Therefore, in the next short-term trading, if gold first retreats to the 3630-3620 area, we can consider trying to go long on gold, first looking at the 3650-3660 target area;If gold touches the 3670-3680 area again during the rebound, we can still try to short gold again, and the retracement target will first look at the 3655-3645 area.
XAU/USD Analysis: 3 Reasons Why Gold’s Rally Might PauseXAU/USD Analysis: 3 Reasons Why Gold’s Rally Might Pause
Today’s XAU/USD chart shows that gold continues to set records in September. The price has risen above $3,650 per ounce for the first time in history – one of the main drivers being expectations of a Federal Reserve rate cut on Wednesday, 17 September.
Easier monetary policy is generally seen as boosting gold’s appeal – this has pushed XAU/USD nearly 6% higher since the start of September. However, the chart highlights three reasons why further upside may be limited.
Technical Analysis of the XAU/USD Chart
1. Long-term channel:
Over the course of 2025, gold price movements have formed an ascending channel (shown in blue), and today XAU/USD is trading close to its median line. This is where supply and demand typically balance out. Buyers may consider the post-September rally overstretched, while sellers could view the all-time high as an opportunity to take profits.
2. Rectangle pattern target reached:
The range between $3,250 and $3,440 that developed mid-year can be interpreted as a rectangle pattern. Following the bullish breakout, the implied target of $3,630 has already been achieved.
3. RSI signals risk:
The RSI indicator is close to forming a bearish divergence.
Given the steep angle of the orange support line, a correction – for example, towards the psychological level of $3,550 – might occur.
In summary, gold’s upward momentum may start to slow. At the same time, given the market’s inertia, traders may have little reason to expect a decisive shift away from bullish dominance. Still, next Wednesday could bring surprises.
This article represents the opinion of the Companies operating under the FXOpen brand only. It is not to be construed as an offer, solicitation, or recommendation with respect to products and services provided by the Companies operating under the FXOpen brand, nor is it to be considered financial advice.

9/9/68 : XAUUSD ( Europe / London Session )Using it from Europe Session until 7.00PM , I'll new analysis and update at 8.00PM
Resistance
3675-3680
3665-3670
3660
Support
3649
3638-3643
3628-3633

5/9/68 : XAUUSD ( Europe / London Session )Using it from Europe Session until 7.00PM , I'll new analysis and update at 8.00PM
Resistance
3580-3585
3570-3575
3564
Support
3554
3544-3549
3534-3539

Gold (XAU/USD) – 2 Sept 2025With spot gold anchored at $3493, today’s price action is unfolding within a well-defined technical framework. Institutional flows continue to dominate, and liquidity engineering in recent sessions has created precise execution zones. Below is the validated map of opportunity for the day, built upon a multi-timeframe confluence model.
🔹 Primary Buy Zone – $3472 to $3480
The most compelling area of interest sits between $3472 and $3480, an untouched 4H demand zone that aligns seamlessly with the Fibonacci golden pocket retracement of the prior bullish impulse. Liquidity was engineered below New York session lows, and this pocket now rests just above anchored VWAP support.
Stop Loss: $3466 (beneath order block invalidation)
Take Profits: 3493 / 3503 / 3513 / 3523 / Open trail
Zone Strength: 9/10 – Institutional Grade (Golden Zone)
This area represents today’s highest-probability setup. Should price hold above $3472, we anticipate continuation into $3520+ with strong order flow participation.
🔹 Secondary Buy Zone – $3450 to $3456
A deeper liquidity pocket exists around $3450–$3456, where Asia accumulation lows and equal-lows liquidity converge. This zone coincides with a 4H bullish order block and weekly anchored VWAP.
SL: $3442
TPs: same as above
Strength: 7/10 – Executable
This is a backup zone, valid only if the market aggressively hunts liquidity below the Golden Zone before resuming higher.
🔹 Primary Sell Zone – $3510 to $3518
On the upside, supply remains stacked at $3510–$3518, an unmitigated 4H supply block sitting above last week’s NY high. The zone also aligns with a 78.6% Fibonacci retracement and an ATR exhaustion band.
SL: $3525
TPs: 3500 / 3490 / 3480 / 3470 / Open
Strength: 8/10 – Strong Zone
If bulls overextend, this pocket offers a high-probability short back into mid-range liquidity.
🔹 Secondary Sell Zone – $3530 to $3538
A broader liquidity cluster rests higher at $3530–$3538, defined by a daily supply zone, weekly VAH/POC, and liquidity pools above equal highs at $3535. With speculative positioning heavily net-long in COT data, this area may serve as a distribution zone.
SL: $3544
TPs: same as Primary Sell Zone
Strength: 7/10 – Executable
⚜️ Executive Summary
Today’s Golden Zone is the Primary Buy Zone ($3472–$3480). With multi-timeframe demand, engineered liquidity sweeps, VWAP confluence, and Fibonacci overlap, this zone stands out as an institutional-grade opportunity (9/10).
Execution should remain patient and disciplined: wait for price to tap the Golden Zone, confirm via BOS/CHoCH on lower timeframes, and then scale profits progressively at each 100-pip interval.
In short: $3472–$3480 defines today’s battleground. If defended, bulls control toward $3520+. If breached, deeper liquidity hunts await at $3450 and $3530.

Gold near 3500, Who Wins—Bulls or Bears?Today, after gold touched around 3437 during the retracement, it was pushed up to around 3490 again by market sentiment. The bullish momentum was extremely strong and it is currently in a strong bullish trend. According to the current gold trend, there may be room for continuation above. However, in the transaction, I have made it clear that I will no longer aggressively chase the rise of gold!
First, gold has risen sharply under the influence of fundamentals, and it is difficult to follow up in time on the technical level, resulting in a technical pullback demand for gold; in addition, gold has shown obvious signs of acceleration during the rise, and the market often easily has turning points after acceleration, and although gold is in an obvious bullish trend, it is still under considerable pressure before breaking through the previous high of 3500. These are the reasons why I am unwilling to continue chasing the rise in gold. The most important point is that since the market expectations of interest rate cuts have increased, a large amount of buying has appeared to push up gold prices before the Federal Reserve announced the interest rate cut. It is very likely that the phenomenon of "buying expectations and selling facts" will occur.
Therefore, in the current transaction, I do not advocate continuing to chase gold at high levels. On the contrary, in the 3475-3495 area, I will consider creating as many short positions as possible as a swing trade, and be ready to welcome gold to retreat to the 3435-3415 area at any time.
Of course, because swing trading requires a certain period of time, we can still participate in intraday short-term trading during the execution of swing trading, follow the mainstream trend and try to go long on gold with the support area. The support area we must first pay attention to is in the 3460-3450 area. If gold first touches this area during the retracement process, we can consider going long on gold in intraday short-term trading.
CAPITALCOM:GOLD FX:XAUUSD TVC:GOLD FOREXCOM:XAUUSD OANDA:XAUUSD

GOLD UPDATE After hitting the target for the buy position , I will sell from the price of 3478 to target the price of 3448, which is a sell position with the presence of a pin bar on the hour, which is a RRR 1:1 because it is against the market trend .
Good Luck
