Elliott Wave Analysis – XAUUSD June 24, 2025
🌀 Wave Structure
Looking at the H1 chart during the Asian session today:
+ Price broke below the previous low at 3341, invalidating the idea that Friday’s rally marked the beginning of a new uptrend.
+ Instead, the rally appears to be forming a wave X in a larger WXY corrective structure.
+ Given the current complex corrective pattern, it’s challenging to precisely define the exact wave shape and targets.
🔻 Wave Y Structure:
+ The price action suggests the formation of a 5-wave decline, with the market currently in wave 4.
+ Wave 4 target zone: 3357 – 3363 → Sell zone.
+ After completing wave 4, we expect a continuation of the downtrend via wave 5, with a target around 3327 – 3324 → Buy zone.
+ Once wave 5 completes, we anticipate at least a corrective upward retracement, with targets at 3363 – 3376 (these are the TP levels for the buy trade).
⚡️ Momentum Analysis
+ D1 timeframe: Momentum is turning bullish, suggesting a potential rally lasting around 5–8 D1 candles after wave 5 finishes.
+ H4 timeframe: Momentum is declining and may enter oversold territory within 1–2 candles, supporting the completion of wave 5.
+ H1 timeframe: Momentum is rising and approaching overbought levels, indicating a likely end of wave 4 within 1–2 H1 candles.
📌 Trade Plan
🔹 SELL ZONE: 3363 – 3365
+ SL: 3373
+ TP1: 3342
+ TP2: 3330
🔹 BUY ZONE: 3327 – 3324
+ SL: 3317
+ TP1: 3342
+ TP2: 3363
+ TP3: 3376
+ Important Note:❗️
- If price reaches these zones with a Mazuboru candle (long-bodied candle with no wick) and fast volatility, do not enter immediately.
- Wait for the candle to close. If the zone breaks, keep an eye on the next support area around 3313 for potential reactions.
Xauusdwave

Dark moment for prices. Will it fall even lower?Information summary:
Due to the ceasefire in the 12-day war between Iran and Israel, market risk appetite has rebounded, demand for safe-haven assets has declined, and gold prices have plummeted. As an interest-free asset, gold prices are under pressure against the backdrop of declining risk aversion, but there is still buying support at low levels.
Investors are currently focusing on the speech of Federal Reserve Chairman Jerome Powell at a hearing of the House Financial Services Committee. Powell has been cautious about whether to cut interest rates in the near future.
Market analysis:
The current market selling sentiment has increased significantly, and for gold, falling has become the only path. It seems that the market has lost hope in gold, and the current gold price has fallen to around 3295, then rebounded slightly, and is currently fluctuating around 3313. The break of 3300 declares that gold still has further room to fall, and from the trend point of view, it is likely to continue to fall.
The current trend shows that the important support is around 3285. It is possible that it will fall directly to the current position. The Fed is still speaking, and it is unpredictable whether it will cause drastic fluctuations in gold in the future. However, from today's trend, shorting is the best solution at present, and the upper resistance position is in the range of 3315-3325.
Operation strategy:
Short around 3320, stop loss 3330, profit range 3290-3285.

Israel and Iran have a truce. Gold fluctuates sharply.Information summary:
Trump said on Truth Social that Israel and Iran have fully agreed and there will be a complete and thorough ceasefire. (About 6 hours from now, when Israel and Iran have finished and completed the last mission they are doing!).
After 12 hours, the war will be considered over. Iran will start a ceasefire first, and after the 12th hour, Israel will start a ceasefire, and 24 hours later, the world will salute the official end of this 12-day war.
Senior Iranian officials have confirmed that Tehran has agreed to a US-proposed ceasefire with Israel brokered by Qatar.
Market analysis:
From the current point of view of gold, the news market has been digested in the early Asian market, and gold has also fallen to around 3330. Now it is obvious that there may be a bottoming rebound.
But from the trend point of view, gold is still in the short position, and 3380 and 3400 have not been stabilized.
Judging from the current hourly chart, gold is likely to rebound to 3370-3380. Then it will quickly fall from this position to the early trading low of 3330. At the same time, we can also see that the trend near 3378 is at the Fibonacci 0.382 position. Moreover, the previous trend also rebounded from 3330 to 3380, and then fell back again.
So we need to be patient and wait for the price to rebound before going short. Of course, we can also choose an aggressive long strategy. Of course, we can also choose an aggressive long strategy.
Operation strategy:
Short near 3380, stop loss 3390, profit range 3350-3330.
Long near 3345, stop loss 3335, profit range 3370-3380.

Elliott Wave Analysis – XAUUSD Trading Plan 5/6/2025
🌀 Current Wave Structure
On the H1 timeframe, price action is currently overlapping — a sign that the corrective phase may not be over yet. If the correction had indeed ended at 3334, we would expect a sharper and more impulsive rally typical of wave 3 (green) within wave 3 (black). The lack of that strong momentum suggests the correction could still be unfolding.
Both wave a and wave b (red) are showing 3-wave structures, which points to the development of a Flat correction in the red abc pattern.
Within wave b (red), we’re currently seeing a smaller abc structure (green), with price likely forming wave c (green) right now.
🎯 Target Zones
Wave c (green) target zone: 3390–3393, which is our ideal Sell zone.
If price reverses from this zone, we expect wave c (red) to complete somewhere between 3334–3324.
⚡️ Momentum Outlook
D1 timeframe: Momentum is starting to turn bearish. A confirmation will depend on how today’s daily candle closes. Until then, short-term upside is still possible.
H4 timeframe: Momentum has already turned bearish, supporting the case for a potential wave C (red) to unfold.
H1 timeframe: Currently oversold, which opens the door for a minor push up or some sideways action to finish wave c (green).
📌 Trade Setup
🔻 SELL Zone:
Entry: 3390 – 3393
Stop Loss (SL): 3400
Take Profit (TP1): 3370
Take Profit (TP2): 3357
🔺 BUY Zone:
Entry: 3334 – 3331
Stop Loss (SL): 3322
Take Profit (TP1): 3357
Take Profit (TP2): 3393
Take Profit (TP3): 3410

Elliott Wave Analysis – XAUUSD Trade Plan for June 19, 2025🌀 Wave Structure
On the H4 timeframe, following a strong selloff, price is now consolidating within a narrow price channel — suggesting that we are currently in wave b (black) of an abc correction.
This structure implies that one more leg down is likely to complete wave c (black). However, due to the overlapping and sideways nature of the move, it's difficult to clearly identify the end points of waves a and b, making traditional Fibonacci targeting less effective.
➡️ To improve accuracy, we’re combining Volume Profile data with price action and have identified four key support zones:
3349, 3335, 3313, and 3297
Among these, we’re giving special attention to:
🎯 Target 1: 3335
🎯 Target 2: 3297
We'll wait for bullish momentum signals near these levels to increase the probability of catching the end of wave c.
🔋 Momentum Outlook
Daily (D1): Momentum is about to enter oversold territory. By the end of today or tomorrow, the daily candle is expected to confirm this — suggesting a weakening bearish trend.
H4: Also approaching oversold. If price is hovering around one of the key support levels (3349 | 3335 | 3313 | 3297) when this happens, and the D1 is already oversold, then we may be looking at a high-probability reversal zone.
H1: Nearly oversold as well — expect a short-term bounce soon. The best timing for a BUY will be when the H1 starts turning bullish while both the D1 and H4 are oversold.
✅ Trade Setup
🔹 Scenario 1
BUY ZONE: 3336 – 3333
SL: 3326
TP1 | TP2 | TP3: 3345 | 3378 | 3402
🔹 Scenario 2
BUY ZONE: 3300 – 3297
SL: 3290
TP1 | TP2 | TP3: 3313 | 3345 | 3402
⏳ Patience is key — wait for confluence between support zones and momentum reversals. That’s where the high-probability BUY setups emerge.

Data is about to be released. Will it affect the trend of gold?Information summary:
The Federal Reserve is about to announce the latest interest rate decision, and the market generally expects it to maintain the policy interest rate range of 4.25%-4.50% unchanged. Trump recently asked the Federal Reserve to cut interest rates by one percentage point immediately. However, the market reacted cautiously to this, believing that a sharp interest rate cut may increase inflation risks, especially in the context of Middle East conflicts pushing up oil prices.
Fed Chairman Powell's statement at the press conference will become the focus of market attention. The market expects the Fed to maintain a "cautious and patient" tone, and the guidance on the interest rate outlook may be vague.
Market analysis:
Technical indicators, from the daily chart, the support level is near the 10-day moving average and the 20-day moving average, and the 3365-3345 range forms an important support. In terms of resistance, yesterday's high near 3405 constitutes a key resistance above. If the price wants to reverse the current weak pattern, it needs to break through this resistance level strongly to open up the upward space.
From the 1-hour chart, the price started to fall after reaching a high point, and maintained stability in the upper and lower ranges; it is now close to the low point in the early trading, and the trend is relatively slow.
In the absence of an upward or downward breakthrough, we still follow the strategy of selling high and buying low.
Short around 3400, stop loss 3410, profit range 3380-3365;
Long around 3365 when the price falls back, stop loss 3355, profit range 3380-3400.

Elliott Wave Analysis – XAUUSD | June 18, 2025🌀 Current Wave Structure on H4
The recent drop has broken below the previously labeled wave 1 zone, requiring an adjustment to our wave count. Following the abc corrective move (black), a potential triangle formation is emerging.
At this point, we’re monitoring two possible scenarios:
🔹 Scenario 1 – Triangle as a Wave X Correction:
Price is forming an abcde triangle, potentially part of a larger WXY corrective structure. If this plays out, we may see a strong decline forming wave Y, targeting a break below 3297, and possibly extending to 3248.
🔹 Scenario 2 – Leading Diagonal Triangle as Wave 1:
If this is a leading diagonal triangle for wave 1, then wave 1 is likely completed, and we are currently in wave 2. In this scenario, price should hold above 3248, with likely support zones around 3335 or 3300.
🎯 Key Price Zones & Resistance Levels
Major Resistance: 3389 – 3402 (based on volume profile) – prime area for potential short setups.
Short-term Resistance Levels: 3389, 3402, 3412 – watch for reversal signals here.
🔻 Momentum Outlook
Daily (D1): Momentum is declining and expected to enter oversold territory within 2 candles – indicating a weakening downtrend and supporting the leading diagonal scenario.
H4: Momentum is preparing to turn bearish – supports short opportunities.
H1: Already turned bullish – suggests a possible corrective bounce before the next drop.
📌 Trade Plan
🔴 Sell Zone: 3400 – 3403
• SL: 3410
• TP1: 3365
• TP2: 3335
🟢 Buy Zone 1: 3335 – 3332
• SL: 3325
• TP1: 3365
• TP2: 3402
🟢 Buy Zone 2: 3302 – 3209
• SL: 3292
• TP1: 3335
• TP2: 3365
• TP3: 3402

Seize the opportunity to short gold after the reboundBecause gold fell back to the expected support area of 3375-3365 first, I just took the opportunity to go long on gold near 3372 and set TP: 3390. Obviously, our long position ended the transaction by hitting TP, and we made a profit of 180pips.
At present, gold continues to rebound to around 3396, and is facing the short-term resistance area of 3395-3405, and the upside may be limited. And I think before the Fed's interest rate decision and Powell's monetary policy conference, gold is likely to maintain a range of fluctuations, and the willingness of both long and short parties to break through may not be strong in the short term. And from the current structure, gold tends to fluctuate downward as a whole.
So for short-term trading, we might as well try to short gold in the resistance area. I think it is still very likely to retreat to at least the 3385-3380 area.

Tend to short gold, it may still retrace to 3360-3350 areaAt present, gold as a whole is still fluctuating in the 3395-3365 area. In the short term, both long and short sides are not willing to break through. They may be waiting for the guidance of the Fed's interest rate decision and Powell's monetary policy press conference. However, from the current oscillation structure, because the high point of gold rebound and the low point of retracement are gradually moving downward, the center of gravity of the candlestick chart is shifting downward, and the weight of gold shorts is slightly higher.
From the current structure, 3395-3405 has become a new round of pressure area. Gold has been unable to break through for a long time, and has tried to accelerate downward many times during the retracement process. Although it can stabilize above 3375-3365, it may be easier to break through below after several tests. Once the 3375-3365 area is broken, gold may even continue to move to the 3360-3350 area.
Therefore, within the 3395-3365 oscillation range, we can temporarily maintain the trading rhythm of selling high and buying low in the short term, while we must pay attention to the breakthrough of gold. Once gold breaks through, the trend may be continued, and we need to follow the trend to execute transactions!

elliot wave 15 min chartOANDA:XAUUSD
According to the Elliott Wave analysis on the 15-minute chart, Wave 4 is still in progress. The ideal buying zone is between 3405 and 3395.

Elliott Wave Analysis – XAUUSD June 16, 2025
🌀 Elliott Wave Structure
On the H1 timeframe, price is forming a 5-wave structure (1) (2) (3) (4) (5) in green, with the market currently in wave 4.
Last Friday, after breaking above the 3444 high, price failed to continue toward 3482 and instead reversed lower. This behavior suggests that wave 4 is developing as a Flat correction in black abc structure.
👉 Based on this outlook, wave c is expected to complete around 3314, marking the end of wave 4 in green. From there, a bullish impulse is anticipated to complete wave 5.
🔎 Momentum Overview
D1 timeframe: Momentum is rising → indicating the dominant trend for early this week is likely bullish.
H4 timeframe: Momentum is declining → supporting the scenario that wave c of wave 4 may still have one more leg down.
H1 timeframe: Momentum is about to turn downward → suggesting a potential drop during the Asian session on Monday.
🚨 However, ongoing geopolitical tensions in the Middle East could trigger unexpected price spikes, especially during the Asian session.
📈 Trade Plan
Buy Zone: 3415 – 3412
Stop Loss: 3405
Take Profit 1: 3444
Take Profit 2: 3482

Gold will inevitably fall after risingGold has risen sharply due to the violent geopolitical conflicts and the surge in risk aversion. It once reached around 3445, but in the process of falling back, it only touched 3408 and rebounded again, stabilizing above 3400. It is obvious that due to the changes in fundamentals, the sentiment of gold bulls is high; although the upward momentum of gold near 3440 has weakened, there is no clear signal of peaking yet!
For short-term trading, it is relatively difficult to participate at present. To be honest, I naturally don’t want to chase gold at a high level; but there are no more signals to support me to short gold for the time being. However, with the rebound of gold, the current short-term support below is in the 3425-3415 area, followed by the psychological support of the 3400 integer mark; and the short-term resistance above is in the 3455-3465 area, followed by the area near 3480.
Compared with the profit and loss ratio, I prefer shorting gold for short-term trading, because gold has performed relatively strongly in the London market. Logically, gold will have the inertia to rise in the New York market, so I think gold may rise and then fall in the New York market, so my current plan is to try shorting gold starting in the 3455-3465 area.
Because the changes in gold's fundamentals are more extreme and complex, you must set up SL when participating in transactions.

Elliott Wave Analysis – XAUUSD Trading Plan for June 13, 2025🌀 Wave Structure Overview
As anticipated in previous plans, a strong bullish move has unfolded. Unfortunately, wave 2 within wave 3 was extremely sharp, triggering our stop loss — but that’s part of trading. Not every market movement will go perfectly as planned.
Currently, by closely observing wave 3, we can see that each bullish leg has shown similar length. This suggests a high probability of an extended wave, possibly wave 3 or wave 5.
In Elliott Wave theory, extended waves are the most difficult to predict in terms of where they will end. That’s why selling against the trend (“standing in front of the train”) is discouraged. Instead, we should rely on corrective structures to find buy opportunities in line with the main trend.
On the chart, the price is showing a 5-wave structure (i ii iii iv v) in purple. There’s also a possibility that wave iii itself is extending, forming 5 smaller waves, making a total of 9 subwaves — all with similar bullish momentum. This reinforces the potential for an extended wave in progress.
🎯 Target Zone for Wave iv Correction (Purple)
Watch levels: 3419 and 3411
This is the ideal zone to look for buying opportunities aligned with the prevailing uptrend.
📉 Momentum Analysis
- Daily (D1): Momentum remains bullish, which supports the continuation of the upward trend — a key requirement for a sustained wave move.
- H4: Momentum is currently in the overbought zone and may remain there for a while, waiting for D1 to also reach overbought. However, this also signals a potential risk of reversal that should not be ignored.
- H1: Momentum has turned downward, which supports the idea that wave iv is forming.
✅ Trade Plan
BUY ZONE: 3415 – 3412
STOP LOSS: 3405
TAKE PROFITS:
TP1: 3428
TP2: 3444
TP3: 3480
📌 Note: Stick to trend-following trades and avoid counter-trend positions that try to "catch the top." Be patient, wait for clear confirmation signals around wave iv’s zone, and manage your risk carefully.

Elliott Wave Analysis – XAUUSD (June 12, 2025)🌀 Wave Structure
According to yesterday's plan, the green abc corrective wave likely completed around the 3293 level. The subsequent bullish move is considered Wave 1 in a triangle form, and last night’s news helped Wave 5 hit the target, yielding over 200 pips in profit.
After that, price corrected in a black abc structure. Although the CPI release printed a sharp H1 wick (alongside overlapping waves supporting sellers), the price reversed sharply to the upside — further reinforcing the idea that the correction phase has ended.
Currently, price is testing the previous green Wave b high at 3375.954. A break and close above this level could strengthen the bullish wave scenario. If Wave 1 is indeed a triangle, Wave 3 may extend strongly, with a potential upside target near 3428.
In the short term, price may be forming Wave 1 within Wave 3, and we are watching two key zones:
3358 – 3355
3390 – 3393
⚠️ If price breaks and closes below 3350, the current wave count will be invalidated, and we will shift to a deeper corrective scenario. I will update accordingly to avoid confusion.
🔍 Momentum Outlook
D1: Momentum is rising, supporting the continuation of Wave 3 into next week.
H4: Still bullish; needs 1–2 more candles to reach the overbought zone.
H1: Currently overbought → possible pullback if price hits the 3390–3393 resistance.
⏱️ Bearish momentum reversal at 3390–3393 → confluence zone for a SELL setup
⏱️ Bullish momentum reversal at 3358–3355 → confluence zone for a BUY setup
🎯 Trading Plan
BUY ZONE: 3358 – 3355
SL: 3348
TP1: 3375 | TP2: 3389
SELL ZONE: 3390 – 3393
SL: 3404
TP1: 3375 | TP2: 3358

Insist on shorting gold on ralliesToday we made a total profit of 350 pips in 2 short trades. First, we shorted gold near 3345, and when gold fell to around 3330, we manually closed the order to lock in profits; the second time, gold rebounded sharply with the help of CPI data, and we seized the opportunity to short gold again near 3360, and ended the transaction by hitting TP: 3340. We accurately grasped the profit of gold shorting.
At present, gold is in a narrow range of fluctuations near the 3330 mark. Relatively speaking, gold is still in a weak position. Although gold has rebounded sharply with the help of the positive CPI data, it has shown a long upper shadow in the candle chart due to the rapid retracement, which has strengthened the resistance above and limited the rebound space of gold in the short term. In addition, the morphological structure shows signs of building a head and shoulders top structure. The resistance area in the short term is 3345-3355; followed by 3360-3370. Although gold is currently in a narrow range of fluctuations near the 3330 mark, it does not show obvious signs of support. It is easy to fall below the area near 3330 in a weak situation. The relatively strong support is in the 3320-3310 area, followed by the area near 3300-3290.
So for short-term trading, I still advocate taking the 3345-3355 area as resistance first and continue to short gold!

Elliott Wave Analysis – XAUUSD | June 11, 2025Currently, the price is moving sideways within a channel.
🔍 Wave Structure Analysis:
Looking closely at the wave patterns inside this price channel, we can clearly see a series of 3-wave structures developing. Previously, we also observed what appears to be an abc corrective pattern (black), which leads me to suspect that we might be forming a triangle structure as the beginning of a wave 1 sequence (12345 in green).
It seems that wave 4 has already completed, and the price is currently in wave 5. Structurally, wave 5 may take the form of a 3-wave move, and the key confirmation we want to see is a break above 3349, signaling that the top of wave 5 is in place.
☄️ Typically, once a wave 1 triangle completes, the market tends to enter a sharp and deep corrective move in the form of a zigzag.
🎯 Potential Target Zones (based on Fibonacci + Volume Profile):
Target Zone 1: 3352 – 3355
Target Zone 2: 3362 – 3365
⚡️ Momentum Outlook :
D1 Momentum: Starting to turn bullish, suggesting the current correction is nearing completion and we could see a bullish week ahead.
H4 Momentum: Currently in overbought territory – I expect the price to break above 3349, followed by a momentum reversal on H4, which could provide a great SELL opportunity at the upper targets.
H1 Momentum: Is about to turn bearish, indicating a short-term pullback may occur. If this correction fails to break below 3315, the price may be completing wave 5 as a 3-wave structure. In that case, we should wait for H1 momentum to turn bullish and then bearish again to confirm wave 5 completion.
📌 Trading Plan :
🔻 SELL Zone: 3352 – 3355
⛔️ Stop Loss: 3369
🎯 TP1: 3334
🎯 TP2: 3307

Another try on the gold short tradeTo be honest, it was beyond my expectation that gold could continue to rebound above 3340. According to my original expectation, the upper limit of gold's rebound in the short term was around 3336-3338. However, gold has already touched around 3342 during the rebound, but because gold failed to close above 3345, I still advocate shorting gold in batches in the 3335-3345 area.
Recently, both the long and short sides of gold have not continued, and the overall market tends to be volatile. In the short term, as long as gold does not break through 3345, gold still has a chance to retrace, which also means that the rebound is an opportunity for us to short gold, but with the rebound of gold, we need to moderately reduce the expectation of gold retracement, so for short-term short gold, our primary retracement target is in the 3325-3320 area.
So for short-term trading, I think we can still try to short gold again!
Elliott Wave Analysis – Trading Strategy Update | June 10, 2025
Currently, the market is presenting multiple wave scenarios with nearly equal probabilities. To avoid noise and gain clarity, we are shifting our analysis to the H4 timeframe.
🔹 Key Price Zone
As highlighted in yesterday’s update, the 3340 level remains a critical resistance. Price failed to break above this level and has since pulled back to 3307.
🔹 Momentum & Volume Profile
- H4 Momentum: Just one more H4 candle and the momentum indicator will likely enter the oversold zone, suggesting that the bearish momentum is weakening.
- Volume Profile: Price is clearly reacting at the green POC zone, with no signs of a breakdown yet.
🧩 Two Main Scenarios:
Scenario 1: Wave 5 Continues Lower
Price is potentially forming wave 5, with:
🎯 Target 1: 3290
🎯 Target 2: 3279
✅ Confirmation: Break below 3294
⚠️ Note: This is the most obvious scenario, and in trading, what’s most obvious often requires the most caution.
Scenario 2: Correction Completed – Wave 3 Uptrend Forming
- The black ABC correction has likely completed.
- The recent upward move could be wave 1; the current pullback is wave 2.
- Wave 3 is expected next.
✅ Necessary Condition: Price breaks above 3340
✅ Sufficient Condition: Price breaks the top of wave b (black)
➡️ For this scenario, limit orders may not be effective — real-time confirmation will be required.
📉 Momentum Overview:
- D1 Timeframe: Approaching oversold territory — likely to see a recovery over the next 5–7 daily candles.
- H4 Timeframe: Also nearing oversold — an intraday bounce is expected today.
🎯 Trading Plan:
🔵 Buy Zone 1:
Entry: 3292 – 3289
Stop Loss: 3282
TP1: 3306
TP2: 3340
TP3: 3375
🔵 Buy Zone 2:
Entry: 3281 – 3279
Stop Loss: 3271
TP1: 3307
TP2: 3340
TP3: 3375

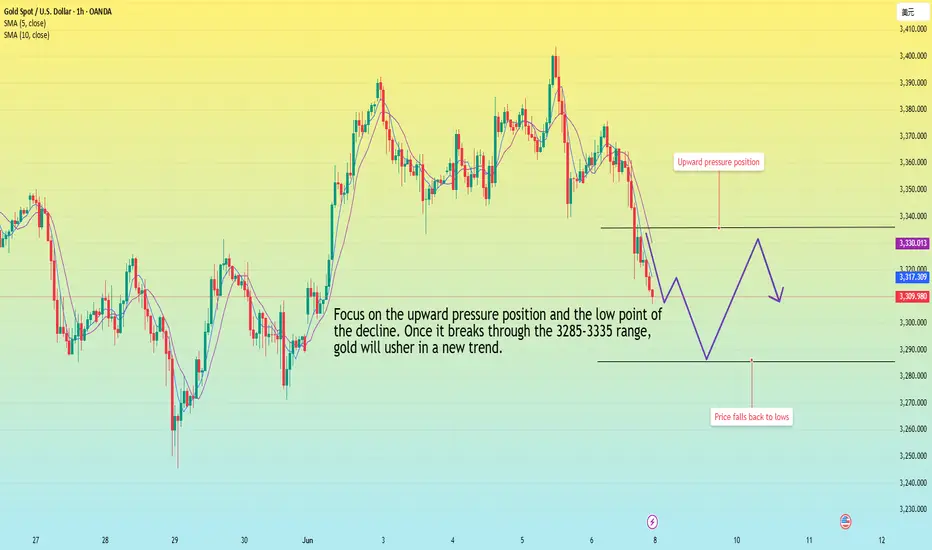
Elliott Wave Pattern – XAUUSD Trading Plan for June 8. 2025Elliott Wave Analysis
After Friday’s deep decline, price touched the level of wave 1 (black), invalidating the flat wave 4 scenario. Currently, the structure of wave 5 (black) appears to be a terminal triangle, and the sharp and steep drop afterward is consistent with post-terminal triangle behavior.
Post wave 5 completion, two possible bearish scenarios emerge:
Scenario 1: Price is forming a zigzag (abc in black). Wave c may have completed at 3305 — the first target. However, 3290 remains a significant lower target. A recovery that breaks above 3340 would help invalidate Scenario 2.
Scenario 2: Price is in a 5-wave bearish impulse. To confirm this, price must not break above 3340, as that would overlap with wave 1 and invalidate the structure. If this holds, the next key target lies below 3245.
Momentum Analysis
Daily (D1): When the market opens this week, momentum is expected to enter oversold territory — suggesting a weakening downtrend. Confirmation is needed.
H4: Momentum is already in oversold territory, indicating a potential bullish move early in the week.
H1: Also oversold. A reversal is likely during the Asian or European session, favoring Scenario 1 and a buy setup near wave c = wave a.
Trading Plan
Buy 3305 – 3302
SL: 3295
TP1: 3340
TP2: 3393
Buy 3292 – 3289
SL: 3282
TP1: 3305
TP2: 3340
TP3: 3393

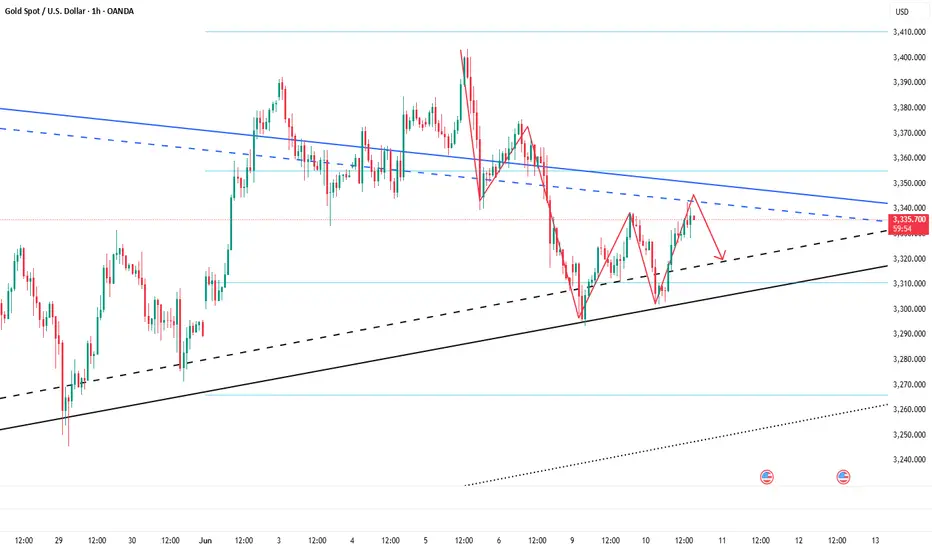
Gold plunges, what will be the trend next week?From the daily chart:
Since the last round of breaking the triangle convergence oscillation and breaking the trend line, gold has surged to 3400, but the upward momentum is insufficient and it has retreated. The low point of the retreat on Friday happened to be the support level of the previous triangle convergence trend line near 3300. If it falls below, the price will return to the triangle convergence oscillation range, and the gold price may fall further;
From the perspective of gold 1 hour, the MA5-day and 10-day moving averages have formed a dead cross downward, so gold still has downward momentum. After the gold 1-hour high box oscillation, gold finally broke through the box downward, indicating that the gold shorts are better, so the bottom of the gold box has now formed resistance, and the gold short-term resistance to gold has been formed near 3335. If gold is 3335 at the beginning of next week, then gold can continue to be short.
Next week's operation strategy is still around the 3285-3335 range.
The rebound is not strong, and gold still has room to fallThere is no good entry point to participate in the transaction at present, but the highlight of today is the NFP market, so there is no need to rush to enter the market when there is no trading opportunity.
Although gold rebounded slightly after touching 3340 overnight, to be honest, the rebound strength is far less than expected, and as long as gold remains below 3365-3375, gold will remain weak in the short term, so I think gold still has room to fall. First, pay attention to the support near 3330, followed by the support near 3310. However, in trading, we must pay attention to guard against the trend of falling after rising in the NFP market.
Trading strategy:
1. Consider continuing to short gold in the 3375-3385 area, TP: 3360-3350;
2. Consider trying to go long gold in small batches in the 3325-3315 area, TP: 3340-3350

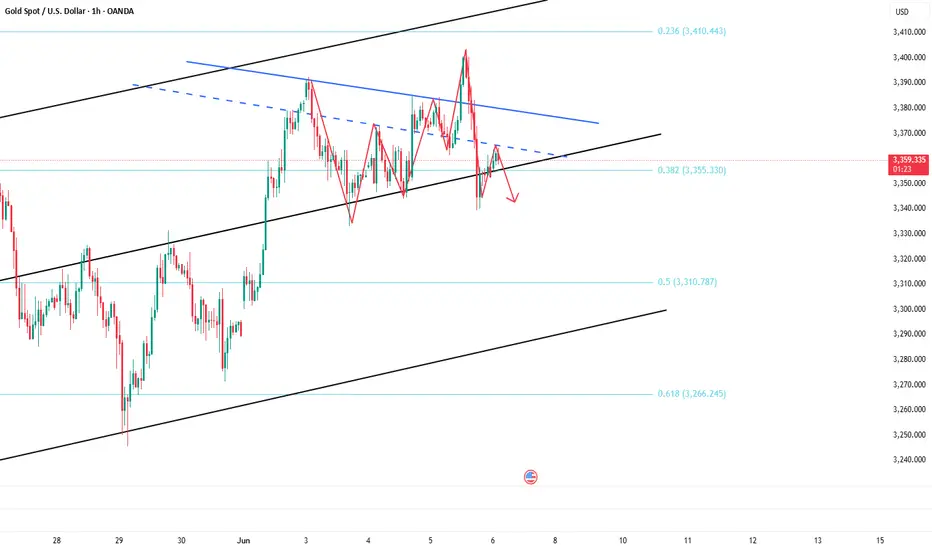
Elliott Wave Analysis – Trade Plan for June 6, 2025
🔍 Current Wave Structure
Yesterday's sharp and impulsive drop suggests a completed 5-wave structure for wave c (red) within a larger flat correction (abc red).
However, this morning's bullish move lacks momentum — candles are overlapping and price has failed to break above the 3383 level. This casts doubt on the current wave being the beginning of a new impulsive trend.
🌀 Scenario 1 – Beginning of a New Impulsive Wave
The current bullish leg may be wave 1, forming as a leading diagonal due to overlapping candles.
Projected target for wave 1: 3380. A pullback from this level could form wave 2, offering a potential long entry around 3347–3344.
⚠️ Scenario 2 – Continuation of a Larger Wave 2 Correction
If price drops back toward 3324, this would invalidate the current impulsive wave count as wave 4 would overlap wave 1 (black) → A larger corrective structure is still unfolding.
The current bounce may then be interpreted as wave a of a larger abc corrective move, suggesting a further decline to come.
🎯 Trading Strategy (Confluence of Both Scenarios)
Sell Zone: 3380–3383 → short-term selling opportunity based on potential wave 1 peak or wave b top.
Buy Zone: 3347–3344 → potential entry if wave 2 completes here (Scenario 1) or wave b ends here (Scenario 2).
📈 Momentum Outlook
Daily (D1): Momentum is fading but a confirmed bearish close today is needed. If confirmed, at least 4 more bearish daily candles may follow.
H4: Momentum is rising, suggesting more upside or sideways consolidation in the short term.
H1: Momentum is about to turn bearish. Ideally, we wait for it to dip into oversold territory and reverse upward — that would be our signal to go long.
🛒 Trade Setup
BUY ZONE: 3347 – 3344
🎯 SL: 3337
🎯 TP1: 3365
🎯 TP2: 3380
🎯 TP3: 3404 (if bullish scenario plays out)
SELL ZONE: 3383 – 3386
🎯 SL: 3393
🎯 TP1: 3365
🎯 TP2: 3347

Short gold after reboundOvernight, gold broke through the 3400 mark due to the intensification of geopolitical risks, but plunged sharply due to the reduction of the risk of Sino-US trade decoupling. Because the news swept up and down, it brought certain difficulties to the transaction. Today, we will focus on the NFP market!
After overnight gold plunged to around 3340, it is currently maintaining a small rebound state. Relatively speaking, the rebound potential is weak, and with the sharp plunge of gold in the short term, the market bulls' confidence has been hit. At present, without major good news, it is difficult to make breakthrough progress based on technical support alone. The upper side faces short-term resistance of 3365-3375 area resistance. If gold cannot break through this area in the short term, gold will be weak!
Trading strategy:
Consider shorting gold in the 3370-3380 area, TP: 3355-3345
Gold is long near 3350 in the US market
It was at 3361 the previous second, and it reached 3348 the next second. The market was directly washing up and down. You said it would fall. It broke through 3400 directly when it rose, but then fell again. It fell directly below the 3350 bullish dividing point when it fell. The current point is around 3353.
Friday is the big non-agricultural data, and we are waiting for the non-agricultural data to be laid out again tomorrow!
Gold: BUY GOLD zone: light position operation (can add positions in batches)
$3344- $3354 SL $3339
TP around3400- 3410
