XLMUSD formed bullish BAT | Upto 46% bullish movePriceline of XLM / US Dollar cryptocurrency has formed a bullish BAT pattern and entered in potential reversal zone.
This PRZ area should be used as stop loss point in case of complete candle stick closes below this area.
I have used Fibonacci sequence to set the targets:
Buy between: 0.060290 to 0.056511
Sell between: 0.069304 to 0.082804
Regards,
Atif Akbar (moon333)
Xlmusdlong

XLM USD LONGThe chart is pretty clear, stellar is about to breakout from a falling wedge.
The volume is insanely green, there is a cup and handle pattern at the end of the falling wedge, indicating reversal.
Also the 5th correcting wave has completed. It couldn't be clearer than this.
It looks to good to be true as a setup.
A breakout above the upper resistance of the cup and handle would signal a buy order.
Not a financial advice, remember to do your own research and set your stop losses.
IF btc collapses the xlmusd pair might fail as well.
Good luck, you can check my previous posts.

XLMUSD Has Formed Crab Within BAT And Competed The Bullish SetupIn my previous post I elaborated that how the price action of Stellar has formed a very big bullish BAT pattern on month chart and completed the bullish setup for upto 596% gains.
But the recent bearish move of price line that was started since Nov 2019 to Dec 2019 and leaded the price action more than 53% down.
The above bearish move pushed the forced the price action to hit the support of potential reversal zone of this big bullish BAT pattern even now the price action is hitting the spike beyond this PRZ support.
But now the price action of Stellar has shown another positive move that it doesn’t move down straight even it is moved down in another Fibonacci sequence which can be clearly seen on 2 day chart with Heikinashi candle sticks setup and it has formed bullish Crab pattern within this potential reversal zone of bigger bullish BAT pattern. For last leg the price action was required to retrace between 1.27 upto 1.618 Fibonacci sequence and if we measure its move then it has retraced upto 1.283 and full filled the requirement and confirmed that it is a bullish Crab:
The above harmonic move of Crab pattern has confirmed that the price action is ready to move up again and the next candle on month chart will be moved again within the potential reversal zone of big Bullish BAT pattern or sideways with the current candle and the fear of breaking down the support of this PRZ level is decreased even finished.
Now the targets can be two:
For mid term trade on 2 day bullish Crab pattern:
Buy between: $0.048953 to $0.038544
Sell between: $0.057035 to $0.076600
This trade setup has potential to give upto 98% profit.
For Long term trade on month chart bullish BAT pattern:
Buy between: $0.110241 to $0.059381
Sell between: $0.231517 to $0.413568
This trade setup has potential to give upto 596% profit.
But if the candle stick closes above the 0.786 Fibonacci projection of A to D leg of bullish BAT which is at $0.413568 then the price action may achieve the highest price ever in the history of xlm or atleast it will hit the final resistance of 0.41 dollar.
In both trades we can use the support of potential reversal zone as stop loss in case of complete candle stick closes below this PRZ level.
Regards,
Atif Akbar (moon333)

Wyckoff Porn: Sexy Stellar DistributesXlmusd possibly has begun Wyckoff Distribution. To confirm, price must close below bottom orange horizontal line.
Distribution can play out many ways. This chart depicts one such way by assuming an ABC type correction in descending parallel channel with indicated target price.

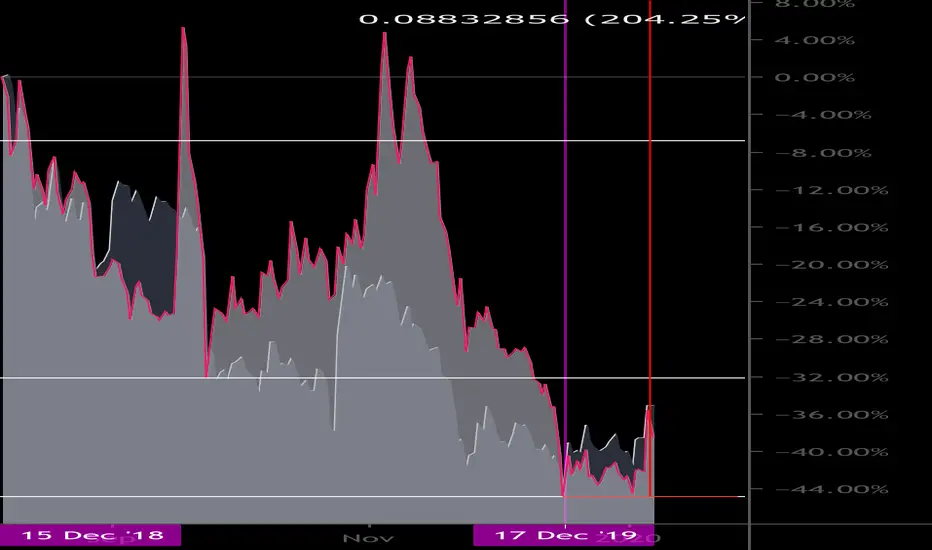
Xlmusd: Fun chart forecasts 200% growthFun chart to play around with. Xlmusd in foreground and Btcusd in background. White horizontal lines correspond to different Xlmusd accumulation phases that started in December ‘18.
Price should rise 200% from Dec ‘19 low.
XLMUSD formed bullish Crab | A long opportunityPriceline of XLM / US Dollar cryptocurrency has formed a bullish Shark pattern and entered in potential reversal zone.
This PRZ area should be used as stop loss point in case of complete candle stick closes below this area.
I have used Fibonacci sequence to set the targets:
Buy between: 0.052774 to 0.051811
Sell between: 0.053524 to 0.055333
Regards,
Atif Akbar (moon333)

XLMUSD formed bullish Crab | A buying opportunityPriceline of XLM / US Dollar cryptocurrency has formed a bullish Crab pattern and entered in potential reversal zone.
This PRZ area should be used as stop loss point in case of complete candle stick closes below this area.
I have used Fibonacci sequence to set the targets:
Buy between: 0.056838 to 0.055971
Sell between: 0.057510 to 0.059134
Regards,
Atif Akbar (moon333)

XLMUSD formed bullish Gartley | Upto 23% expectedPriceline of XLM / US Dollar cryptocurrency has formed a bullish Cypher pattern and entered in potential reversal zone.
This PRZ area should be used as stop loss point in case of complete candle stick closes below this area.
I have used Fibonacci sequence to set the targets:
Buy between: 0.07214152 to 0.06784270
Sell between: 0.07552560 to 0.08360964
Regards,
Atif Akbar (moon333)


XLMUSD formed bullish Cypher | A log opportunityPriceline of XLM / US Dollar cryptocurrency has formed a bullish Cypher pattern and entered in potential reversal zone.
This PRZ area should be used as stop loss point in case of complete candle stick closes below this area.
I have used Fibonacci sequence to set the targets:
Buy between: 0.078361 to 0.077317
Sell between: 0.079354 to 0.081503
Regards,
Atif Akbar (moon333)

The BAT Always Pushed The Stellar To Achieve Highest Price EverThe XLM token started with the opening price of $0.002251 in Jan 2017 as per Kraken exchange and reached at $0.06700 within 4 months on May 2017 that was more than 2,876% huge bullish move which brought the Stellar in lime light and in a very short period of time the token came among the top cryptocurrenices list.
The market cap was increased from 17,173,226 to 585,609,334 which was more than 3310% difference.
Then after May 2017 to July 2017 the XLM faced strong bearish trend and the price action dropped from $0.067 to $0.0122 and that was a really huge loss of more than 81%.
For more than 3 months this bearish trend was continued and on week chart every candle stick was being closed lower than the previous candle stick and the people were expecting more worst situation for future.
Upto July 2017 the Stellar was not as that much older that the traders would get signals from different indicators on week chart even the first exponential moving average with time period of 20 was appeared in May 2017.
The Nature's Role:
But in the meanwhile the nature was playing its role and the supply and demand of traders formed a harmonic pattern that was a bullish BAT harmonic pattern. After initial leg which was from Mar 2017 to May 2017 the B leg was retraced upto 0.50 Fibonacci and B to C leg projected between 0.382 to 0.886 Fibonacci and this was the projection of A to B leg as exactly required for BAT. Then the last C to D leg retraced between 0.786 to 0.886 and this was the potential reversal zone as per bullish BAT, then from July to Aug 2017 the consolidation period started and the price action moved sideways. Then in all of a sudden the exponential moving average 10 which was likely to cross down the EMA 20 to form a death cross, moved aggressively up and in very next week the price action hit the 51 cents which is the all time high sofar by Lumens.
This time the Stellar is making almost similar move and this move is more broader than the previous move of 2017, and we also have more indicators and moving averages available to measure the priceline moves.
After Feb 2018 we had a strong bear move which leaded more than 69% loss then in the month of April 2018 the bulls took the charge again and brought the XLM price upto $0.46200 and recovered more than 59% loss but this move was not for making another high therefore after hitting the $0.46200 the bears took the charge again and leaded the price action upto $0.052 in Sep 2019 which was more than 89% loss from the highest ever price of $0.5100.
1st sign of breakout:
Since Feb 2018 the price action was moving within a pennant and after a year on Feb 2018 the priceline hit the second time on pennant support and this hit produced a bounce which leaded the price to hit the resistance of pennant and broke out on May 2019, during this the exponential moving average 10 was likely to cross up the EMA 20 but could not make this golden cross then a price correction period started which leaded the price again down upto $0.0542, this time the RSI went in oversold zone and now the EMA 10 is again moving up to make another attempt to form a golden cross with EMA 20 if this golden cross will be successfully formed then it can again lead the price action for all time high as it took place in Aug 2017. We have the MACD strong bullish.
Stochastic upto month chart has given bull cross.
The Nature Is Again Playing Its Role:
Again the buying and selling trend from the humans has given the price action some certain directions and the Stellar has formed again a very big natural bullish BAT pattern on month chart.
After initial leg the A to B leg is almost retraced upto 0.50 Fibonacci and B to C leg is moved the projection area of A to B leg between 0.382 to 0.886 Fibonacci and now again the last leg is retraced between 0.786 upto 0.886 Fibonacci And this time the Stellar price is again entered in potential reversal zone of BAT like it was in July 2017 and now we can expect another very strong bullish divergence which can lead the price action to achieve higher than the previous high 51 cents.
Even though this move can lead to the highest ever price in the history of XLM but realistically we can sell between 0.382 ot 0.786 Fibonacci projection of A to D leg, so the targets can be as below:
Buy between: $0.110241 to $0.059381
Sell between: $0.231517 to $0.413568
Regards,
Atif Akbar (moon333)

XLMUSD forming bullish BAT | Upto 22% expectedThe priceline of XLM / US Dollar cryptocurrency is forming last leg of bullish BAT pattern and soon it will be entered in potential reversal zone insha Allah.
This PRZ area should be used as stop loss in case of complete candle stick closes below this zone.
I have used Fibonacci sequence to set the targets:
Buy between: 0.072350 to 0.070104
Sell between: 0.077704 to 0.085743
Regards,
Atif Akbar (moon333)

XLMUSD formed Shark | A good buying opportunityPriceline of XLM / US Dollar cryptocurrency has formed a bullish Shark pattern and entered in potential reversal zone.
This PRZ area should be used as stop loss point in case of complete candle stick closes below this area.
I have used Fibonacci sequence to set the targets:
Buy between: 0.068239 to 0.067357
Sell between: 0.069275 to 0.071303
Regards,
Atif Akbar (moon333)

Stellar Lumens - XLMUSD - 135.2%-1445.5% Profit Expected...Stellar Lumens - XLMUSD - Technical Analysis - 135.2%-1445.5% Profit Expected
Huge Opportunity Coming Ahead To Buy XLM ... 14x - 15x Gains Expected.
Based on AB=CD pattern , Time Ratio & Gann Analysis, It's a potential long position with great returns :)
In a lower time-frame (4hrs) this long position has also been confirmed.
Target Profit Range - 0.08 - 0.34
(135.2%-1445.5% Profit Expected)
TP - 1 - 0.08
TP - 2 - 0.14
TP - 3 - 0.19
TP - 4 - 0.24
TP - 5 - 0.29
TP - 6 - 0.34
Buying Zone! Long Position
Early Entry Trigger Point - 0.028 - 0.034
Ideal Entry Trigger Point - 0.019 - 0.025
***If you want to get in this trade from this point 0.064 you can still make 25% profit till TP1 is reached, however, there is a very high probability that price may hit 0.08-0.09 first before it continues to move down towards my ideal entry point., It is recommended to enter with a smaller lot size if you want to go long right away & manage your stop loss accordingly.
Good Luck.!
Disclaimer - This is not financial advice. This is my personal view and analysis of this chart.
If you follow this idea please plan your trade according to your lot size and account equity.
Don't forget to like, comment & follow , If you agree with my analysis :)

XLMUSD formed bullish Shark | Upto 15% move expectedPriceline of XLM / US Dollar cryptocurrency has formed a bullish Shark pattern and entered in potential reversal zone.
This PRZ area should be used as stop loss point in case of complete candle stick closes below this area.
I have used Fibonacci sequence to set the targets:
Buy between: 0.058006 to 0.055971
Sell between: 0.060180 to 0.064632
Regards,
Atif Akbar (moon333)

XLMUSD forming bullish Cypher | A long opportunity aheadThe priceline of XLM / US Dollar cryptocurrency is forming last leg of bullish Cypher pattern and soon it will be entered in potential reversal zone insha Allah.
This PRZ area should be used as stop loss in case of complete candle stick closes below this zone.
We have strong support of 100 simple moving average within PRZ area.
Volume profile is showing less interest of traders at PRZ level but MACD is strong bearish and Stochastic is in bear cross so for secure trade we can wait for MACD to turn weak bearish or for stochastic to give bull cross then buy from the potential reversal zone.
I have used Fibonacci sequence to set the targets:
Buy between: 0.060683 to 0.059328
Sell between: 0.061773 to 0.064335
Regards,
Atif Akbar (moon333)

XLMUSD is foming a bullish Crab | Upto 28% expectedPriceline of Stellar Lumens / US Dollar cryptocurrency is forming a bullish Crab and soon it will be entered in potential reversal zone insha Allah.
This PRZ area can be used as stop loss in case of complete candle stick closes below this area.
I have defined the targets using Fibonacci sequence:
Buy between: 0.07061740 to 0.06561316
Sell between: 0.07452345 to 0.08409520
Regards,
Atif Akbar (moon333)

XLMUSDT has formed bullish Shark | A good long opportunityThe priceline has formed a shark pattern and entered in potential reversal zone.
All the pattern is behaving exactly required for shark therefore I have ignored the difference of C leg.
MACD is turned weak bearish from strong bearish soon it will be turned bullish.
RSI is oversload.
Stochastic has given bull cross so I am expecting the price action will hit the sell target soon insha Allah.
The PRZ area can be used as stop loss point in case of a complete candle stick closes below this area.
I have used Fibonacci sequence to set the targets:
Buy between: 0.05815 to 0.05715
Sell between: 0.05901 to 0.06099
Regards,
Atif Akbar (moon333)

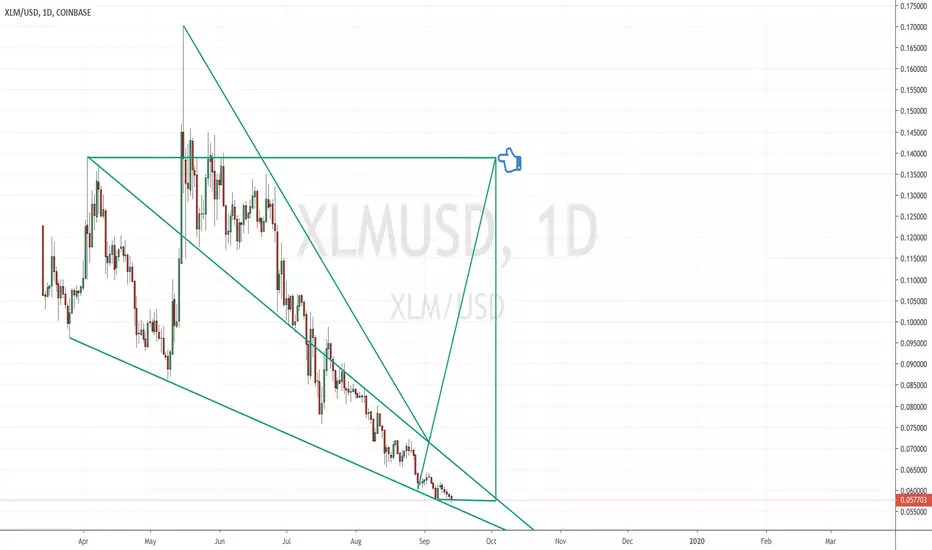
Possible Bullish Run to 0.14 By First Week of OctoberXLMUSD currently consolidating at the bottom and gearing up for a rapid pump to 0.14 - 0.15 area by early next month, October. Time for a short bullish run. For those not in US, take advantage of YouHodler's TurboCharge Crypto loan program to obtain more lumens.
XLMUSD extended the leg and formed bullish CRABIn my previous chart I published a BAT pattern but the price action has extended the leg and formed a bullish bulish CRAB pattern therefore I have revised the targets using Fibonacci sequence as below:
Buy between: 0.06011224 to 0.05896802
Sell between: 0.06099956 to 0.06315821
Regards,
Atif Akbar (moon333)

XLMUSD formed bullish BAT | A good long opportunityOn 4hr chart priceline of XLM / Dllar has formed a bullish BAT and entered in potential reversal zone to hit the sell targets soon insha Allah.
Volume profile is showing less interest of traders within PRZ area.
But MACD is strong bearish and Stochastic did not give bull cross therefore I would recommend to wait for MACD to turn weak bearish or stochastic to give bull cross then buy.
I have defined targets using Fibonacci sequence:
Buy between: 0.06170363 to 0.06137483
Sell between: 0.06248766 to 0.06366458
Enjoy your profits and Regards,
Atif Akbar (moon333)

XLMUSD has formed a bullish BAT | Upto 596% possibilityPriceline of XLM / US Dollar has formed a bullish BAT pattern and entered in potential reversal zone and ready to hit the sell targets soon insha Allah.
But the volume profile is still showing the traders interest below the PRZ area even the POC of volume profile is also below the potential reversal zone, therefore I would suggest for secure trade we can wait for stochastic to give bull cross and for the MACD to turn weak bearish from strong bearish atleast upto 2 week chart and also use the potential reversal zone as stop loss (In case the candle stick will be completely closed below the potential reversal zone).
I have used Fibonacci sequence to set the targets:
Buy between: 0.110241 to 0.059381
Sell between: 0.231517 to 0.413568
Enjoy your profits and Regards,
Atif Akbar (moon333)

XLMUSD has formed bullish CRAB pattern |and entered in PRZ areaOn 4 days chart priceline of Stellar / US Dollar cryptocurrency has formed a bullish CRAB pattern and entered in potential reversal zone.
RSI is oversold.
MACD is turned weak bearish from strong bearish.
Volume profile of complete pattern is showing less interest cryptocurrency trading at this area.
I have defined targets using Fibonacci sequence:
Buy between: 0.06878953 to 0.04329465
Sell between: 0.08854757 to 0.13640667
Enjoy your profits and regards,
Atif Akbar (moon333)
