$XMR 308% gain
Higher because of the "third touch" at a resistance level, usually first two touches validate the resistance. The third touch breaks through, indicating a uptrend, This is actually market psychology and the belief that repeated tests of resistance weakens it!
You have had 500 days to buy ad that major support level which is the white support line, OMXSTO:XMR has broken out from the blue dashed line and in short term can easily pump to the green resistance line and break that level as well!
Xmr

XMR vs. ETH: Two Patterns Unfolding! 📈✨Today, let's embark on a fascinating journey comparing two heavyweights in the crypto realm—Monero (XMR) and Ethereum (ETH). These titans share a common thread with identical patterns on the weekly timeframe. However, the tale takes a compelling twist as Ethereum takes the lead, already executing a breakout, while Monero patiently accumulates within an ascending triangle. Let's delve into the details of these intriguing market narratives. 🔄💡
Unveiling the Parallel Patterns:
ETH's Commanding Breakout:
Ethereum's Leadership: ETH has already demonstrated its strength with a decisive breakout from its pattern.
Trailblazing Moves: Ethereum's proactive stance sets the tone for the broader market, showcasing early signs of bullish sentiment.
Monero's Patient Accumulation:
Ascension within Triangle: Monero, on the other hand, is quietly accumulating within an ascending triangle.
Building Pressure: This pattern often indicates a building of pressure, hinting at an impending breakthrough.
Analyzing Market Dynamics:
Ethereum's Momentum:
Pacing Ahead: Ethereum's breakout suggests a surge in investor confidence and potential sustained momentum.
Market Sentiment: Traders keen on Ethereum should stay attuned to the prevailing market sentiment for further cues.
Monero's Strategic Positioning:
Strategic Accumulation: Monero's patient accumulation implies a strategic positioning, aligning itself for a potential upward movement.
Watch for Breakout: Traders eyeing Monero should be on the lookout for a breakout, which could trigger significant price action.
Trading Considerations:
ETH as a Market Indicator:
Leading Indicator: Ethereum's movements often serve as a leading indicator for the broader market.
Reference Point: Traders across various assets can use Ethereum's performance as a reference for market sentiment.
Monero's Breakout Play:
Timing is Key: Timing the breakout for Monero is crucial, and traders should position themselves strategically.
Confirmation Signals: Look for confirmation signals, such as increased volume and sustained price movement.
Conclusion:
As Ethereum and Monero unfold their respective stories on the charts, traders and enthusiasts alike find themselves at a crossroads of opportunity. Ethereum's breakout sets a positive tone, while Monero's patient accumulation suggests a potential surge in the making. Navigate these narratives with diligence and strategy for a rewarding journey.
❗️Get my 3 crypto trading indicators for FREE!
Link below🔑

XMR/USDTMonero is printing a inverse head and shoulders pattern inside of a symmetrical triangle, the diagonal dotted line is acting as support right now, I have measured both targets for both patterns.
GL

monero waiting for break out.Monero try to break small channel down pattern.
If XMR success to break up, we will have a good bullish movement with target at fibonacci projection.
this target at $186.6 also same level as january resistance
don't forget to like this analysis,
If you have any question, do not hesitate to contact me
Your support at this analysis will also support Monero to reach bullish target
Click here to check my other analysis

XMRUSDT.1DBased on the provided market data for XMR (Monero), the current price stands at 169.4 USDT. The Relative Strength Index (RSI) for 4 hours, 1 day, and 7 days are 52.05, 63.38, and 62.35 respectively. These values indicate that the coin is neither overbought nor oversold.
The Moving Average Convergence Divergence (MACD) values for 4 hours, 1 day, and 7 days are 0.4, 3.4, and 2.3 respectively. The MACD is a trend-following momentum indicator that shows the relationship between two moving averages of a security's price. The current MACD suggests a bullish trend in the short term.
The Bollinger Bands (Bb) for 4 hours, 1 day, and 7 days are 172.4, 176.9, and 177.4 respectively. Bollinger Bands are a type of statistical chart characterizing the prices and volatility over time and these values suggest that the price is relatively stable, with slight volatility.
The support levels for 4 hours are 167.5, 162.8, and 159.0; for 1 day are 166.0, 158.0, and 146.9; and for 7 days are 156.7, 136.0, and 131.0. Support levels are the levels at which the price rarely falls below.
The resistance levels for 4 hours are 173.0, 182.0, and 187.0; for 1 day are 176.0, 187.0, and 209.0; and for 7 days are 188.0, 211.0, and 240.0. Resistance levels are the levels the price rarely surpasses.
In summary, based on the technical indicators, XMR seems to be in a bullish trend in the short term as indicated by the MACD. However, the RSI values show that the coin is not in the overbought or oversold territory, suggesting a balanced demand-supply scenario. The Bollinger Bands indicate that the price is relatively stable with slight volatility. The support and resistance levels provide potential points of reversal for consideration.
Please remember, this analysis is based on historical data and does not guarantee future performance. Always conduct your own research and consider your financial situation before investing in cryptocurrency.

has monero bottomed on btc and usd pair?xmr has touched the bottom channel and find supports on the 50 moving average.
looking at my other xmr charts and and an area of resistance i previously highlighted in both has proven difficult to break past.
the btc pair now looks to be breaking that resistance and that alongside the usd pair in its position im bullish and ask are we going to see a merry xmas $800 xmr?

Bullish time at MoneroI have a big bullish target for monero at previous analysis, and today I found another bullish pattern.
After symetrical triangle resistance broken (previous analysis),
we have diagonal support line (black). This support will be a good line to hold next bearish movement if we have pullback.
Monero also touch fibonacci 0.618 support with a big shadow, 1.618 profit projection at $185.51 will be a good target for now.
$174.72 previous high become new bullish confirmation. If this level break up today, we will reach $185.51 target soon.
I will update more about Monero if I found another great pattern
Don't forget to support this analysis,
If you have any question, do not hesitate to contact me
Your support at this analysis will also support Monero to reach bullish target
Click here to check my other analysis


Monero 149% profit projectionDaily timeframe
If we look at daily timeframe, Monero reach major resistance (black line).
This resistance forming a big symetrical triangle pattern with a big range, and if this reistance break up, $427 will be a good bullish target with 149% profit projection.
If we zoom in, I have smaller symetrical triangle pattern, with 62% profit projection at $262. The good news is, this pattern already broken.
you can see the detail here :
4 Hour timeframe
After break up blue symetrical triangle pattern, bullish flag pattern perform. We have previous support and also fibonacci support at $164.50, and right now, Monero touch it.
1.618 fibonacci Profit projection at $181.45 with 10.39% profit ratio
you can see details here :
In this analysis we have 3 target :
149% profit projection at $427
62% profit projection at $62
10.39% profit projection at $181.45
If you have any question, do not hesitate to contact me, and
your support at this analysis also support Monero to reach bullish target.
Happy trading


XMR elliot wave analysisHi
here is the complete wave analysis of XMRUSDT which is filling the wave X

Nice Cup and Handle on XDCXDC has a nice cup and handle that has formed. A break above 7.5 cents would confirm and a run to $1+ could be in the cards for 2024. This next bullrun will be swift and fast. Just my opinion, not financial advice. Thank you.

XMR - A Range But Strong 💪Hello TradingView Family / Fellow Traders. This is Richard, also known as theSignalyst.
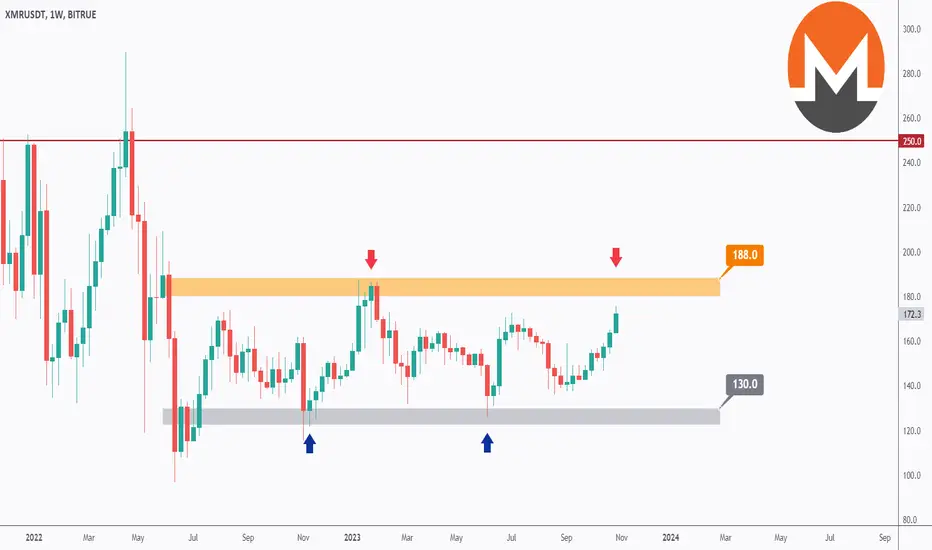
📊 XMR has been stuck inside a wide range between 130.0 and 188.0.
Currently, #XMR is hovering around the upper bound of the range.
📉 For the bulls to remain in control and take over from a long-term perspective, we need a break above the 188.0 resistance. In this case, we can expect further bullish movement toward the next resistance at 250.0.
📈 Meanwhile, the bears can still take control and reject the resistance. Confirmation will come if a bearish reversal setup is activated on the H4 chart.
Which scenario do you think is more likely to happen and why?
📚 Always follow your #trading plan regarding entry, #risk management, and trade #management.
Good luck!
All #Strategies Are Good; If Managed Properly!
~Rich
XMRUSDT Awaits Explosive Growth⚪ XMR has been locked in a year-long triangle pattern, where it straddles the line between bullish enthusiasm and caution. The crucial takeaway here is the unwavering commitment to the long-term demand, as evidenced by its faithful respect for the uptrend trendline. This, my fellow traders, is a strong indicator of the resilience and potential staying power of Monero. 📊
⚪ However, the crypto remains tethered under the grasp of the downtrend trendline, an aspect that often makes investors hesitate. But let's not overlook a significant development – the recent and clean bounce off the 78.6% Fibonacci retracement level. This isn't just a bounce; it's a sturdy support, working in harmony with the uptrend trendline.
⚪ The magic number to remember is $134 – a key support zone that, when respected, solidifies our confidence in the continuation of an uptrend. It's important to comprehend our trading strategy. We've decided to seize the moment and take a long position in XMR without waiting for the elusive breakout of the downtrend trendline. Why, you ask? Well, we've already identified a compelling risk-reward setup.
⚪ Moreover, we're keeping a close watch on the downtrend trendline. It may very well crumble under the pressure of intensified buying, presenting a slightly tardy but still promising entry point for long-term buyers. The nitty-gritty, including our trade signal with stop loss and take profit levels, is conveniently available in our channel.

XMR can go upBy examining the chart, it seems that we have a symmetrical one, and its final branch, i.e., looks like a triangle.
It can go up by keeping the green area. The red box can be the target of this upward movement
This is an update to the analysis linked in the relevant section
For risk management, please don't forget stop loss and capital management
Comment if you have any questions
Thank You

XMR is near the razor's edge!From where I entered "START" on the chart, the XMR symbol has entered the corrective phase.
The structure of this corrective phase is twofold. We've had a diametric followed by a wavy X and then another diametric again. We are now at the end of the second diametrical F wave. Wave G can end somewhere between the drawn fibos corresponding to the relativity of wave A to wave G of the second diametric.
For risk management, please don't forget stop loss and capital management
Comment if you have any questions
Thank You

XMR in radarLast week on OCT 6, XMR price broke ranging market resistance that have been last for 2 months since AUG 2023. Believe XMR market would last its uptrend momentum and challenging next daily chart resistance level at 172, 187.
R1- 172
R2- 187

XMRUSDT's Low-Risk, High-Reward TradeXMRUSDT currently offers an exceptional risk/reward ratio, making it an enticing buying opportunity. Our approach is conservative, emphasizing minimal risk exposure while holding the potential for substantial profits.

XMR BACK IN VOLUME $187Thank you for reading our update. Please keep in mind that this is not trading advice.
XMR can have a new cycle range for uptrend volume
In the coming period, XRM can play new cycle since XMR shows volume

XMR/USDT Break Alert, Bullish Momentum ?? Moreno Analysis Today💎 XMR has certainly caught our attention. After breaking out of the ascending triangle, XMR showcased a notable upward surge. However, it currently faces resistance at the supply zone, and given the candlestick patterns, there's a likelihood of XMR retracing back to the support level to gather momentum for another attempt at breaching the supply.
💎 Should XMR manage to break through the supply zone swiftly, we could witness a significant rally, propelling it towards the major resistance area.
💎 On the flip side, if XMR retraces to the supply and fails to find solid footing at the support, there's a risk of it dropping further. In such a scenario, XMR might revisit the robust demand zone once more.

Long Privacy Coin Leader: Monero XMR, Follower Zcash ZECLazarus Group, an infamous hacking group of an unknown number of cyber criminals allegedly run by the government of North Korea, currently holds more than $47 million worth of crypto assets in their wallets. The blockchain analytics provider Dune Analytics, which gathers on-chain crypto data and makes it accessible to the blockchain community, revealed that stolen assets include Bitcoin, Ethereum, BNB, and Binance USD, among other stablecoins.
Still, the current amount of stolen funds has dropped by $39 million compared to the $86 million the Lazarus-linked wallets held on September 6. The figure was noticed a few days after the online gambling platform Stake became a victim of the group and lost $55 million in the incident.
coinmarketcap.com

XMRUSDTIn the weekly timeframe, the head and shoulders pattern is quite evident, and in the event of a Bitcoin decline in the long term, this currency has the potential to drop to the range of $80.

Box range: 140.50-148.12Hello?
Hello traders!
If you "Follow" us, you can always get new information quickly.
Please also click “Boost”.
Have a good day.
-------------------------------------
(XMRUSDT chart)
(1D chart)
To continue the downward trend, it must fall below 143.43 and show resistance.
If not, it is expected to rise above 145.55-146.69.
However, since a trend is expected to be formed only when it breaks out of the 140.50-148.12 box range, I think it is better to respond briefly when trading within the box range.
(1h chart)
Support and resistance areas are formed in the 142.88-145.0 range.
Therefore, in order to maintain SHORT, it must fall below the 142.88-143.91 range.
Therefore, it is recommended to respond briefly in the 142.88-145.0 range.
If it falls below 142.88, it is expected to fall to around 137.8-139.03.
If it rises above 145.0, it is expected to rise to around 147.15-147.55.
--------------------------------------------------
To sum up, since it is within the box section, short section trading using the top and bottom of the box section is in progress.
If you do not want to trade in a short corresponding zone, it is better to wait for a break out of the box zone on the 1D chart.
-------------------------------------------------- -------------------------------------------
** All explanations are for reference only and do not guarantee profit or loss in investment.
** Trading volume is displayed as a candle body based on 10EMA.
How to display (in order from darkest to darkest)
More than 3 times the trading volume of 10EMA > 2.5 times > 2.0 times > 1.25 times > Trading volume below 10EMA
** Even if you know other people’s know-how, it takes a considerable amount of time to make it your own.
** This chart was created using my know-how.
---------------------------------
